| Param | Original file | Final file |
|---|---|---|
| Filename | modeM0/AS1A11_079T01_9000005284_37196cztM0_level2.evt | modeM0/AS1A11_079T01_9000005284_37196cztM0_level2_quad_clean.evt |
| Size (bytes) | 1,313,616,960 | 172,880,640 |
| Size | 1.2 GB | 164.9 MB |
| Events in quadrant A | 7,982,188 | 1,060,950 |
| Events in quadrant B | 8,240,315 | 1,069,555 |
| Events in quadrant C | 11,294,802 | 1,051,276 |
| Events in quadrant D | 11,214,857 | 978,524 |
| Mode M9 | |||
|---|---|---|---|
| Quadrant | BADHDUFLAG | Total packets | Discarded packets |
| A | 0 | 53 | 0 |
| B | 0 | 53 | 0 |
| C | 0 | 53 | 0 |
| D | 0 | 53 | 0 |
| Mode SS | |||
|---|---|---|---|
| Quadrant | BADHDUFLAG | Total packets | Discarded packets |
| A | 0 | 318 | 0 |
| B | 0 | 318 | 0 |
| C | 0 | 318 | 0 |
| D | 0 | 318 | 0 |
| Mode M0 | |||
|---|---|---|---|
| Quadrant | BADHDUFLAG | Total packets | Discarded packets |
| A | 0 | 33735 | 5 |
| B | 0 | 34991 | 4 |
| C | 0 | 43228 | 4 |
| D | 0 | 44359 | 4 |
| Quadrant | Total seconds | Saturated seconds | Saturation percentage |
|---|---|---|---|
| A | 15581 | 110 | 0.705988% |
| B | 15581 | 133 | 0.853604% |
| C | 15581 | 703 | 4.511906% |
| D | 15581 | 912 | 5.853283% |
Noise dominated data is calculated using 1-second bins in cleaned event files. If a bin has >2000 counts, and if more than 50% of those come from <1% of pixels, then it is considered to be noise-dominated and hence unusable.
| Quadrant | # 1 sec bins | Bins with >0 counts | Bins with >2000 counts | High rate bins dominated by noise | Noise dominated (total time) | Noise dominated (detector-on time) | Marked lightcurve |
|---|---|---|---|---|---|---|---|
| A | 19760 | 15584 | 77 | 77 | 0.39% | 0.49% | 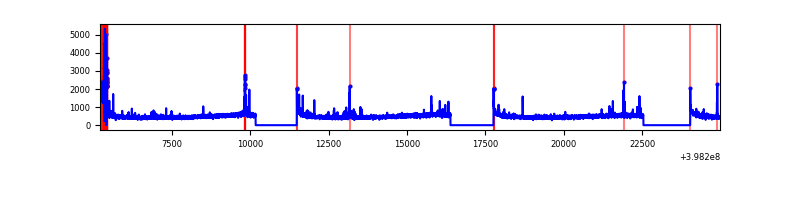 |
| B | 19760 | 15584 | 68 | 68 | 0.34% | 0.44% | 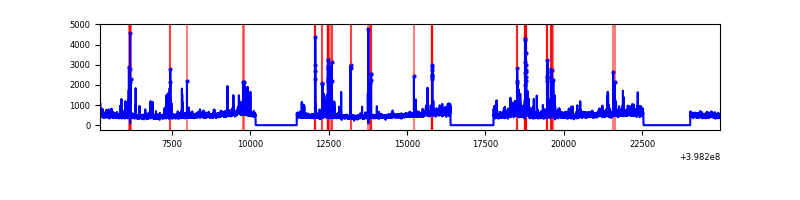 |
| C | 19760 | 15584 | 987 | 987 | 4.99% | 6.33% | 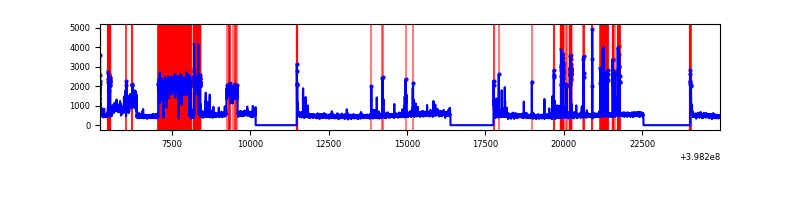 |
| D | 19760 | 15584 | 919 | 919 | 4.65% | 5.90% | 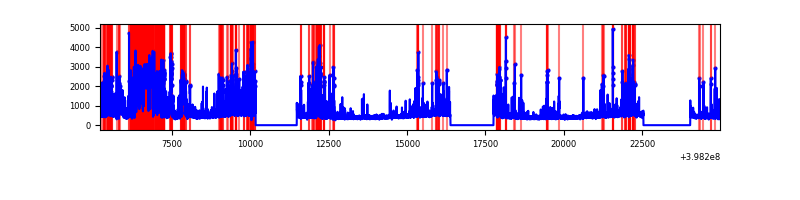 |
Top three noisy pixels from each quadrant. If the there are fewer than three noisy pixels in the level2.evt file, extra rows are filled as -1
| Pixel properties | Quadrant properties | ||||||
|---|---|---|---|---|---|---|---|
| Quadrant | DetID | PixID | Counts | Sigma | Mean | Median | Sigma |
| A | 10 | 83 | 637555 | 1782.6 | 1780 | 1748 | 356.7 |
| A | 15 | 237 | 267245 | 744.37 | 1780 | 1748 | 356.7 |
| A | 7 | 3 | 114492 | 316.1 | 1780 | 1748 | 356.7 |
| B | 5 | 172 | 441141 | 1309.75 | 1764 | 1719 | 335.5 |
| B | 0 | 213 | 397241 | 1178.9 | 1764 | 1719 | 335.5 |
| B | 0 | 245 | 123358 | 362.56 | 1764 | 1719 | 335.5 |
| C | 10 | 49 | 3018128 | 7546.08 | 1717 | 1730 | 399.7 |
| C | 15 | 214 | 650350 | 1622.64 | 1717 | 1730 | 399.7 |
| C | 1 | 23 | 634319 | 1582.54 | 1717 | 1730 | 399.7 |
| D | 10 | 253 | 2566804 | 6190.58 | 1701 | 1655 | 414.4 |
| D | 2 | 249 | 1147584 | 2765.52 | 1701 | 1655 | 414.4 |
| D | 13 | 249 | 298387 | 716.12 | 1701 | 1655 | 414.4 |
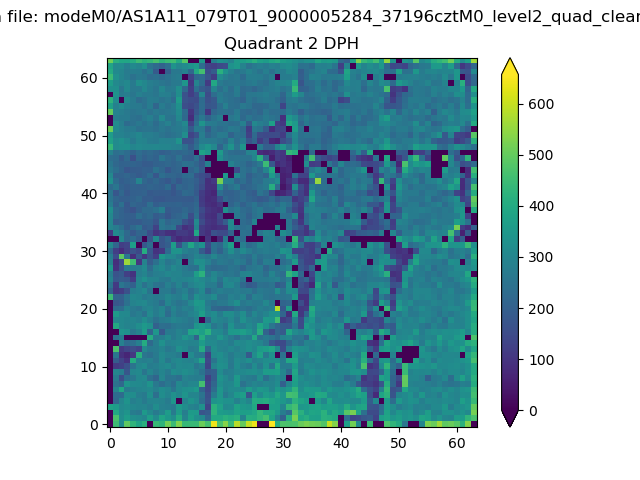
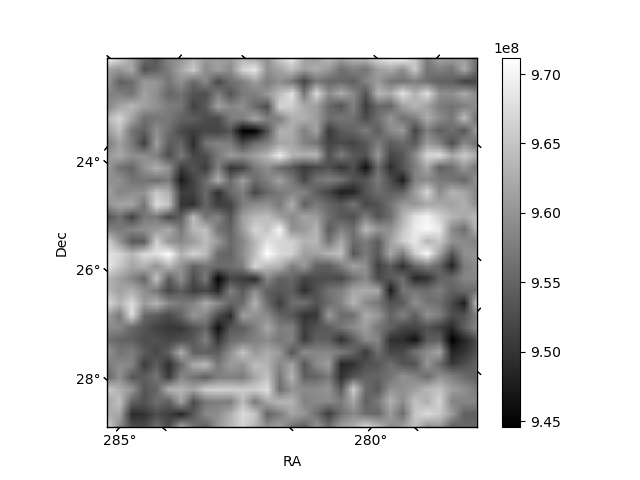
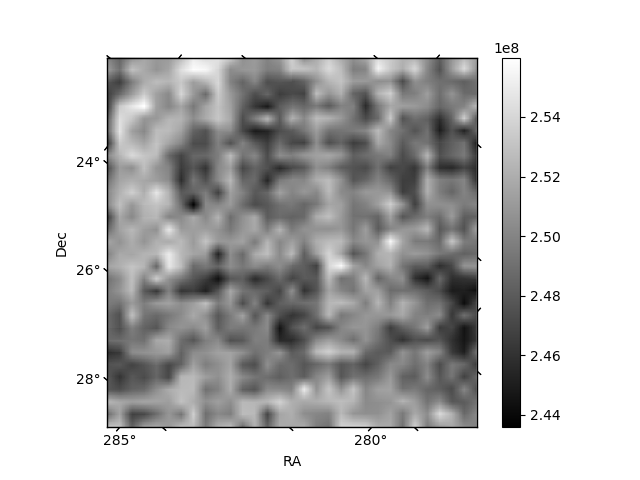
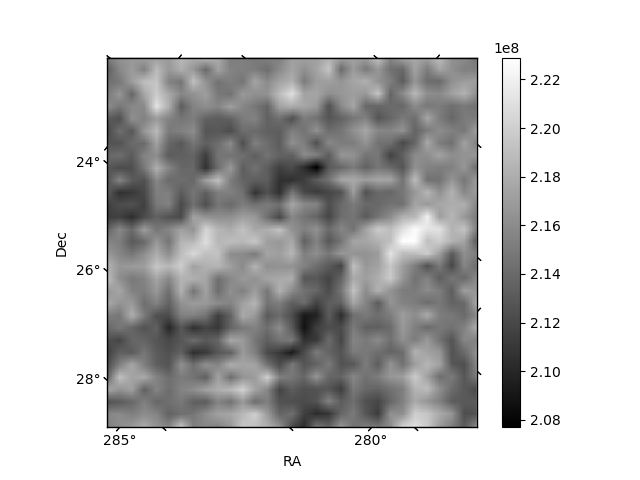
Histogram calculated using DETX and DETY for each event in the final _common_clean file
| Quadrant A | 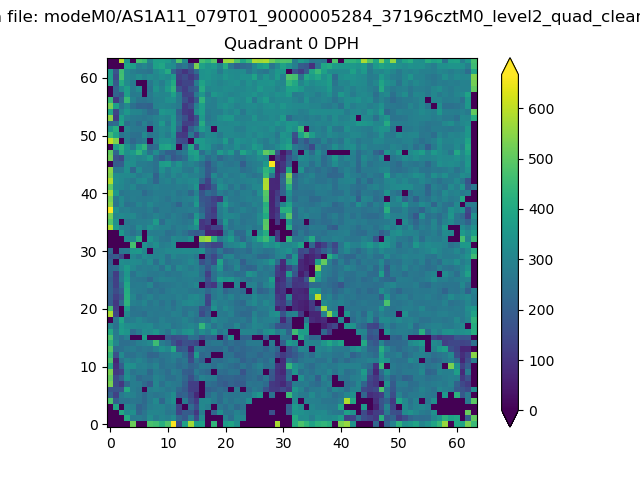 |
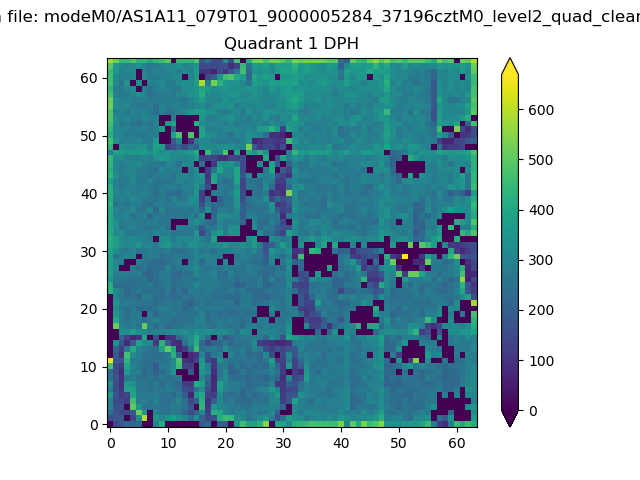 |
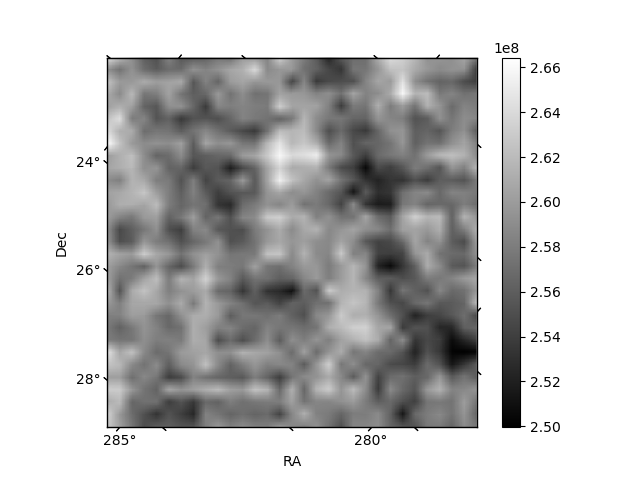
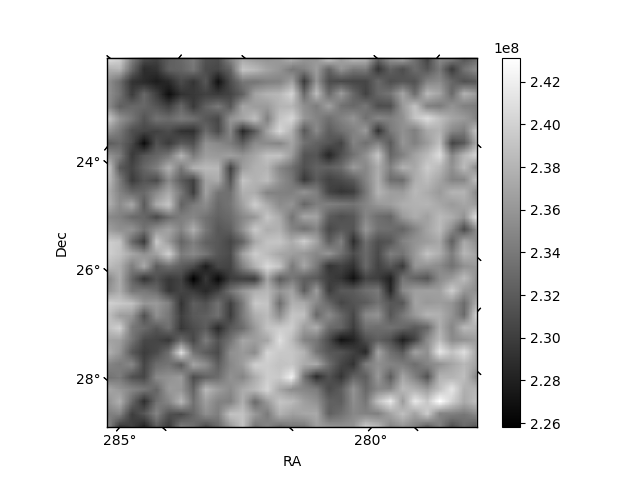
Quadrant B |
|---|---|---|---|
| Quadrant D | 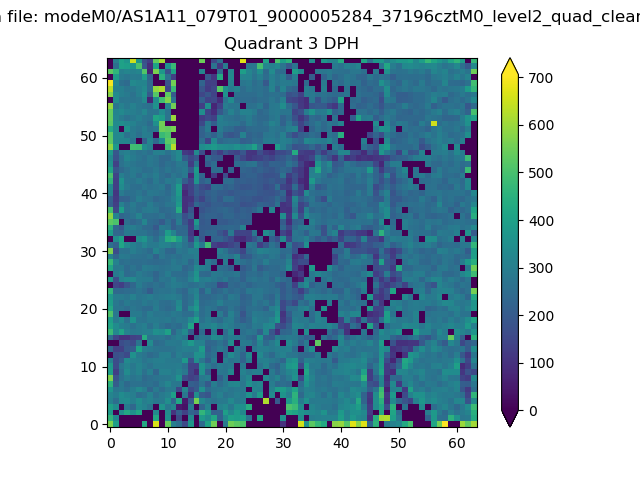 |
 |
Quadrant C |
| Plot type | Count rate plots | Images |
|---|---|---|
| Comparison with Poisson distribution Blue bars denote a histogram of data divided into 1 sec bins. Red curve is a Poisson curve with rate = median count rate of data. |
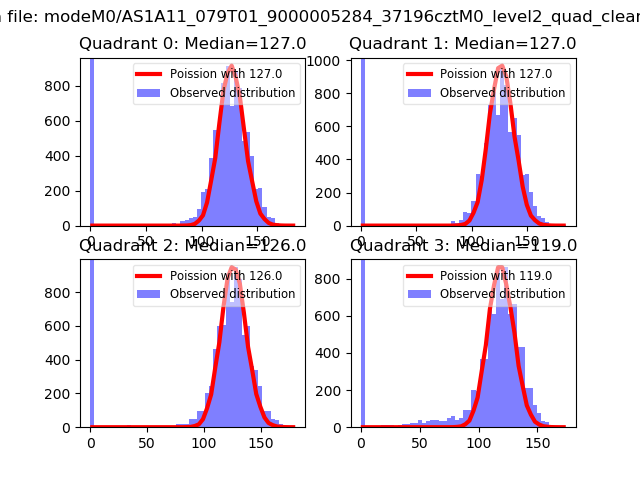 |
 |
| Quadrant-wise count rates Data is divided into 100 sec bins |
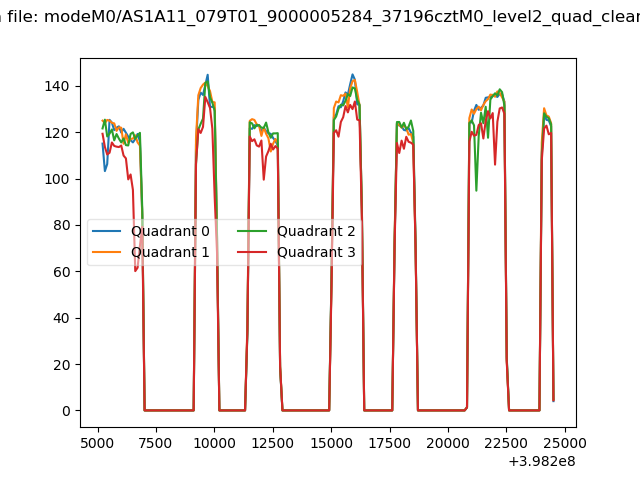 |
|
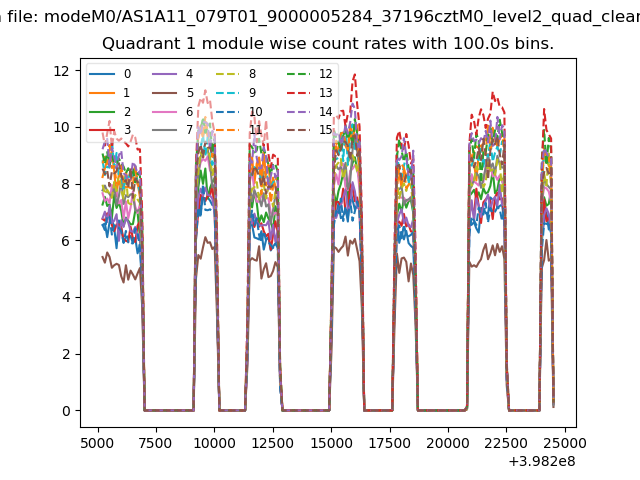
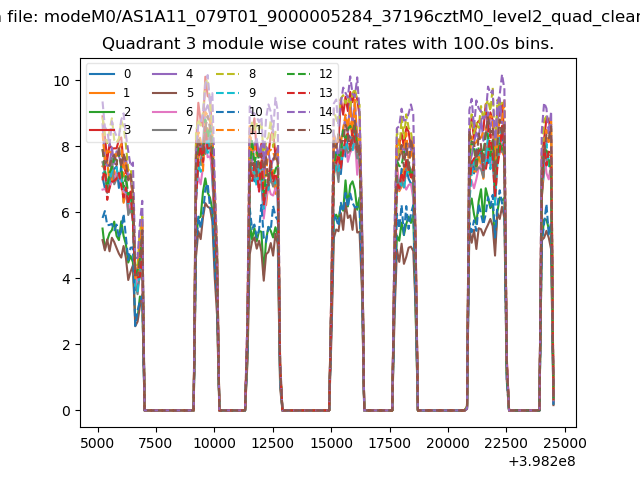
| Module-wise count rates for Quadrant A Data is divided into 100 sec bins |
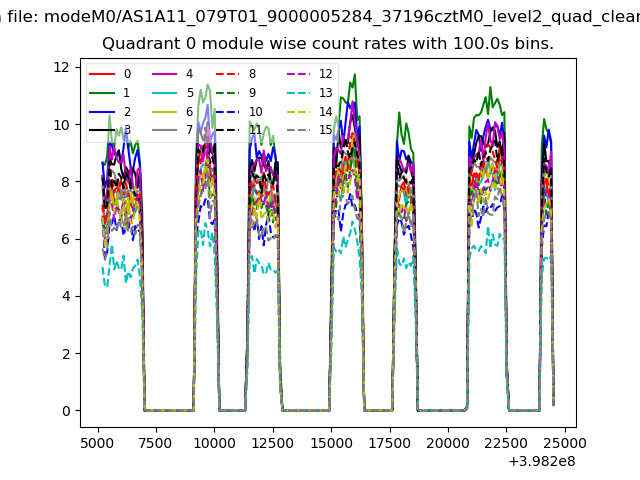 |
 |
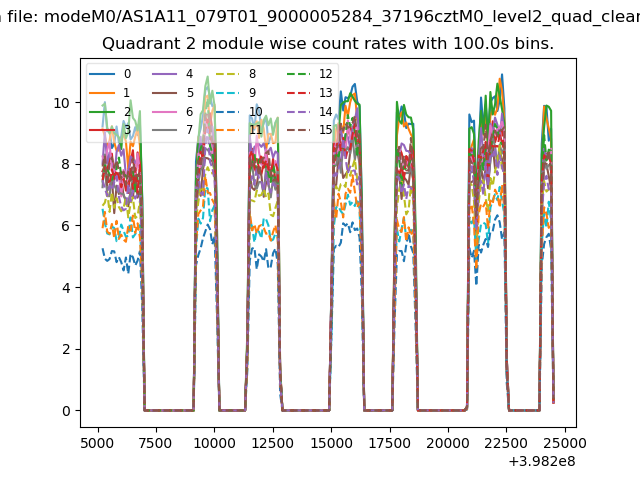
| Module-wise count rates for Quadrant B Data is divided into 100 sec bins |
 |
 |
| Module-wise count rates for Quadrant C Data is divided into 100 sec bins |
 |
 |
| Module-wise count rates for Quadrant D Data is divided into 100 sec bins |
 |
 |
| Parameter | Plot |
|---|---|
| CZT HV Monitor | 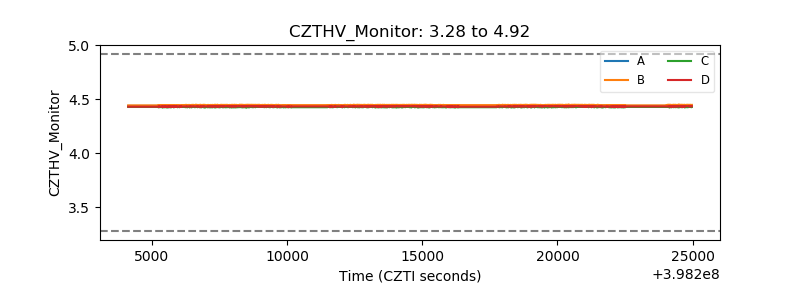 |
| D_VDD | 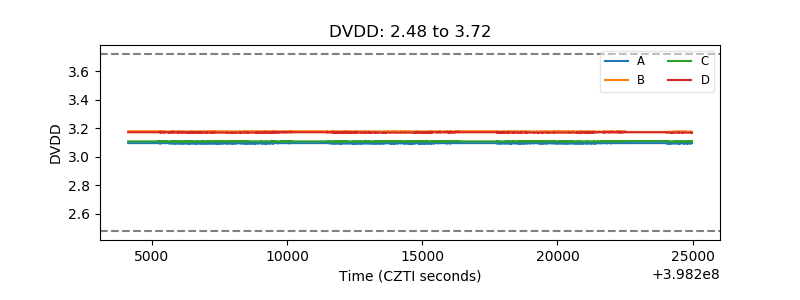 |
| Temperature 1 | 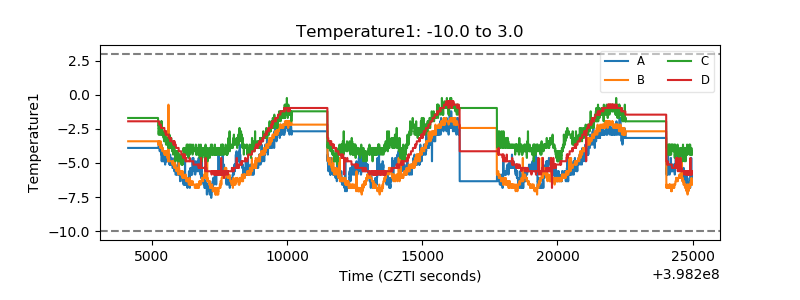 |
| Veto HV Monitor | 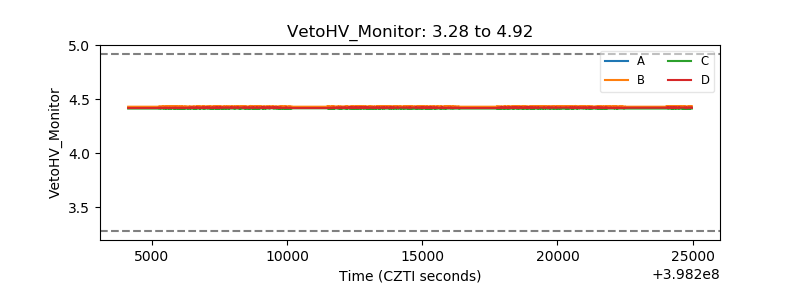 |
| Veto LLD | 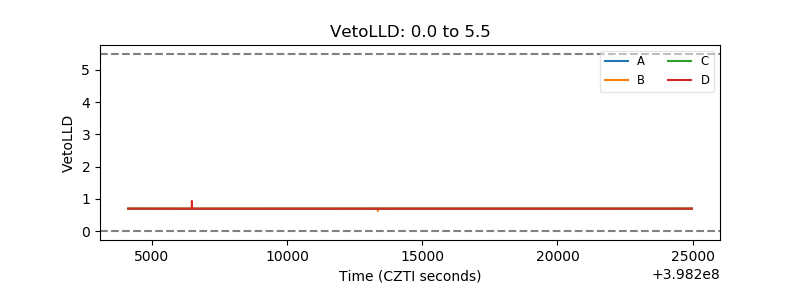 |
| Alpha Counter | 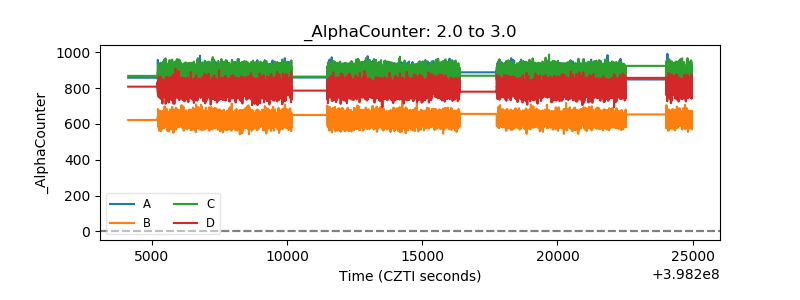 |
| _CPM_Rate | 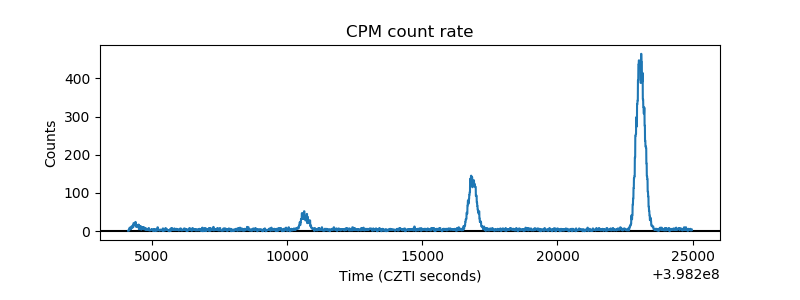 |
| CZT Counter | 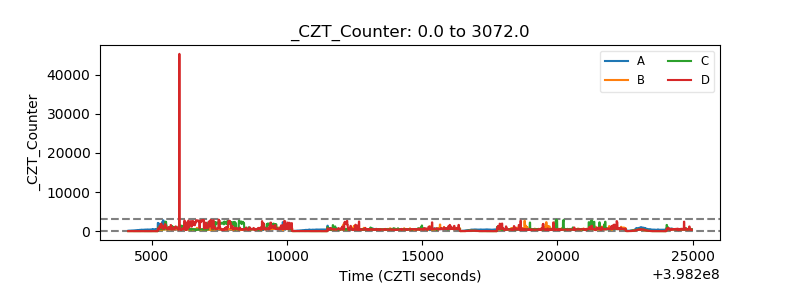 |
| +2.5 Volts monitor | 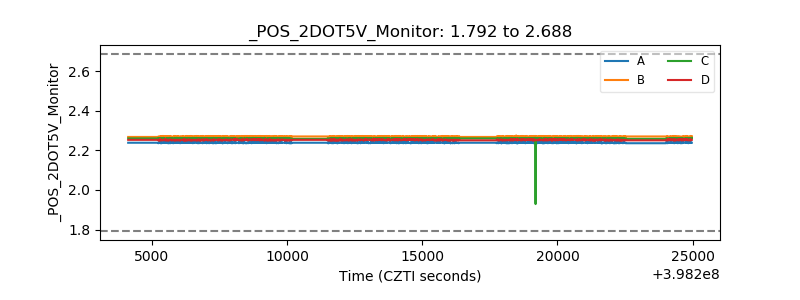 |
| +5 Volts monitor | 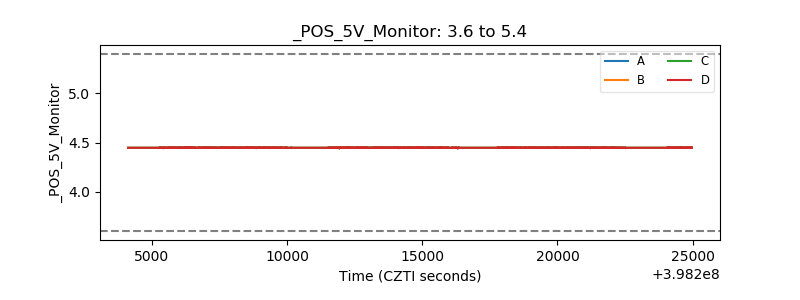 |
| _ROLL_ROT | 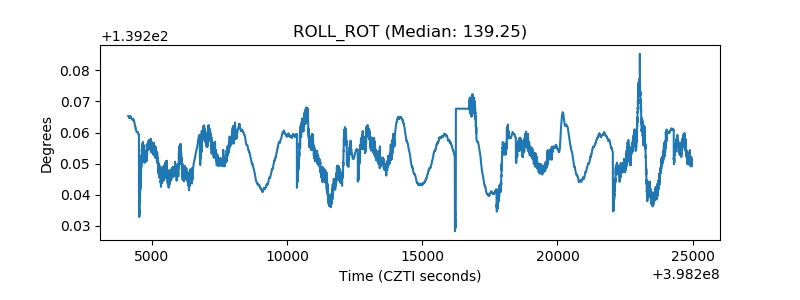 |
| _Roll_DEC | 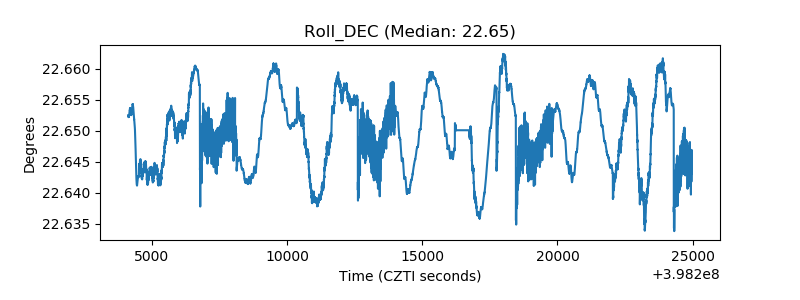 |
| _Roll_RA | 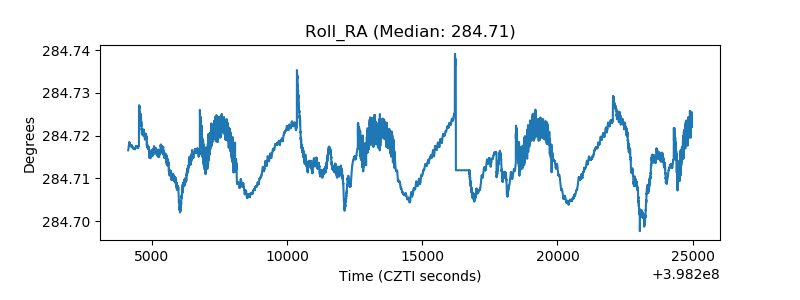 |
| Veto Counter | 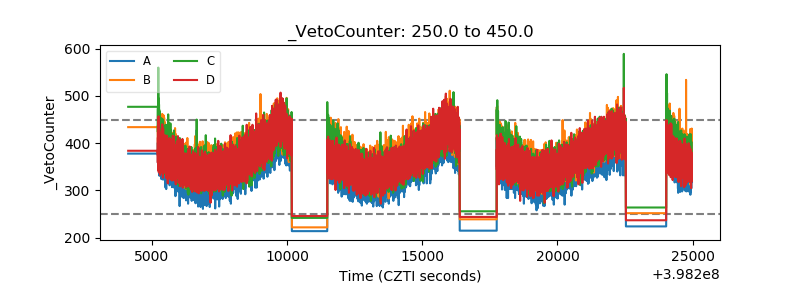 |