| Param | Original file | Final file |
|---|---|---|
| Filename | modeM0/AS1A11_079T01_9000005284_37197cztM0_level2.evt | modeM0/AS1A11_079T01_9000005284_37197cztM0_level2_quad_clean.evt |
| Size (bytes) | 448,433,280 | 65,761,920 |
| Size | 427.7 MB | 62.7 MB |
| Events in quadrant A | 3,233,370 | 396,829 |
| Events in quadrant B | 3,532,226 | 398,819 |
| Events in quadrant C | 3,180,296 | 398,581 |
| Events in quadrant D | 3,224,434 | 374,739 |
| Mode M9 | |||
|---|---|---|---|
| Quadrant | BADHDUFLAG | Total packets | Discarded packets |
| A | 0 | 31 | 0 |
| B | 0 | 31 | 0 |
| C | 0 | 31 | 0 |
| D | 0 | 31 | 0 |
| Mode SS | |||
|---|---|---|---|
| Quadrant | BADHDUFLAG | Total packets | Discarded packets |
| A | 0 | 124 | 0 |
| B | 0 | 124 | 0 |
| C | 0 | 124 | 0 |
| D | 0 | 124 | 0 |
| Mode M0 | |||
|---|---|---|---|
| Quadrant | BADHDUFLAG | Total packets | Discarded packets |
| A | 0 | 13340 | 3 |
| B | 0 | 14419 | 2 |
| C | 0 | 12946 | 2 |
| D | 0 | 13724 | 2 |
| Quadrant | Total seconds | Saturated seconds | Saturation percentage |
|---|---|---|---|
| A | 6048 | 48 | 0.793651% |
| B | 6048 | 26 | 0.429894% |
| C | 6048 | 17 | 0.281085% |
| D | 6048 | 79 | 1.306217% |
Noise dominated data is calculated using 1-second bins in cleaned event files. If a bin has >2000 counts, and if more than 50% of those come from <1% of pixels, then it is considered to be noise-dominated and hence unusable.
| Quadrant | # 1 sec bins | Bins with >0 counts | Bins with >2000 counts | High rate bins dominated by noise | Noise dominated (total time) | Noise dominated (detector-on time) | Marked lightcurve |
|---|---|---|---|---|---|---|---|
| A | 9153 | 6050 | 31 | 31 | 0.34% | 0.51% | 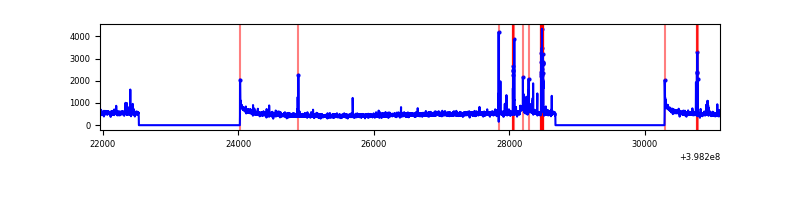 |
| B | 9153 | 6050 | 8 | 8 | 0.09% | 0.13% | 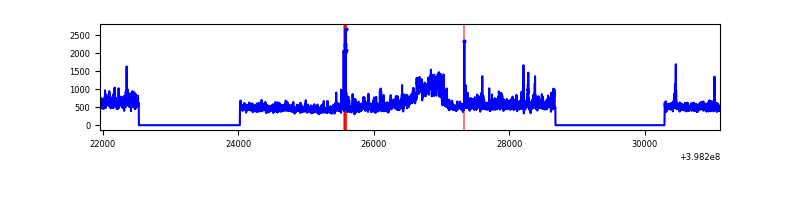 |
| C | 9153 | 6050 | 12 | 12 | 0.13% | 0.20% | 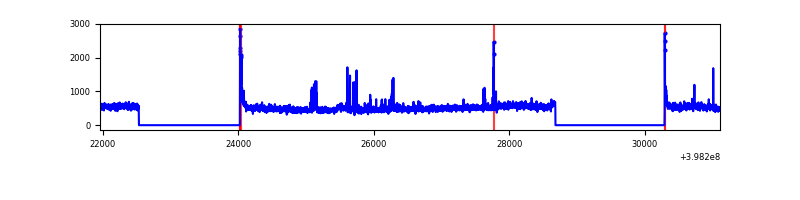 |
| D | 9153 | 6050 | 52 | 52 | 0.57% | 0.86% | 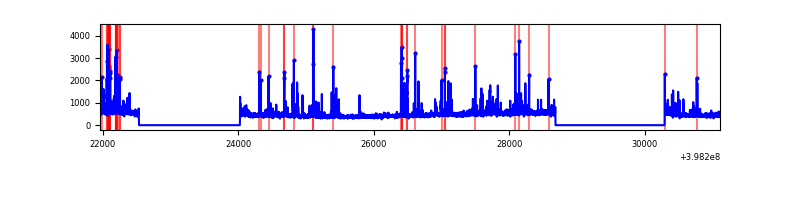 |
Top three noisy pixels from each quadrant. If the there are fewer than three noisy pixels in the level2.evt file, extra rows are filled as -1
| Pixel properties | Quadrant properties | ||||||
|---|---|---|---|---|---|---|---|
| Quadrant | DetID | PixID | Counts | Sigma | Mean | Median | Sigma |
| A | 10 | 83 | 283632 | 1970.87 | 707 | 692 | 143.6 |
| A | 15 | 237 | 134428 | 931.56 | 707 | 692 | 143.6 |
| A | 9 | 143 | 42728 | 292.81 | 707 | 692 | 143.6 |
| B | 5 | 184 | 365225 | 2698.94 | 702 | 683 | 135.1 |
| B | 0 | 213 | 211130 | 1558.08 | 702 | 683 | 135.1 |
| B | 0 | 155 | 71866 | 527.01 | 702 | 683 | 135.1 |
| C | 15 | 214 | 262583 | 1609.29 | 691 | 696 | 162.7 |
| C | 0 | 10 | 69117 | 420.44 | 691 | 696 | 162.7 |
| C | 0 | 207 | 69055 | 420.06 | 691 | 696 | 162.7 |
| D | 2 | 249 | 288128 | 1710.16 | 687 | 667 | 168.1 |
| D | 13 | 249 | 81153 | 478.83 | 687 | 667 | 168.1 |
| D | 2 | 153 | 53826 | 316.25 | 687 | 667 | 168.1 |
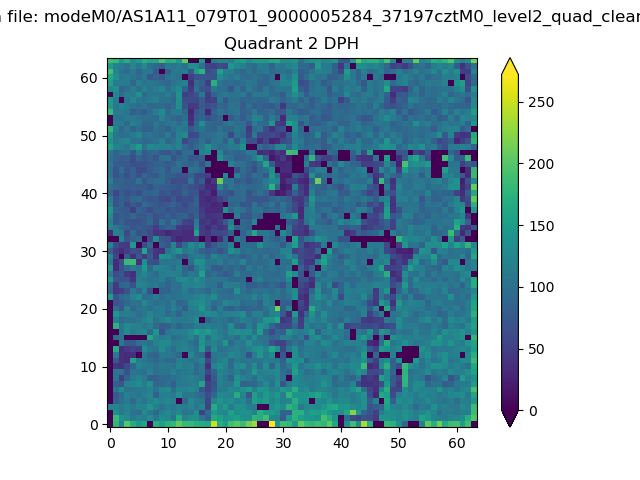
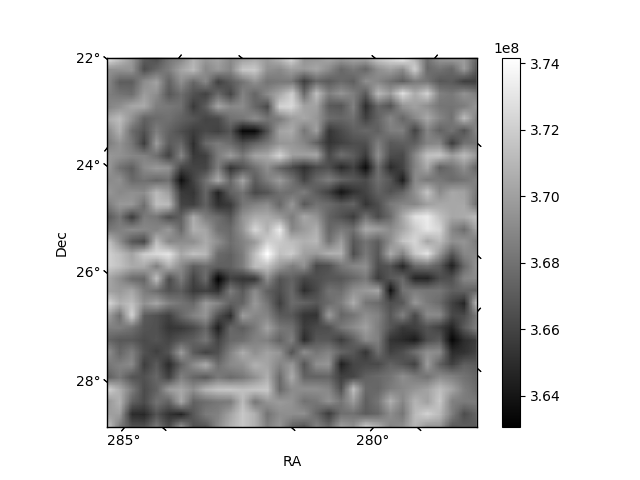
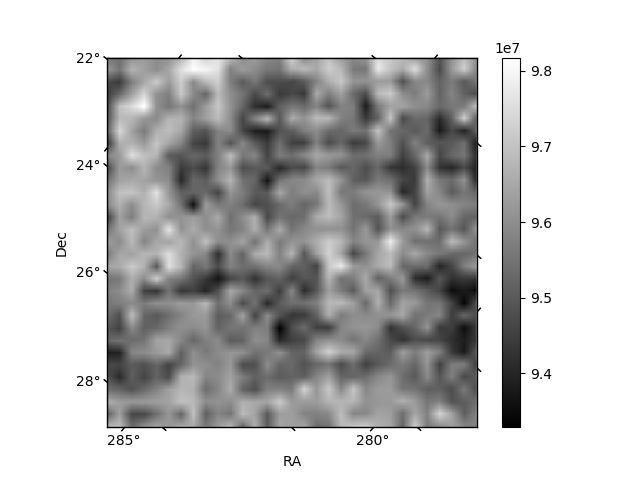
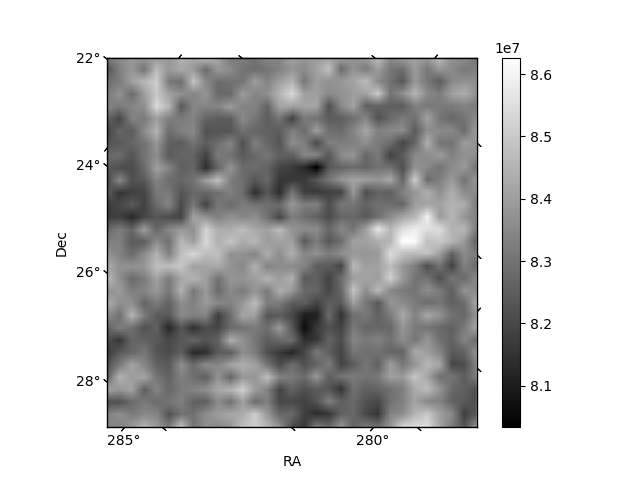
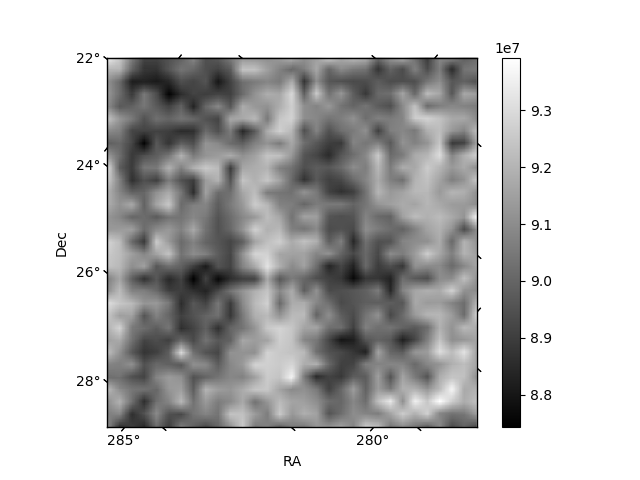
Histogram calculated using DETX and DETY for each event in the final _common_clean file
| Quadrant A | 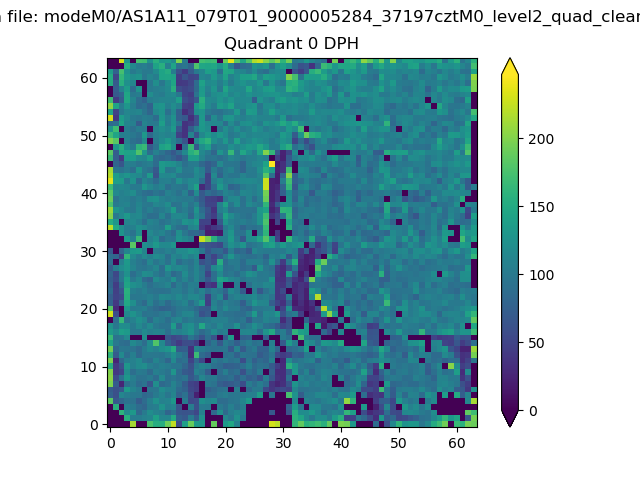 |
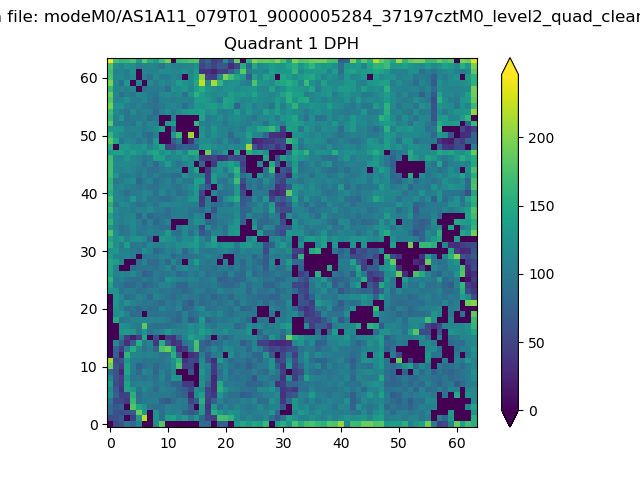 |
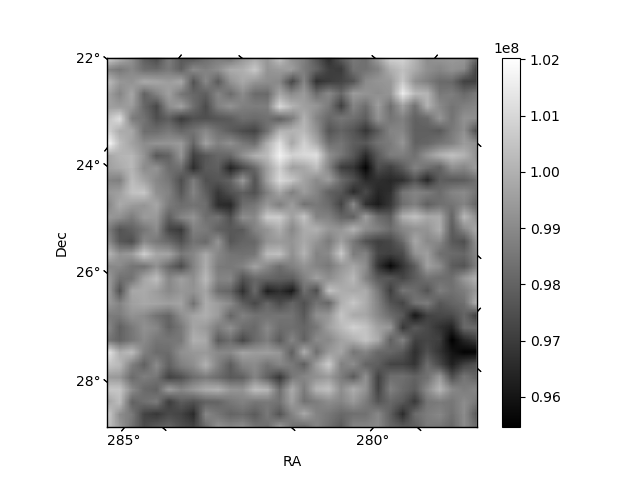
Quadrant B |
|---|---|---|---|
| Quadrant D | 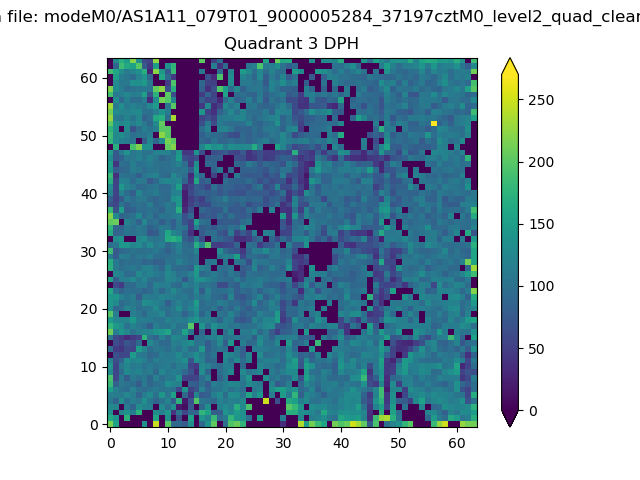 |
 |
Quadrant C |
| Plot type | Count rate plots | Images |
|---|---|---|
| Comparison with Poisson distribution Blue bars denote a histogram of data divided into 1 sec bins. Red curve is a Poisson curve with rate = median count rate of data. |
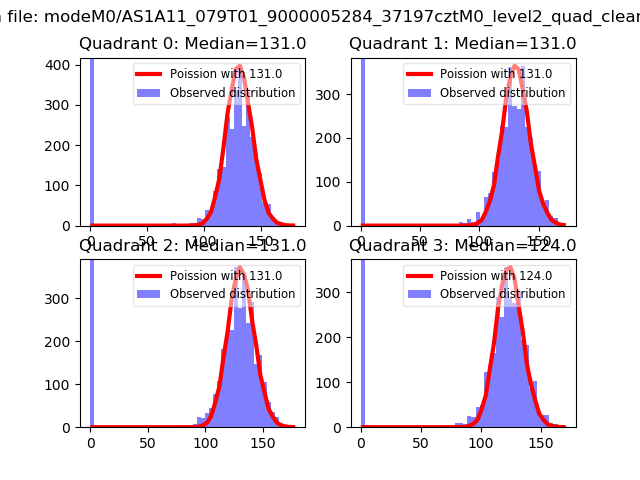 |
 |
| Quadrant-wise count rates Data is divided into 100 sec bins |
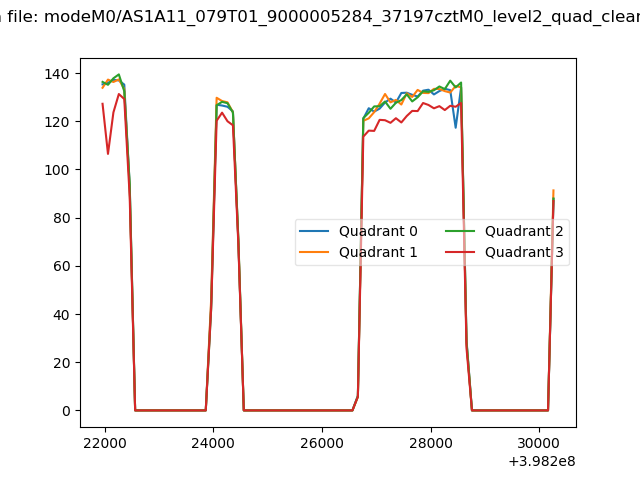 |
|
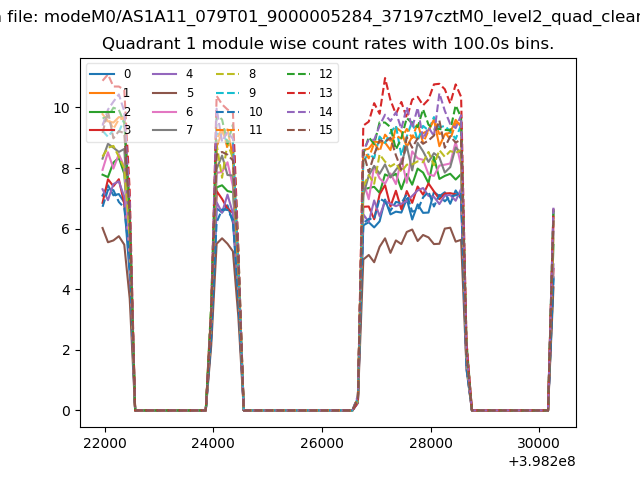
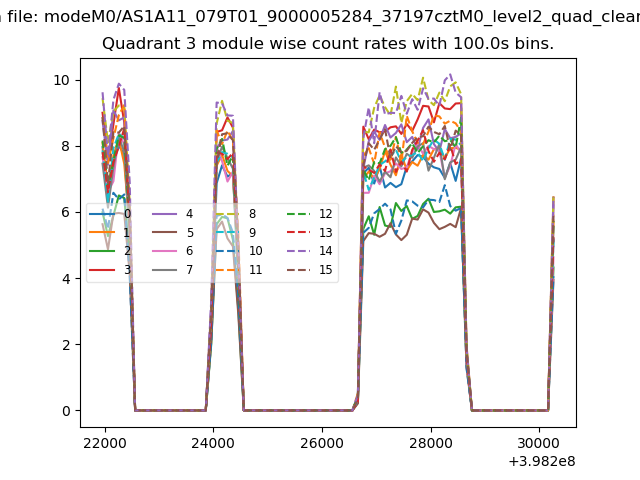
| Module-wise count rates for Quadrant A Data is divided into 100 sec bins |
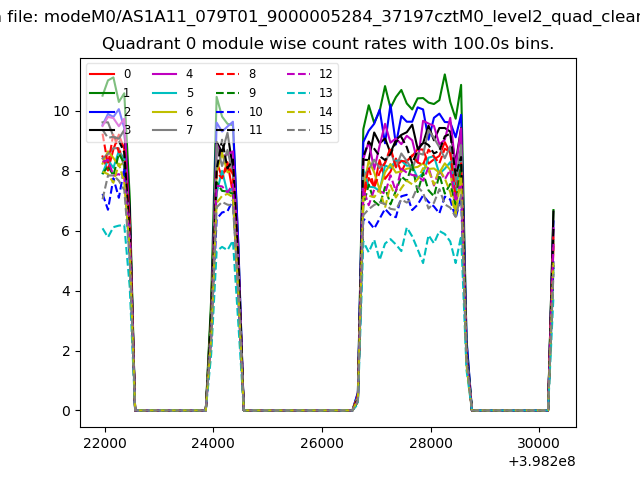 |
 |
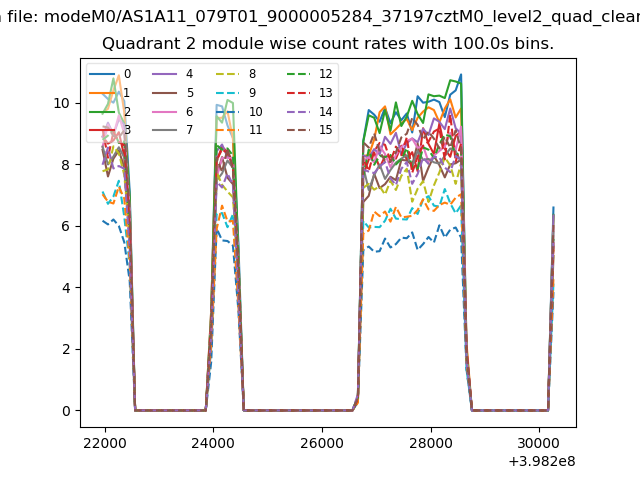
| Module-wise count rates for Quadrant B Data is divided into 100 sec bins |
 |
 |
| Module-wise count rates for Quadrant C Data is divided into 100 sec bins |
 |
 |
| Module-wise count rates for Quadrant D Data is divided into 100 sec bins |
 |
 |
| Parameter | Plot |
|---|---|
| CZT HV Monitor | 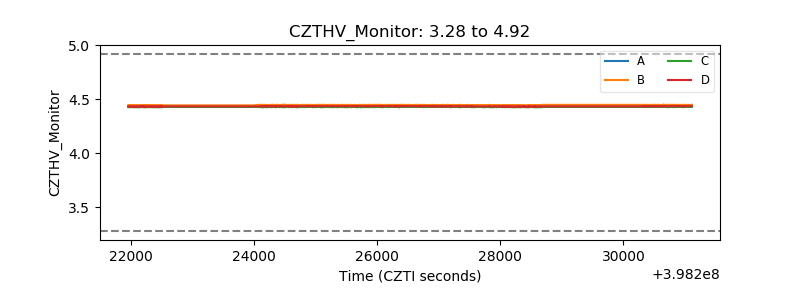 |
| D_VDD | 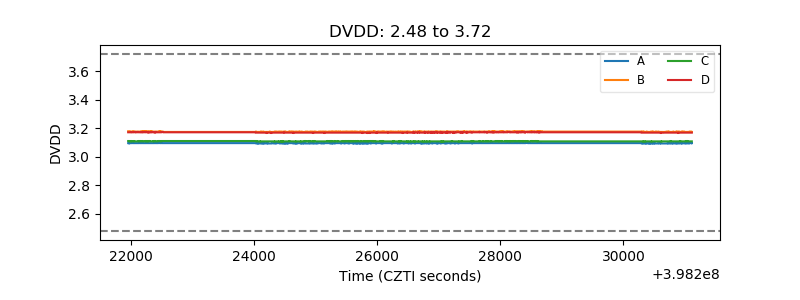 |
| Temperature 1 | 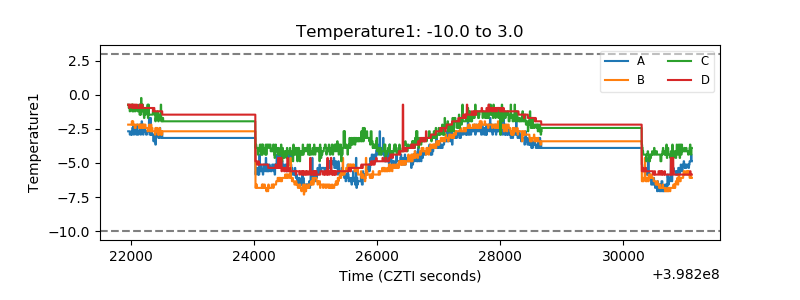 |
| Veto HV Monitor | 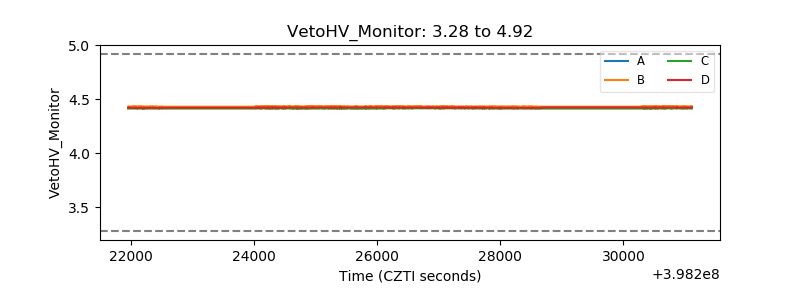 |
| Veto LLD | 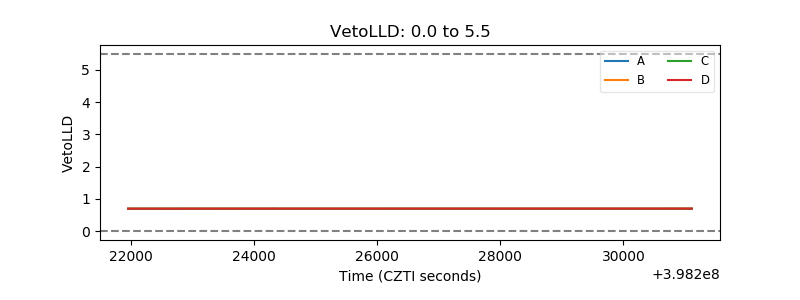 |
| Alpha Counter | 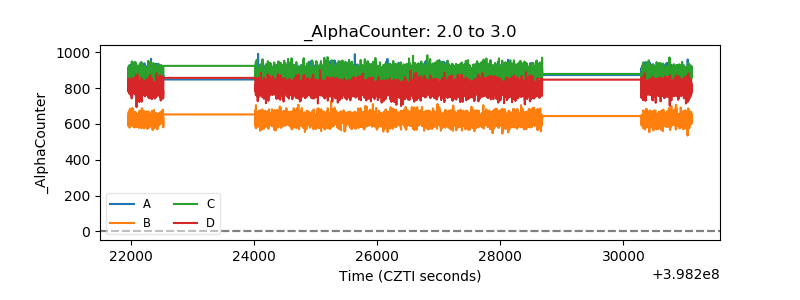 |
| _CPM_Rate | 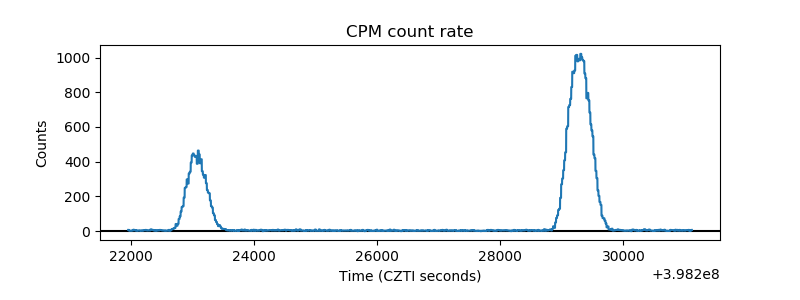 |
| CZT Counter | 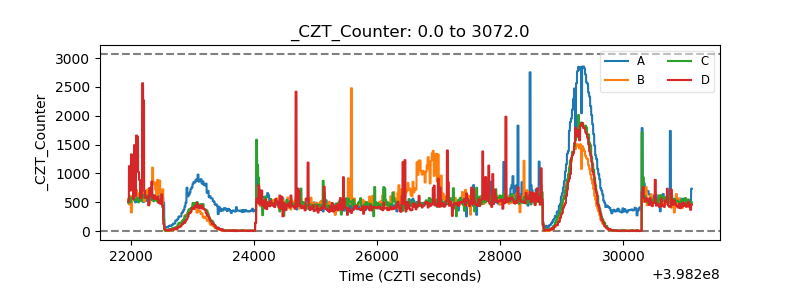 |
| +2.5 Volts monitor | 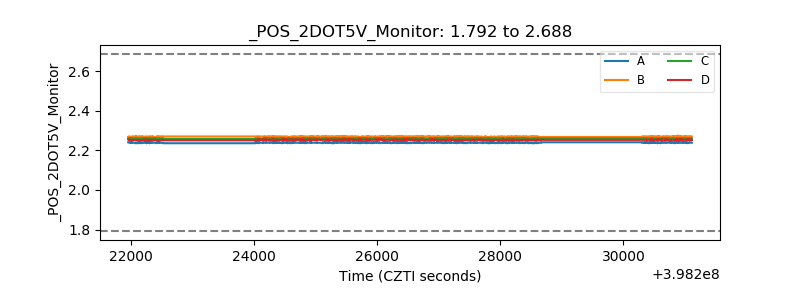 |
| +5 Volts monitor | 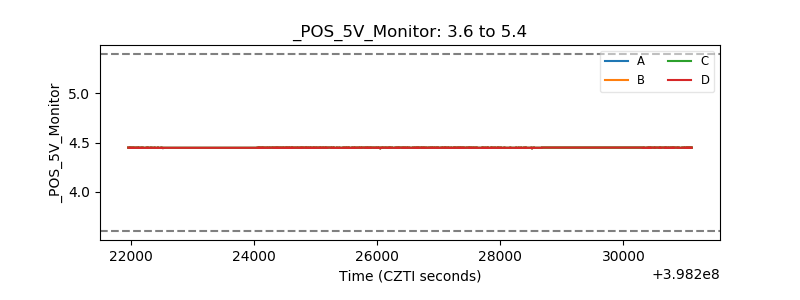 |
| _ROLL_ROT | 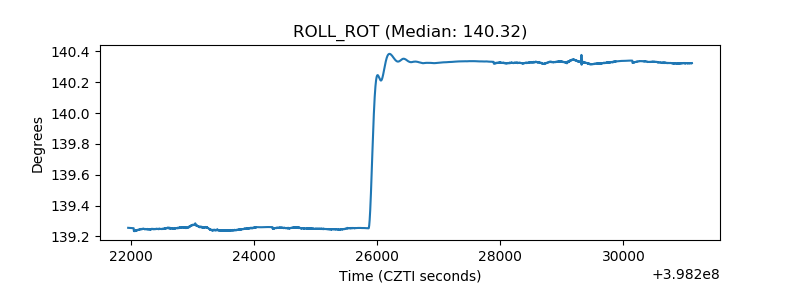 |
| _Roll_DEC | 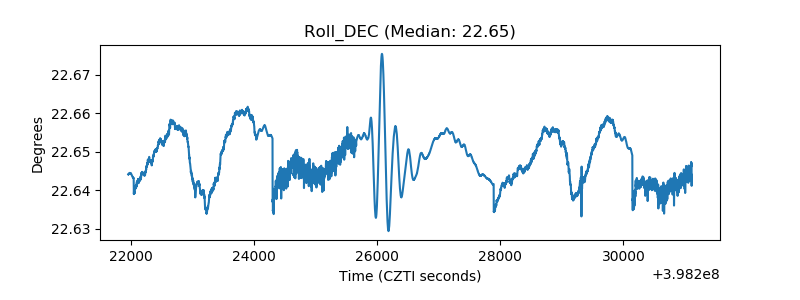 |
| _Roll_RA | 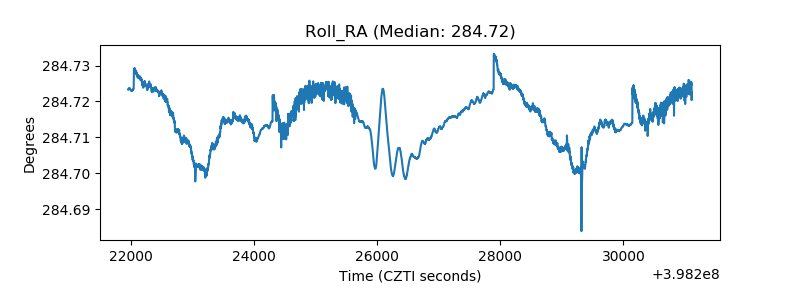 |
| Veto Counter | 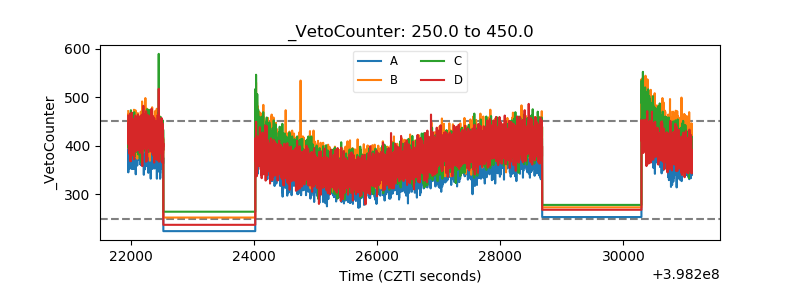 |