| Param | Original file | Final file |
|---|---|---|
| Filename | modeM0/AS1A11_079T01_9000005284_37200cztM0_level2.evt | modeM0/AS1A11_079T01_9000005284_37200cztM0_level2_quad_clean.evt |
| Size (bytes) | 439,035,840 | 56,678,400 |
| Size | 418.7 MB | 54.1 MB |
| Events in quadrant A | 2,946,343 | 340,562 |
| Events in quadrant B | 2,979,931 | 341,256 |
| Events in quadrant C | 3,446,936 | 334,803 |
| Events in quadrant D | 3,552,456 | 317,206 |
| Mode M9 | |||
|---|---|---|---|
| Quadrant | BADHDUFLAG | Total packets | Discarded packets |
| A | 0 | 28 | 0 |
| B | 0 | 28 | 0 |
| C | 0 | 28 | 0 |
| D | 0 | 29 | 0 |
| Mode SS | |||
|---|---|---|---|
| Quadrant | BADHDUFLAG | Total packets | Discarded packets |
| A | 0 | 110 | 0 |
| B | 0 | 110 | 0 |
| C | 0 | 110 | 0 |
| D | 0 | 110 | 0 |
| Mode M0 | |||
|---|---|---|---|
| Quadrant | BADHDUFLAG | Total packets | Discarded packets |
| A | 0 | 11878 | 3 |
| B | 0 | 12009 | 2 |
| C | 0 | 13466 | 2 |
| D | 0 | 14168 | 2 |
| Quadrant | Total seconds | Saturated seconds | Saturation percentage |
|---|---|---|---|
| A | 5461 | 10 | 0.183117% |
| B | 5461 | 46 | 0.842337% |
| C | 5461 | 63 | 1.153635% |
| D | 5461 | 72 | 1.318440% |
Noise dominated data is calculated using 1-second bins in cleaned event files. If a bin has >2000 counts, and if more than 50% of those come from <1% of pixels, then it is considered to be noise-dominated and hence unusable.
| Quadrant | # 1 sec bins | Bins with >0 counts | Bins with >2000 counts | High rate bins dominated by noise | Noise dominated (total time) | Noise dominated (detector-on time) | Marked lightcurve |
|---|---|---|---|---|---|---|---|
| A | 7344 | 5462 | 4 | 4 | 0.05% | 0.07% | 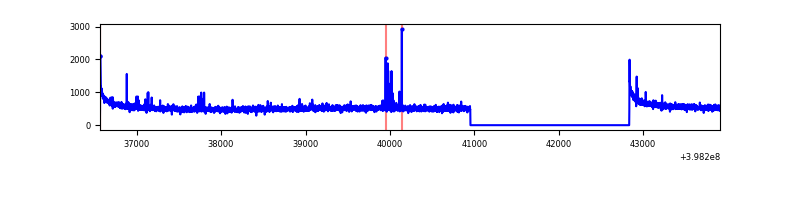 |
| B | 7344 | 5462 | 33 | 33 | 0.45% | 0.60% | 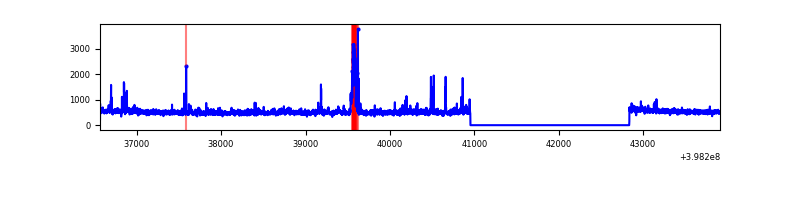 |
| C | 7344 | 5462 | 47 | 47 | 0.64% | 0.86% | 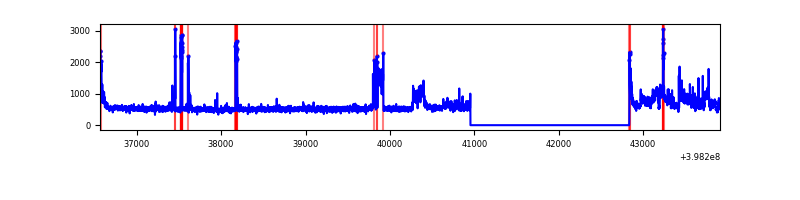 |
| D | 7344 | 5462 | 66 | 66 | 0.90% | 1.21% | 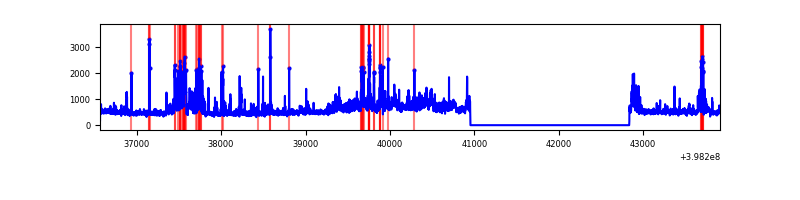 |
Top three noisy pixels from each quadrant. If the there are fewer than three noisy pixels in the level2.evt file, extra rows are filled as -1
| Pixel properties | Quadrant properties | ||||||
|---|---|---|---|---|---|---|---|
| Quadrant | DetID | PixID | Counts | Sigma | Mean | Median | Sigma |
| A | 10 | 83 | 258467 | 1876.03 | 683 | 671 | 137.4 |
| A | 9 | 143 | 15371 | 106.97 | 683 | 671 | 137.4 |
| A | 10 | 255 | 14905 | 103.58 | 683 | 671 | 137.4 |
| B | 5 | 184 | 128404 | 998.31 | 677 | 662 | 128.0 |
| B | 0 | 213 | 81349 | 630.57 | 677 | 662 | 128.0 |
| B | 5 | 172 | 58793 | 454.3 | 677 | 662 | 128.0 |
| C | 10 | 49 | 531188 | 3531.11 | 653 | 660 | 150.2 |
| C | 15 | 214 | 235968 | 1566.17 | 653 | 660 | 150.2 |
| C | 0 | 10 | 61814 | 407.03 | 653 | 660 | 150.2 |
| D | 13 | 171 | 265870 | 1671.15 | 653 | 635 | 158.7 |
| D | 1 | 52 | 255936 | 1608.56 | 653 | 635 | 158.7 |
| D | 2 | 250 | 141377 | 886.76 | 653 | 635 | 158.7 |
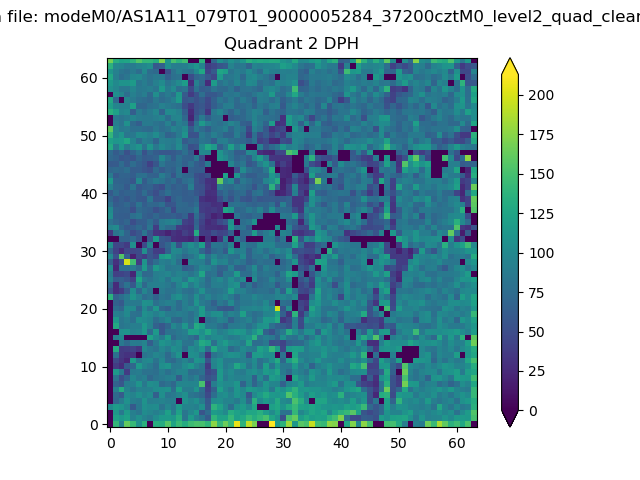
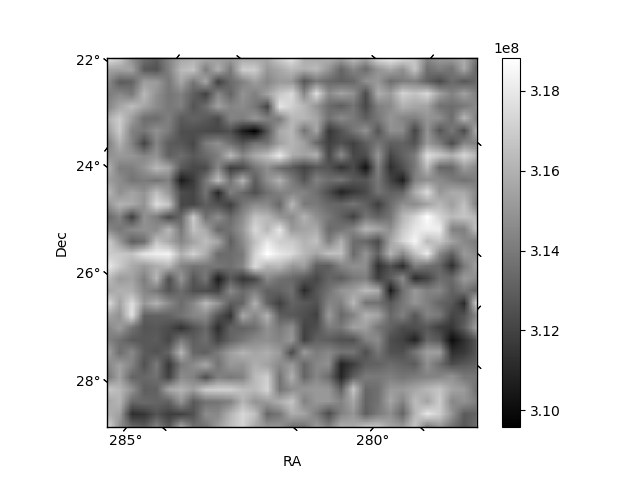
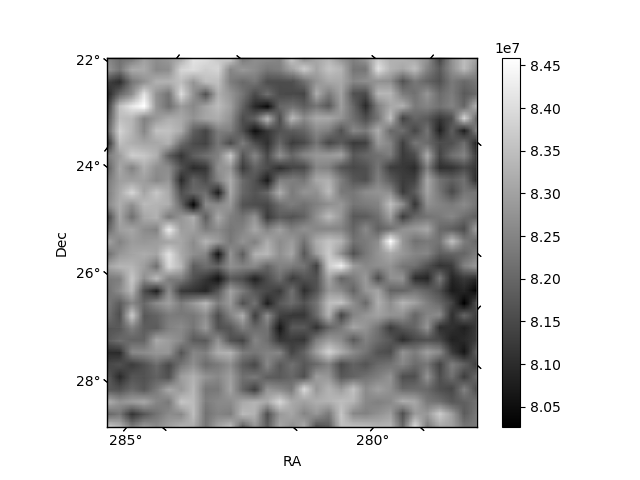
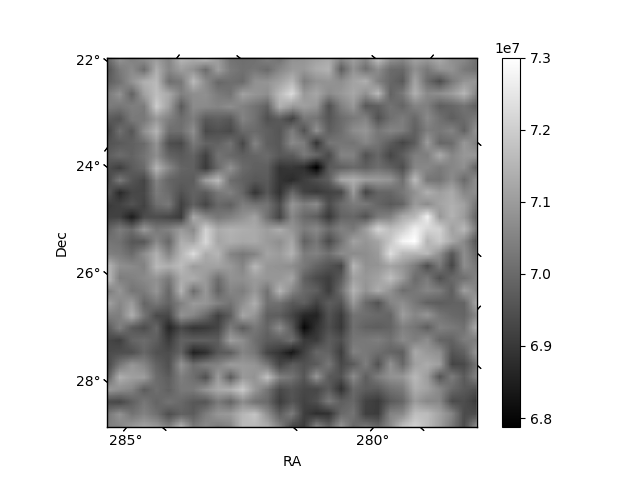
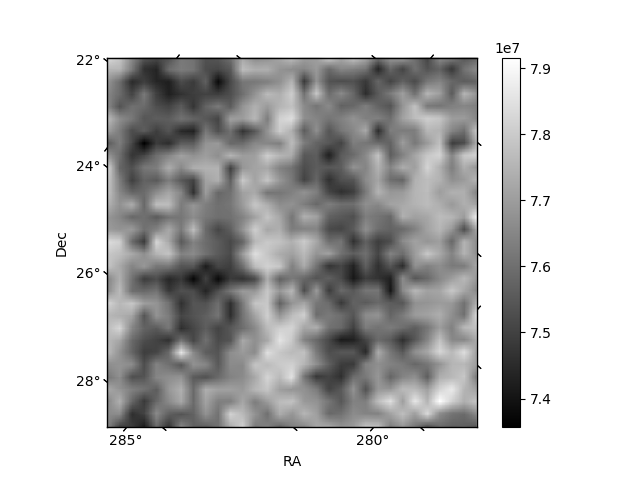
Histogram calculated using DETX and DETY for each event in the final _common_clean file
| Quadrant A | 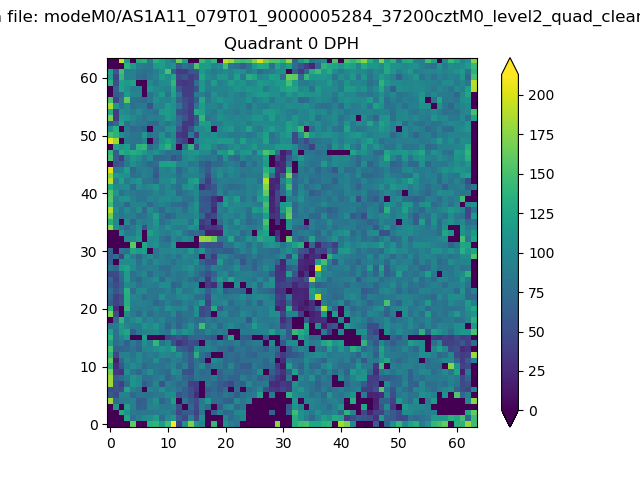 |
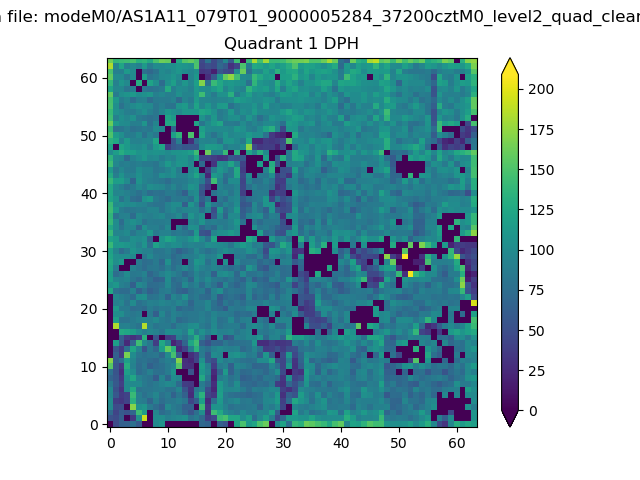 |
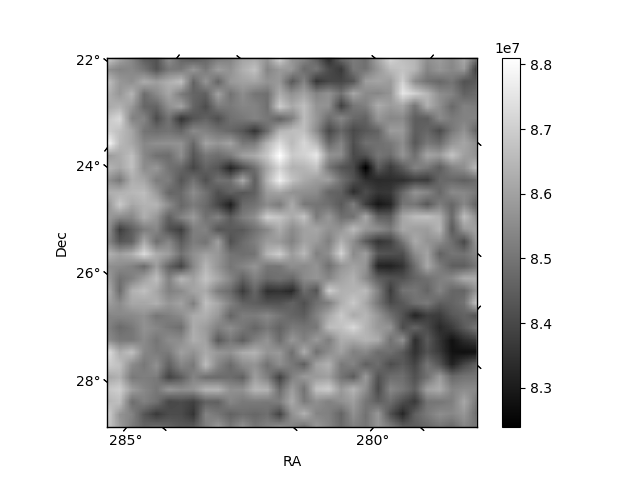
Quadrant B |
|---|---|---|---|
| Quadrant D | 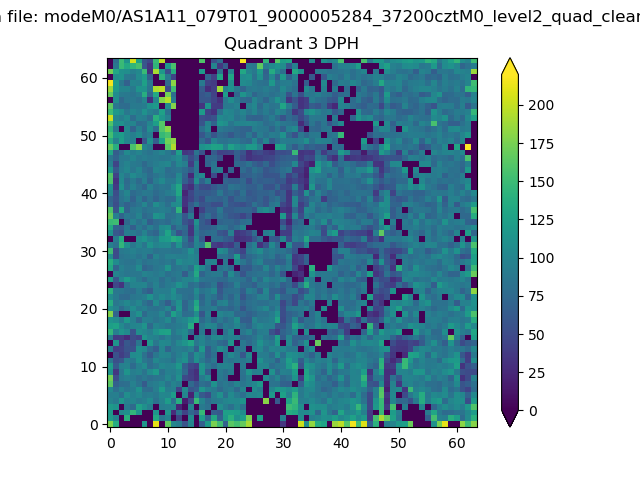 |
 |
Quadrant C |
| Plot type | Count rate plots | Images |
|---|---|---|
| Comparison with Poisson distribution Blue bars denote a histogram of data divided into 1 sec bins. Red curve is a Poisson curve with rate = median count rate of data. |
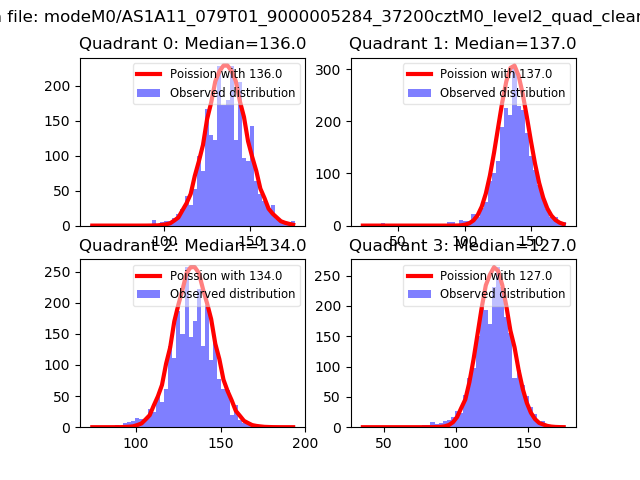 |
 |
| Quadrant-wise count rates Data is divided into 100 sec bins |
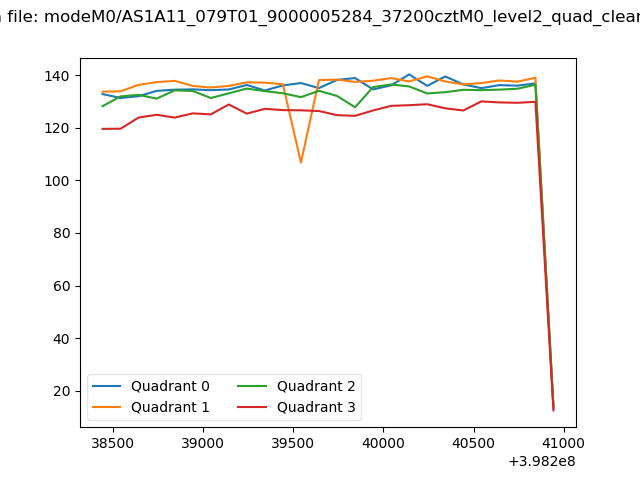 |
|
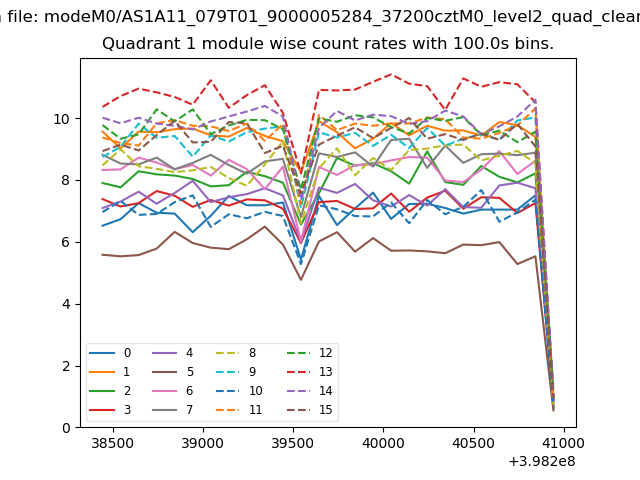
| Module-wise count rates for Quadrant A Data is divided into 100 sec bins |
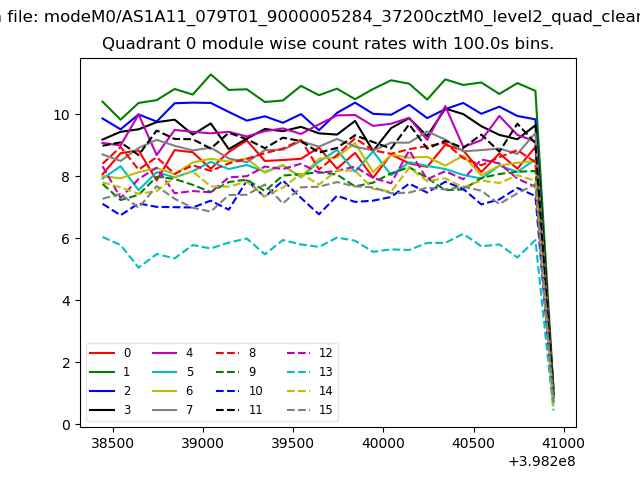 |
 |
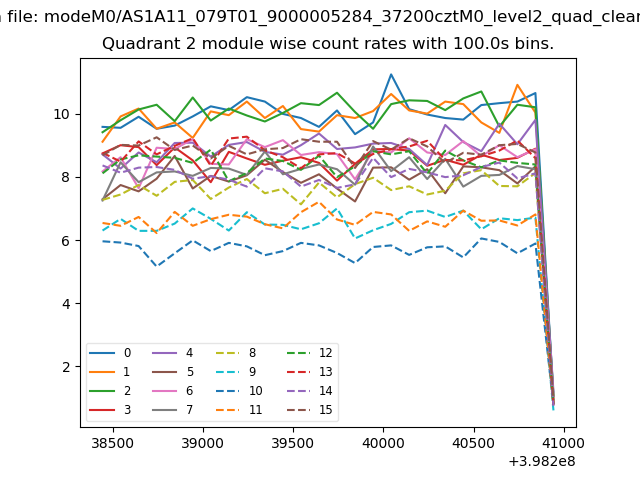
| Module-wise count rates for Quadrant B Data is divided into 100 sec bins |
 |
 |
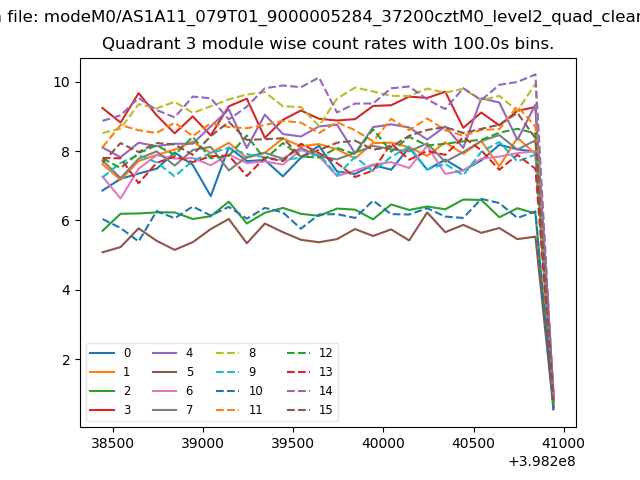
| Module-wise count rates for Quadrant C Data is divided into 100 sec bins |
 |
 |
| Module-wise count rates for Quadrant D Data is divided into 100 sec bins |
 |
 |
| Parameter | Plot |
|---|---|
| CZT HV Monitor | 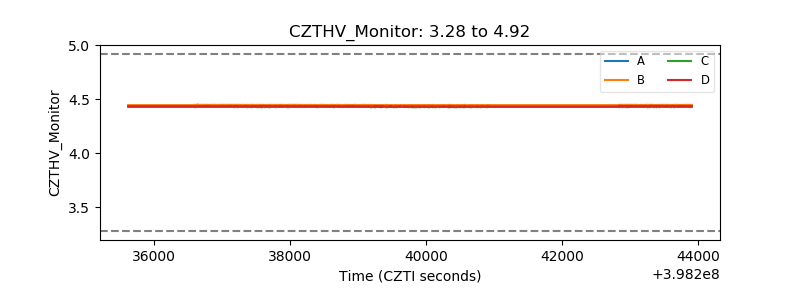 |
| D_VDD | 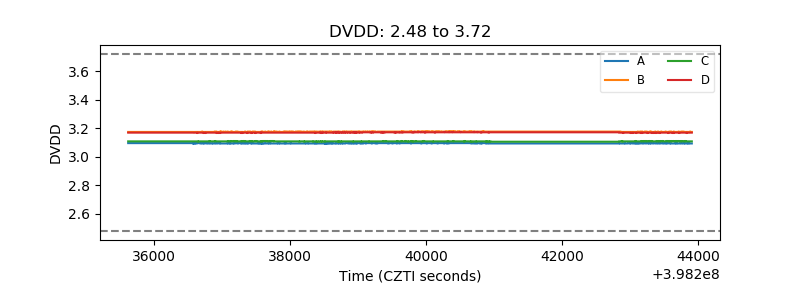 |
| Temperature 1 | 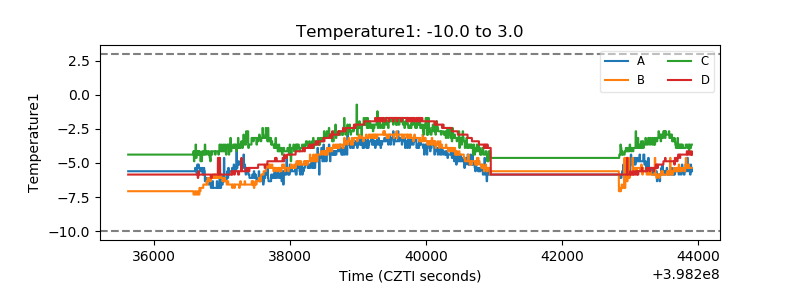 |
| Veto HV Monitor | 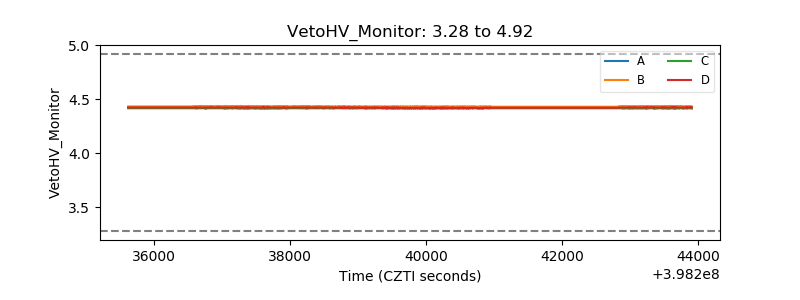 |
| Veto LLD | 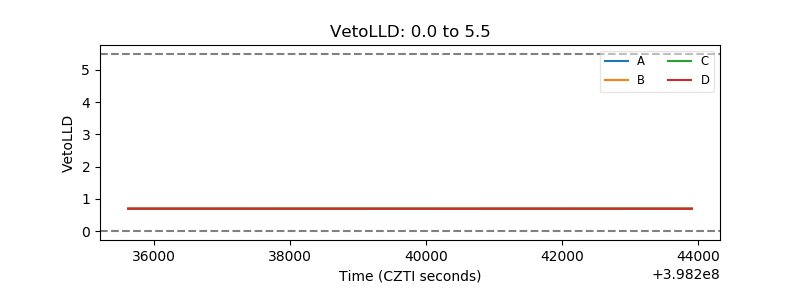 |
| Alpha Counter | 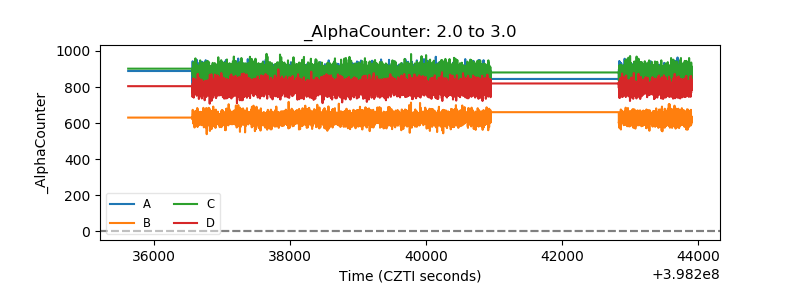 |
| _CPM_Rate | 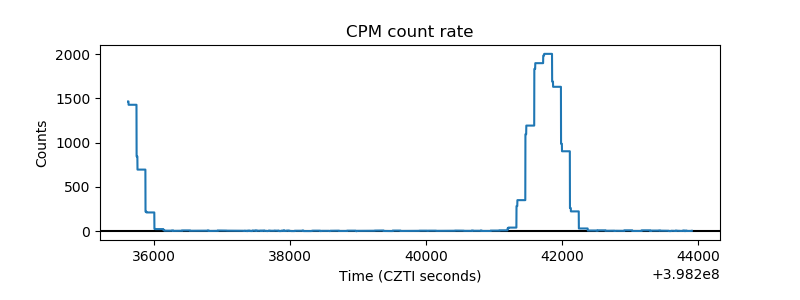 |
| CZT Counter | 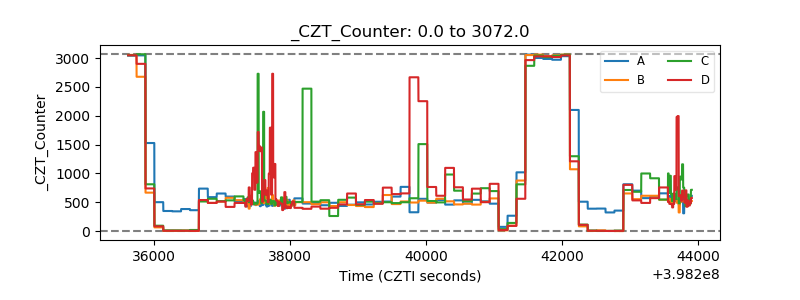 |
| +2.5 Volts monitor | 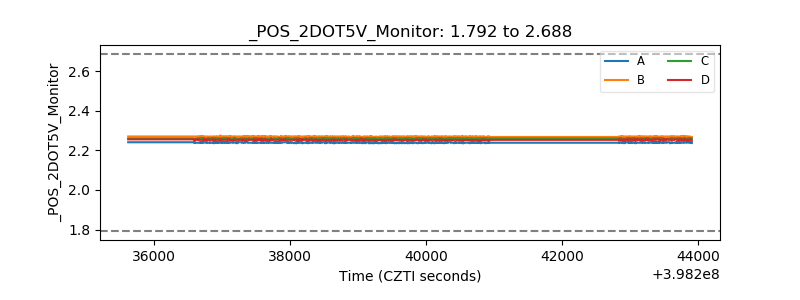 |
| +5 Volts monitor | 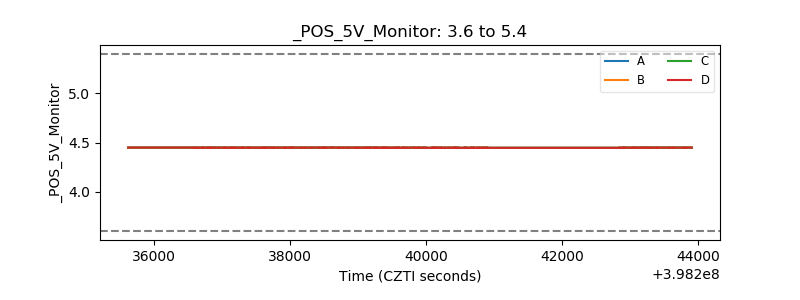 |
| _ROLL_ROT | 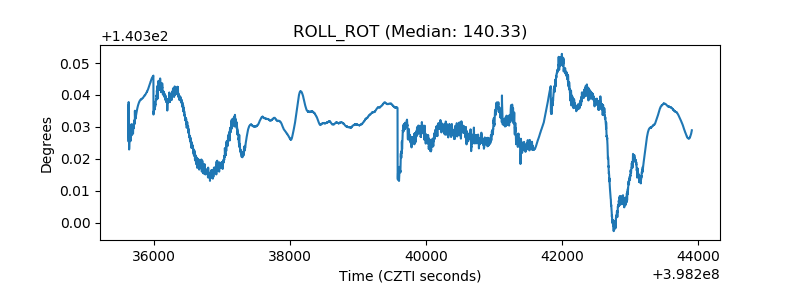 |
| _Roll_DEC | 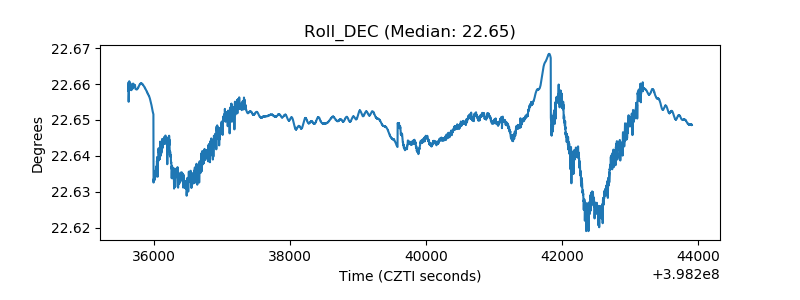 |
| _Roll_RA | 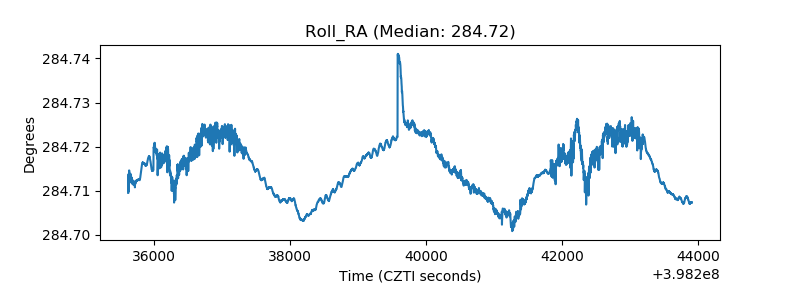 |
| Veto Counter | 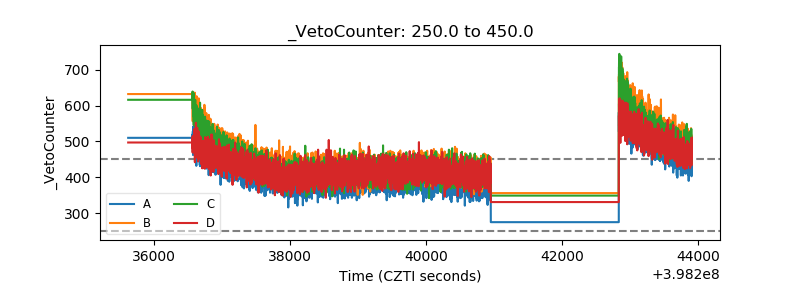 |