| Param | Original file | Final file |
|---|---|---|
| Filename | modeM0/AS1A11_079T01_9000005284_37201cztM0_level2.evt | modeM0/AS1A11_079T01_9000005284_37201cztM0_level2_quad_clean.evt |
| Size (bytes) | 461,496,960 | 63,247,680 |
| Size | 440.1 MB | 60.3 MB |
| Events in quadrant A | 2,874,612 | 401,544 |
| Events in quadrant B | 2,933,476 | 401,773 |
| Events in quadrant C | 3,782,416 | 387,001 |
| Events in quadrant D | 4,037,242 | 363,966 |
| Mode M9 | |||
|---|---|---|---|
| Quadrant | BADHDUFLAG | Total packets | Discarded packets |
| A | 0 | 28 | 0 |
| B | 0 | 28 | 0 |
| C | 0 | 28 | 0 |
| D | 0 | 29 | 0 |
| Mode SS | |||
|---|---|---|---|
| Quadrant | BADHDUFLAG | Total packets | Discarded packets |
| A | 0 | 104 | 0 |
| B | 0 | 104 | 0 |
| C | 0 | 104 | 0 |
| D | 0 | 104 | 0 |
| Mode M0 | |||
|---|---|---|---|
| Quadrant | BADHDUFLAG | Total packets | Discarded packets |
| A | 0 | 11482 | 3 |
| B | 0 | 11687 | 2 |
| C | 0 | 14688 | 2 |
| D | 0 | 15387 | 2 |
| Quadrant | Total seconds | Saturated seconds | Saturation percentage |
|---|---|---|---|
| A | 5149 | 12 | 0.233055% |
| B | 5149 | 45 | 0.873956% |
| C | 5149 | 37 | 0.718586% |
| D | 5149 | 111 | 2.155758% |
Noise dominated data is calculated using 1-second bins in cleaned event files. If a bin has >2000 counts, and if more than 50% of those come from <1% of pixels, then it is considered to be noise-dominated and hence unusable.
| Quadrant | # 1 sec bins | Bins with >0 counts | Bins with >2000 counts | High rate bins dominated by noise | Noise dominated (total time) | Noise dominated (detector-on time) | Marked lightcurve |
|---|---|---|---|---|---|---|---|
| A | 7151 | 5150 | 0 | 0 | 0.00% | 0.00% | 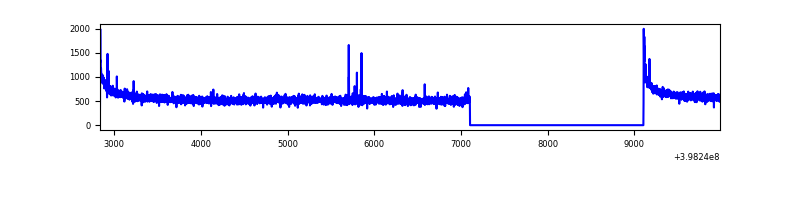 |
| B | 7151 | 5150 | 21 | 21 | 0.29% | 0.41% | 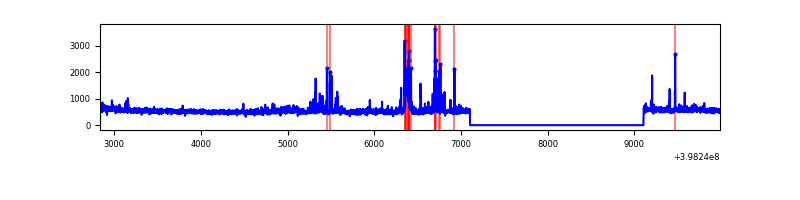 |
| C | 7151 | 5150 | 23 | 23 | 0.32% | 0.45% | 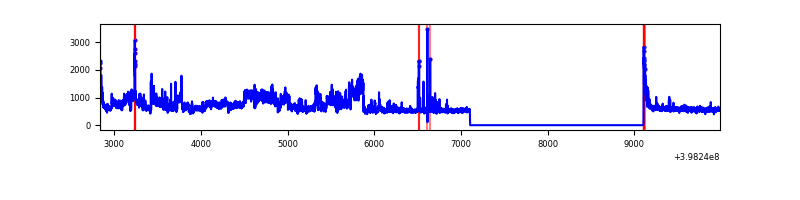 |
| D | 7151 | 5150 | 97 | 97 | 1.36% | 1.88% | 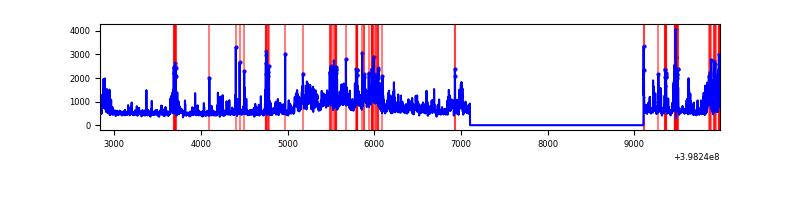 |
Top three noisy pixels from each quadrant. If the there are fewer than three noisy pixels in the level2.evt file, extra rows are filled as -1
| Pixel properties | Quadrant properties | ||||||
|---|---|---|---|---|---|---|---|
| Quadrant | DetID | PixID | Counts | Sigma | Mean | Median | Sigma |
| A | 10 | 83 | 251869 | 1874.84 | 673 | 663 | 134.0 |
| A | 9 | 143 | 7455 | 50.69 | 673 | 663 | 134.0 |
| A | 13 | 254 | 7139 | 48.33 | 673 | 663 | 134.0 |
| B | 5 | 172 | 214262 | 1698.45 | 665 | 649 | 125.8 |
| B | 0 | 213 | 57048 | 448.43 | 665 | 649 | 125.8 |
| B | 0 | 155 | 34078 | 265.8 | 665 | 649 | 125.8 |
| C | 10 | 49 | 875865 | 5917.22 | 640 | 646 | 147.9 |
| C | 15 | 214 | 224764 | 1515.23 | 640 | 646 | 147.9 |
| C | 0 | 10 | 79434 | 532.67 | 640 | 646 | 147.9 |
| D | 1 | 52 | 495976 | 3227.03 | 640 | 624 | 153.5 |
| D | 12 | 235 | 400286 | 2603.65 | 640 | 624 | 153.5 |
| D | 2 | 249 | 193150 | 1254.23 | 640 | 624 | 153.5 |
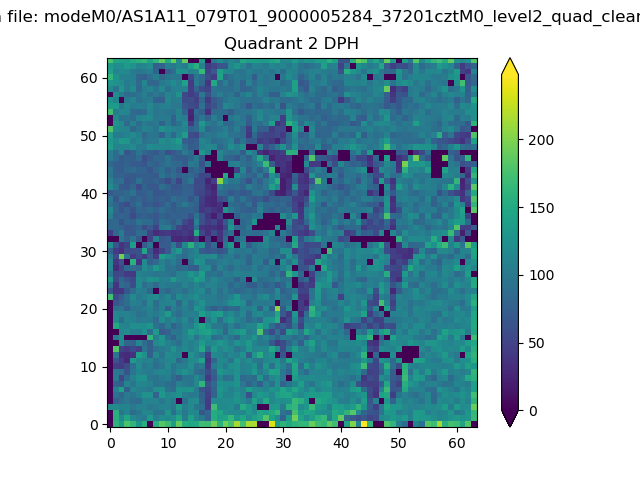
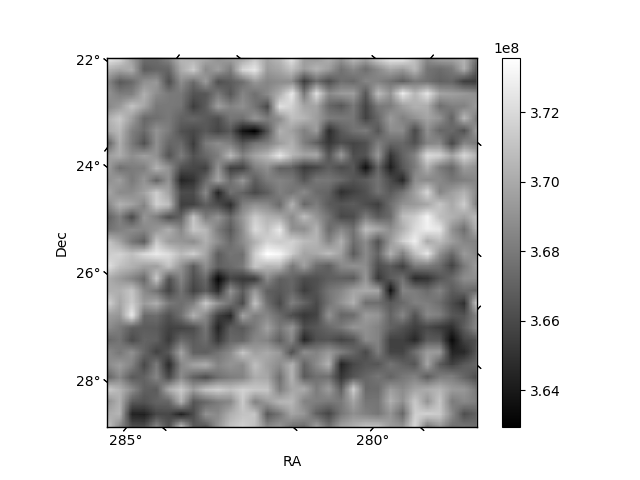
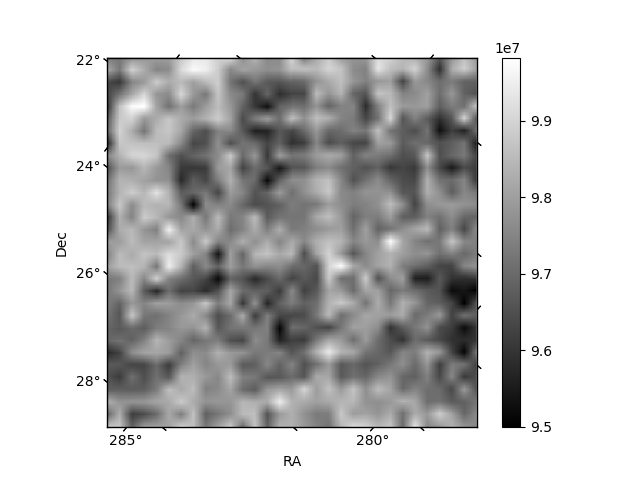
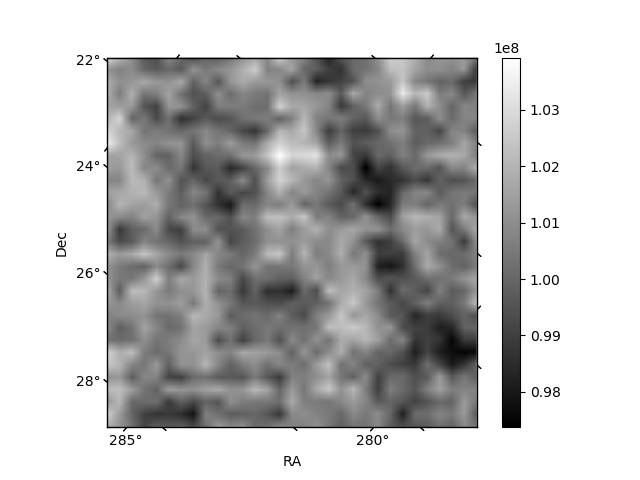
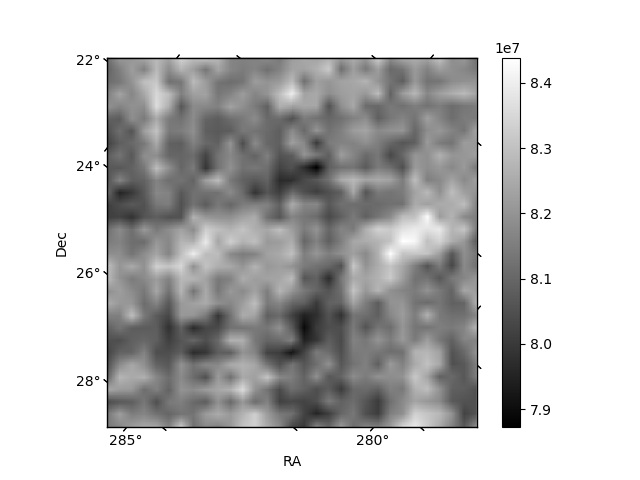
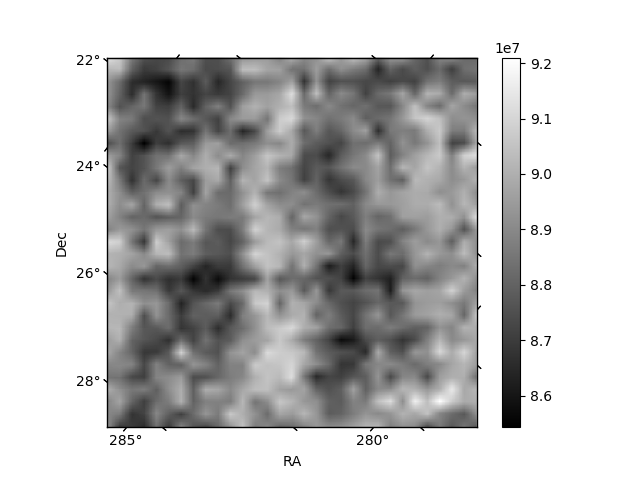
Histogram calculated using DETX and DETY for each event in the final _common_clean file
| Quadrant A | 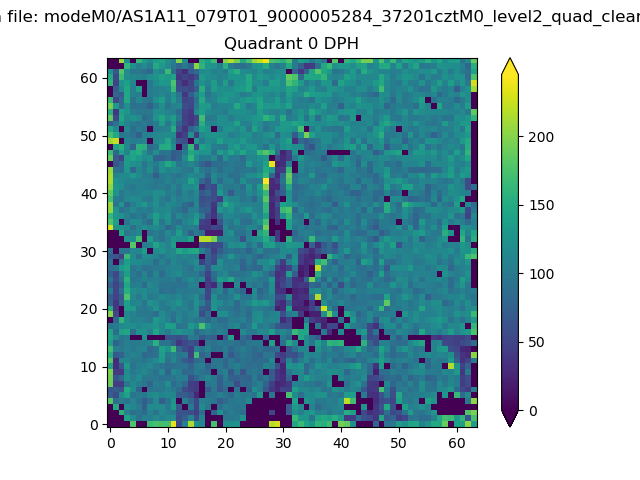 |
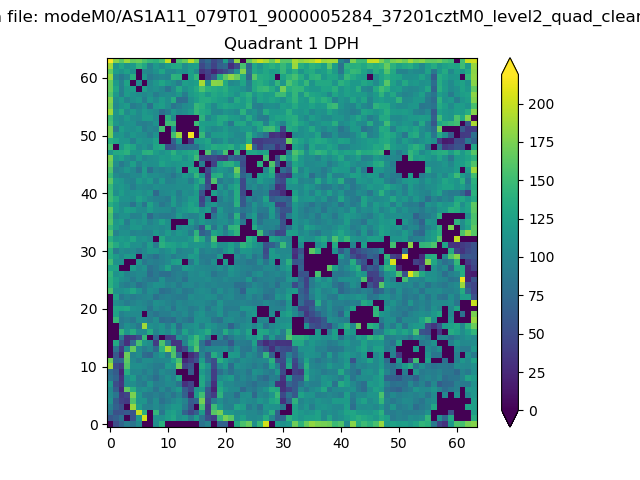 |
Quadrant B |
|---|---|---|---|
| Quadrant D | 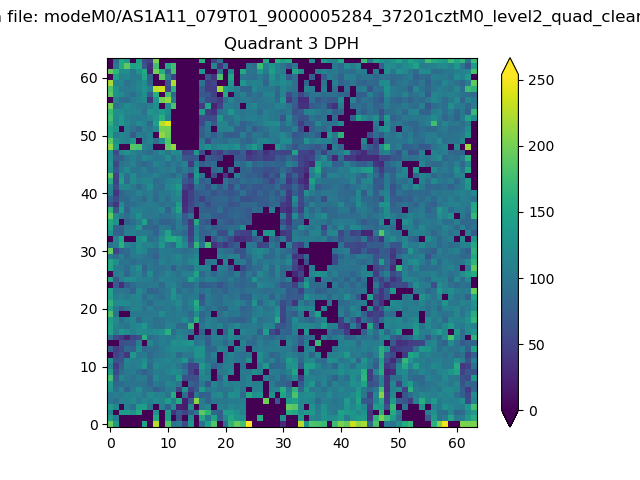 |
 |
Quadrant C |
| Plot type | Count rate plots | Images |
|---|---|---|
| Comparison with Poisson distribution Blue bars denote a histogram of data divided into 1 sec bins. Red curve is a Poisson curve with rate = median count rate of data. |
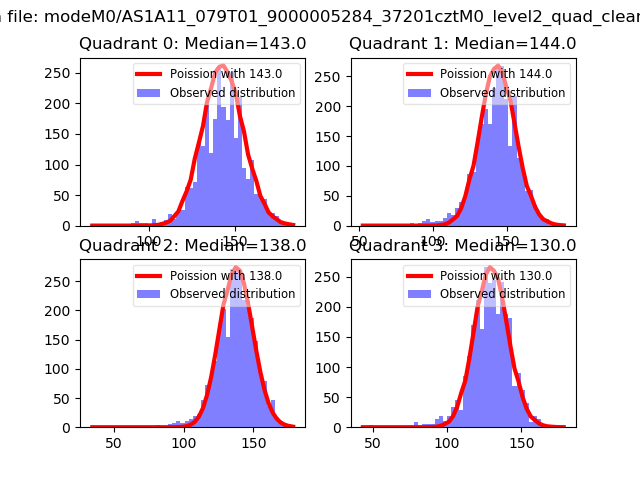 |
 |
| Quadrant-wise count rates Data is divided into 100 sec bins |
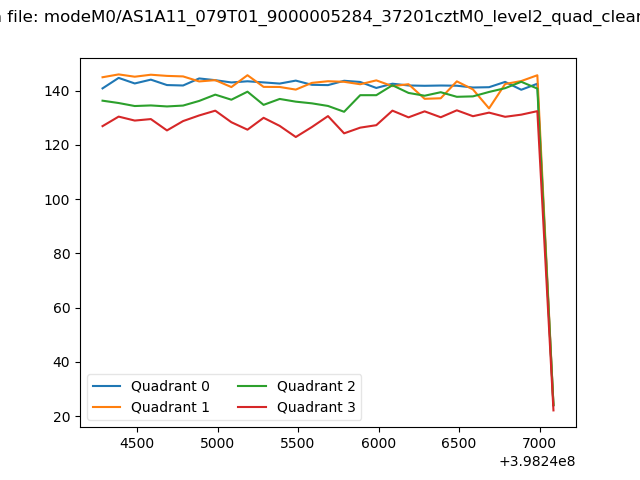 |
|
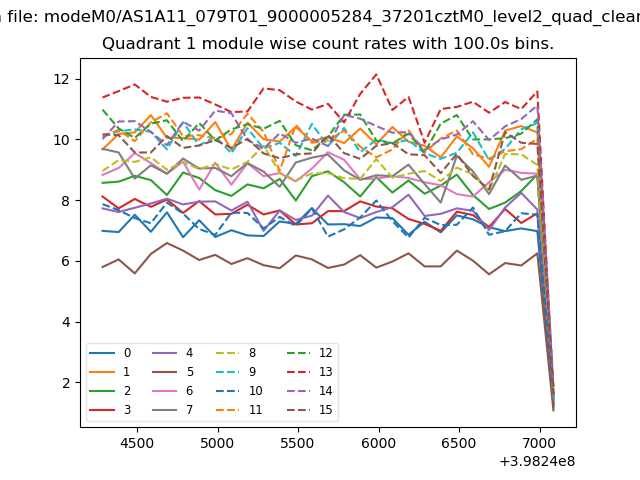
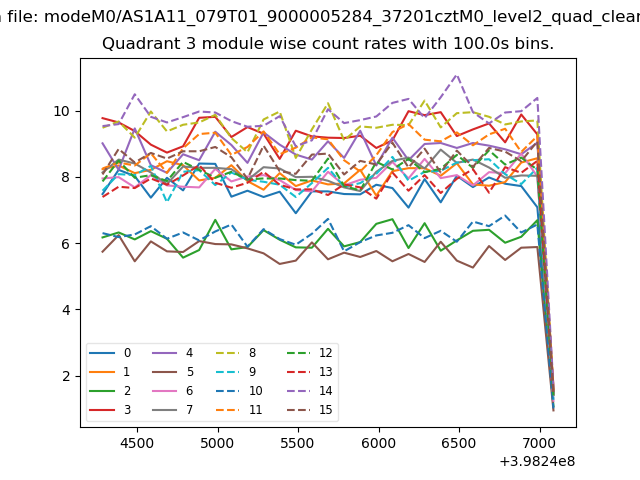
| Module-wise count rates for Quadrant A Data is divided into 100 sec bins |
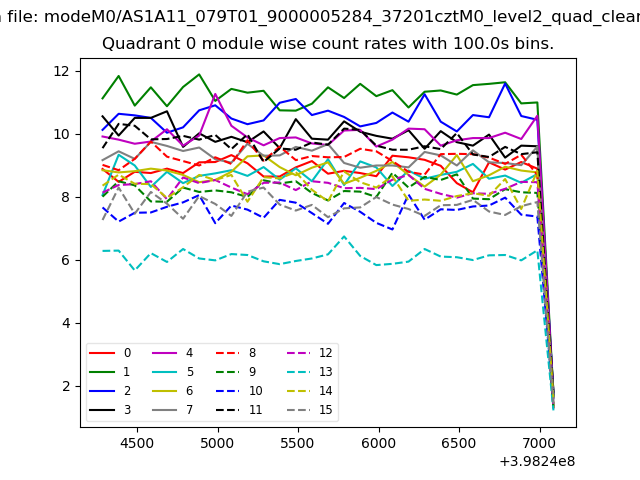 |
 |
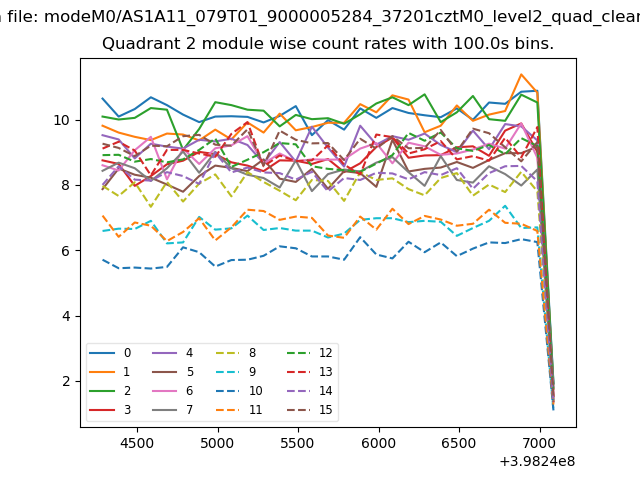
| Module-wise count rates for Quadrant B Data is divided into 100 sec bins |
 |
 |
| Module-wise count rates for Quadrant C Data is divided into 100 sec bins |
 |
 |
| Module-wise count rates for Quadrant D Data is divided into 100 sec bins |
 |
 |
| Parameter | Plot |
|---|---|
| CZT HV Monitor | 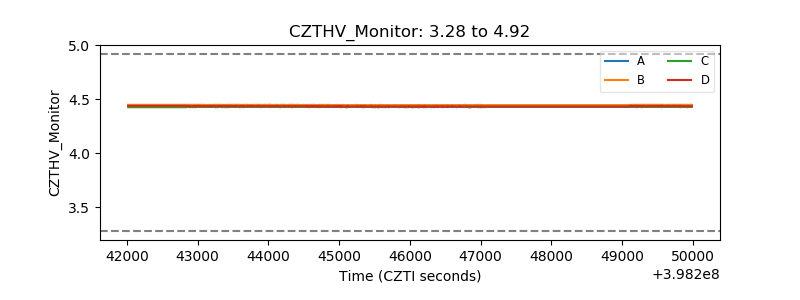 |
| D_VDD | 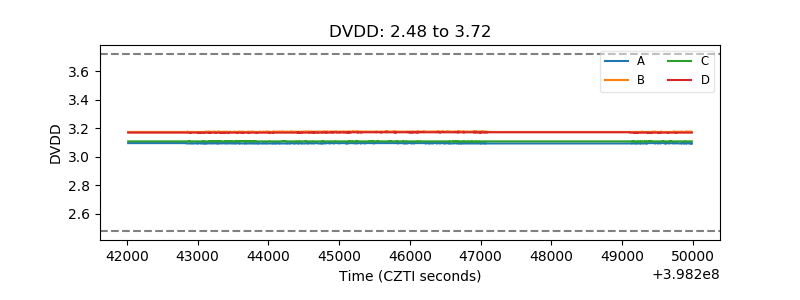 |
| Temperature 1 | 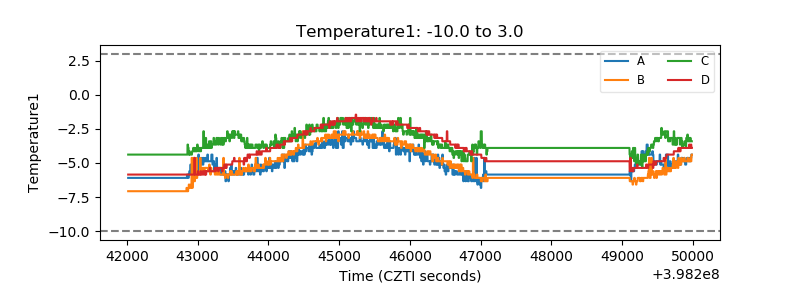 |
| Veto HV Monitor | 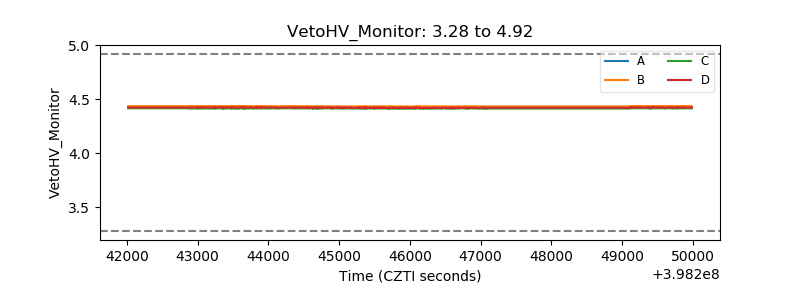 |
| Veto LLD | 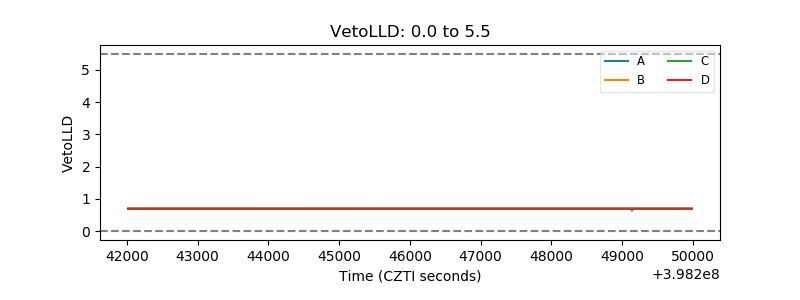 |
| Alpha Counter | 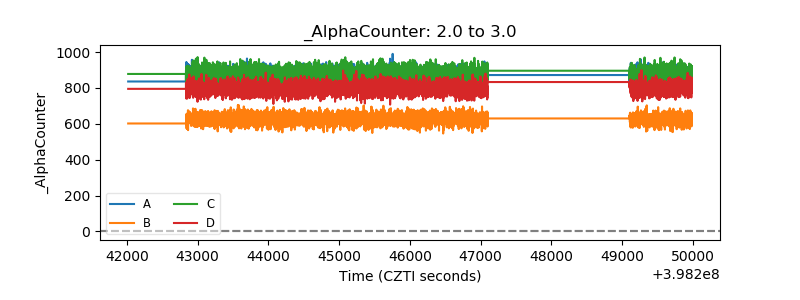 |
| _CPM_Rate | 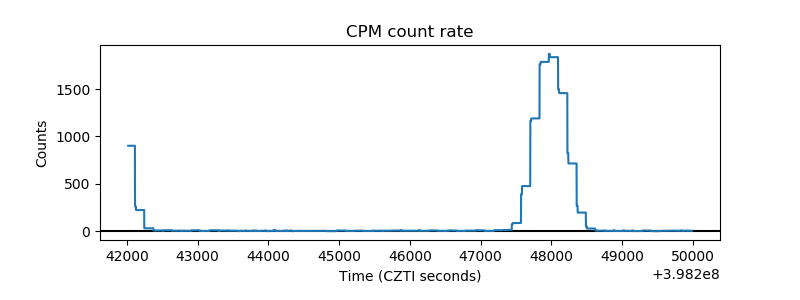 |
| CZT Counter | 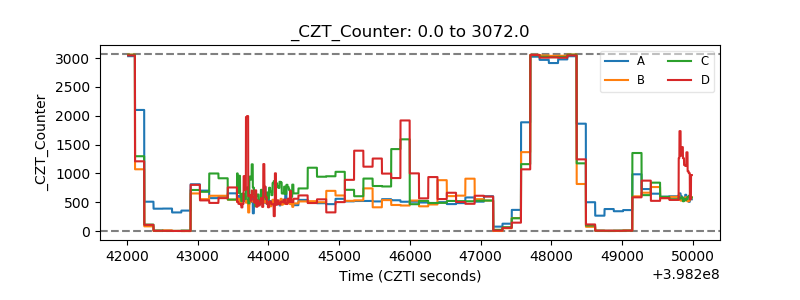 |
| +2.5 Volts monitor | 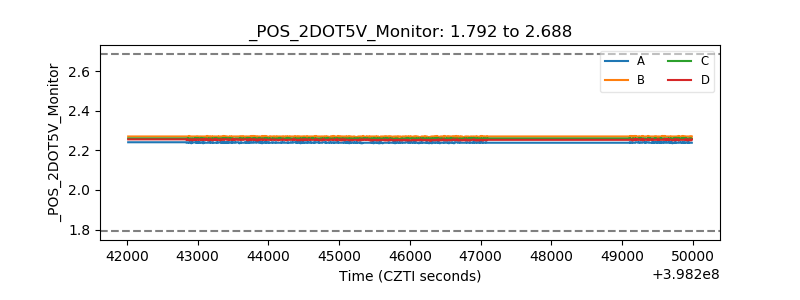 |
| +5 Volts monitor | 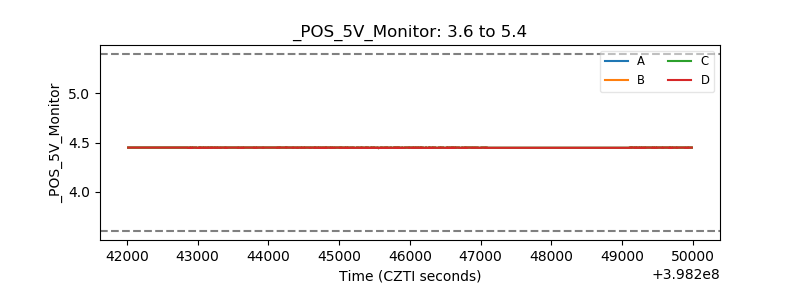 |
| _ROLL_ROT | 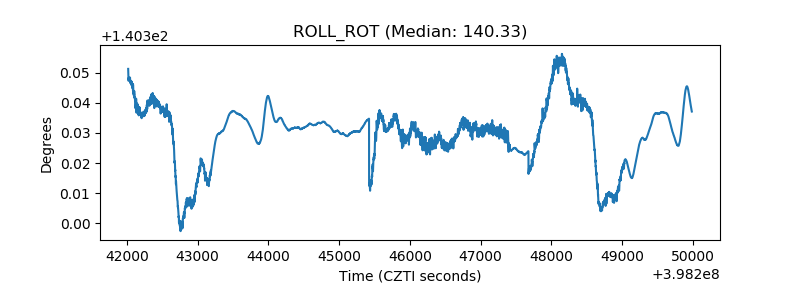 |
| _Roll_DEC | 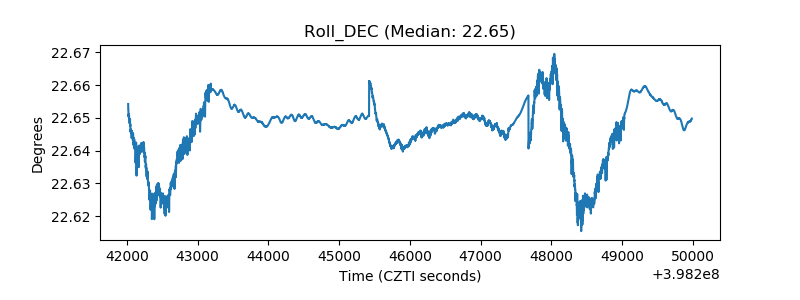 |
| _Roll_RA | 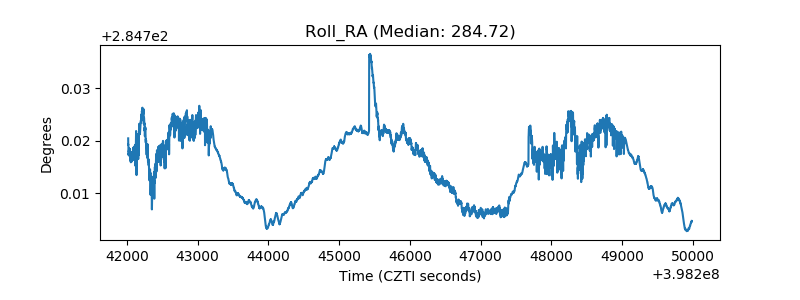 |
| Veto Counter | 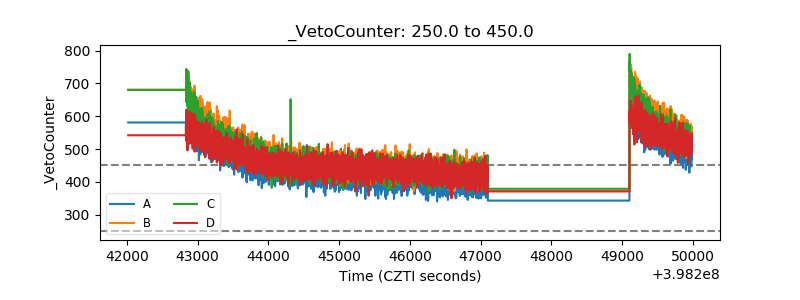 |