| Param | Original file | Final file |
|---|---|---|
| Filename | modeM0/AS1A11_079T01_9000005284_37202cztM0_level2.evt | modeM0/AS1A11_079T01_9000005284_37202cztM0_level2_quad_clean.evt |
| Size (bytes) | 466,116,480 | 79,732,800 |
| Size | 444.5 MB | 76.0 MB |
| Events in quadrant A | 2,953,355 | 528,302 |
| Events in quadrant B | 3,297,099 | 527,532 |
| Events in quadrant C | 3,434,277 | 511,426 |
| Events in quadrant D | 4,078,648 | 482,244 |
| Mode M9 | |||
|---|---|---|---|
| Quadrant | BADHDUFLAG | Total packets | Discarded packets |
| A | 0 | 41 | 0 |
| B | 0 | 41 | 0 |
| C | 0 | 41 | 0 |
| D | 0 | 41 | 0 |
| Mode SS | |||
|---|---|---|---|
| Quadrant | BADHDUFLAG | Total packets | Discarded packets |
| A | 0 | 108 | 0 |
| B | 0 | 108 | 0 |
| C | 0 | 108 | 0 |
| D | 0 | 108 | 0 |
| Mode M0 | |||
|---|---|---|---|
| Quadrant | BADHDUFLAG | Total packets | Discarded packets |
| A | 0 | 11824 | 3 |
| B | 0 | 13022 | 2 |
| C | 0 | 13374 | 2 |
| D | 0 | 15772 | 2 |
| Quadrant | Total seconds | Saturated seconds | Saturation percentage |
|---|---|---|---|
| A | 5211 | 19 | 0.364613% |
| B | 5211 | 79 | 1.516024% |
| C | 5211 | 62 | 1.189791% |
| D | 5211 | 111 | 2.130109% |
Noise dominated data is calculated using 1-second bins in cleaned event files. If a bin has >2000 counts, and if more than 50% of those come from <1% of pixels, then it is considered to be noise-dominated and hence unusable.
| Quadrant | # 1 sec bins | Bins with >0 counts | Bins with >2000 counts | High rate bins dominated by noise | Noise dominated (total time) | Noise dominated (detector-on time) | Marked lightcurve |
|---|---|---|---|---|---|---|---|
| A | 9306 | 5213 | 1 | 1 | 0.01% | 0.02% | 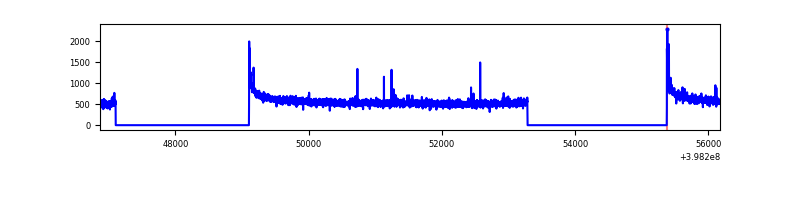 |
| B | 9306 | 5213 | 47 | 47 | 0.51% | 0.90% | 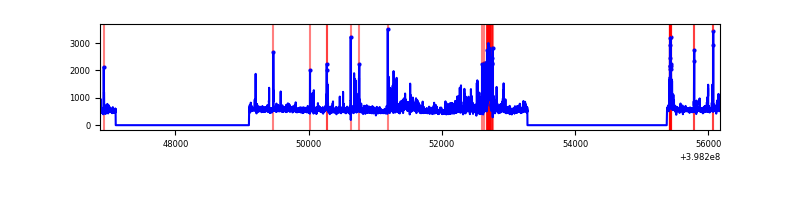 |
| C | 9306 | 5213 | 42 | 42 | 0.45% | 0.81% | 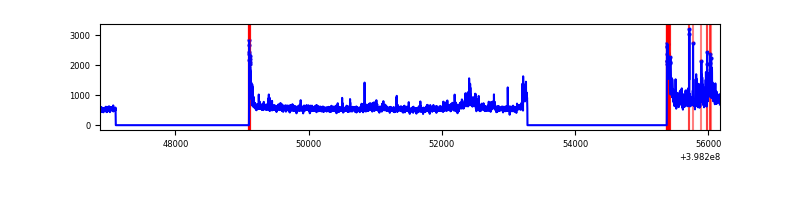 |
| D | 9306 | 5213 | 94 | 94 | 1.01% | 1.80% | 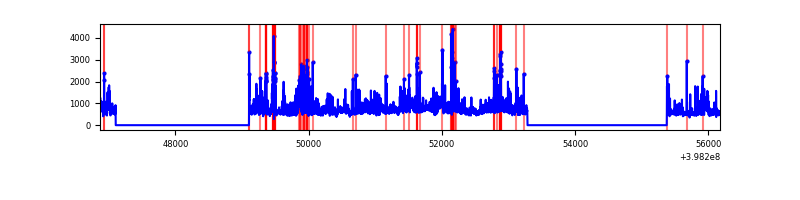 |
Top three noisy pixels from each quadrant. If the there are fewer than three noisy pixels in the level2.evt file, extra rows are filled as -1
| Pixel properties | Quadrant properties | ||||||
|---|---|---|---|---|---|---|---|
| Quadrant | DetID | PixID | Counts | Sigma | Mean | Median | Sigma |
| A | 10 | 83 | 254793 | 1846.43 | 693 | 682 | 137.6 |
| A | 9 | 143 | 11402 | 77.89 | 693 | 682 | 137.6 |
| A | 13 | 254 | 7810 | 51.79 | 693 | 682 | 137.6 |
| B | 5 | 172 | 343760 | 2694.64 | 675 | 660 | 127.3 |
| B | 0 | 213 | 178046 | 1393.16 | 675 | 660 | 127.3 |
| B | 0 | 155 | 88879 | 692.86 | 675 | 660 | 127.3 |
| C | 10 | 49 | 356956 | 2364.19 | 655 | 661 | 150.7 |
| C | 15 | 214 | 226766 | 1500.31 | 655 | 661 | 150.7 |
| C | 0 | 207 | 154024 | 1017.63 | 655 | 661 | 150.7 |
| D | 1 | 52 | 589560 | 3703.28 | 659 | 643 | 159.0 |
| D | 2 | 153 | 241918 | 1517.21 | 659 | 643 | 159.0 |
| D | 13 | 249 | 156247 | 978.48 | 659 | 643 | 159.0 |
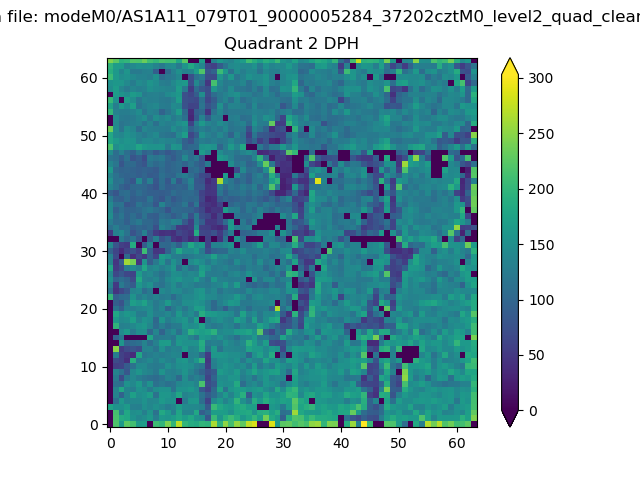
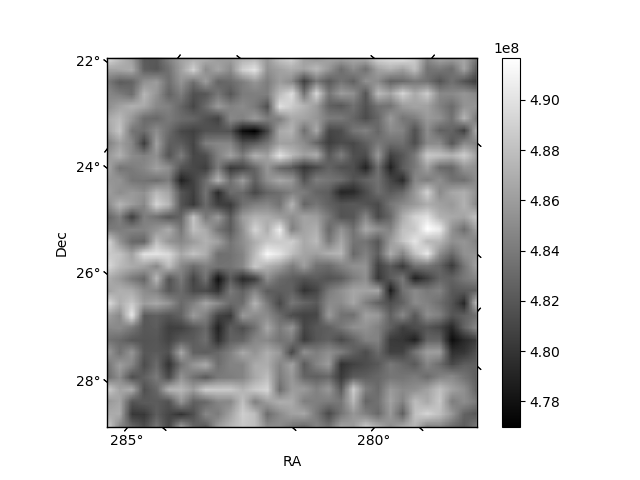
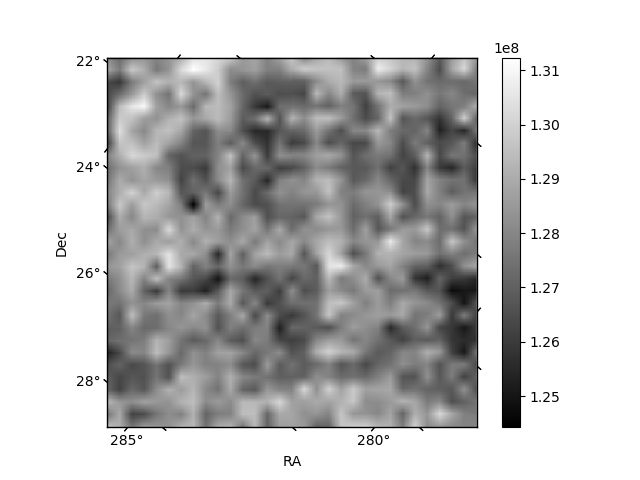
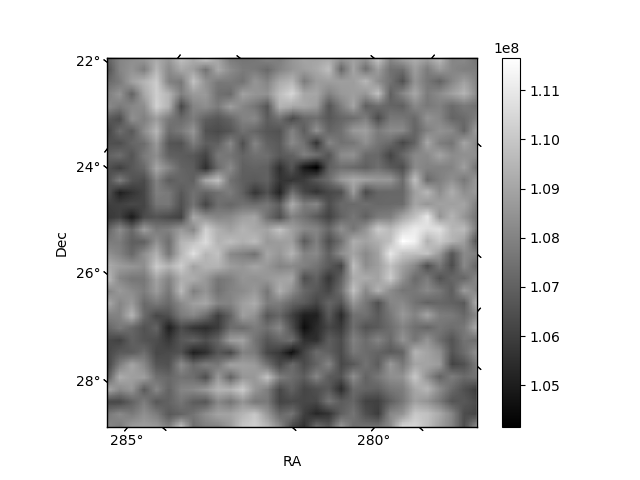
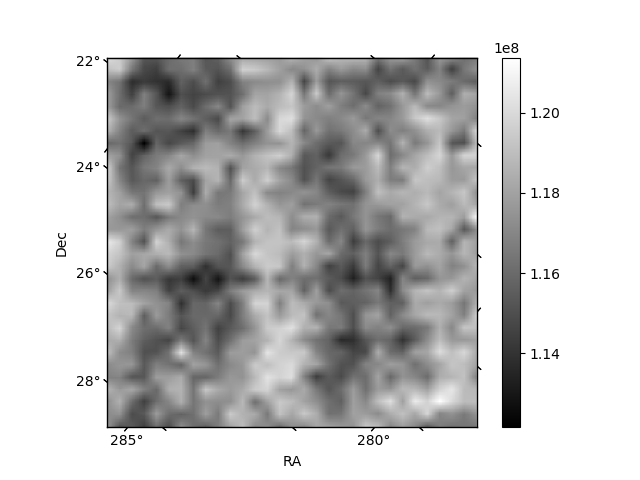
Histogram calculated using DETX and DETY for each event in the final _common_clean file
| Quadrant A | 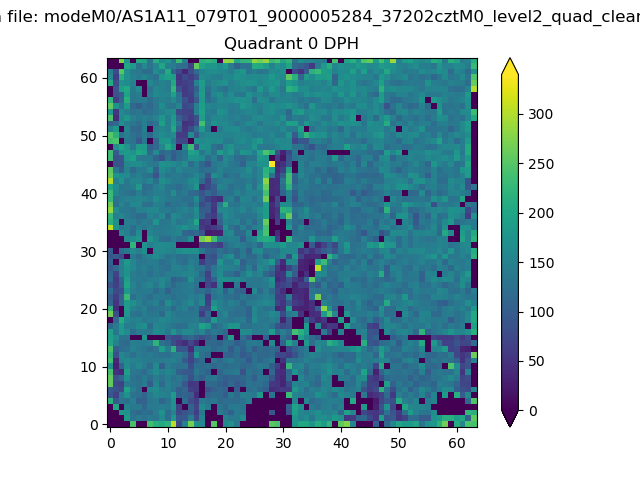 |
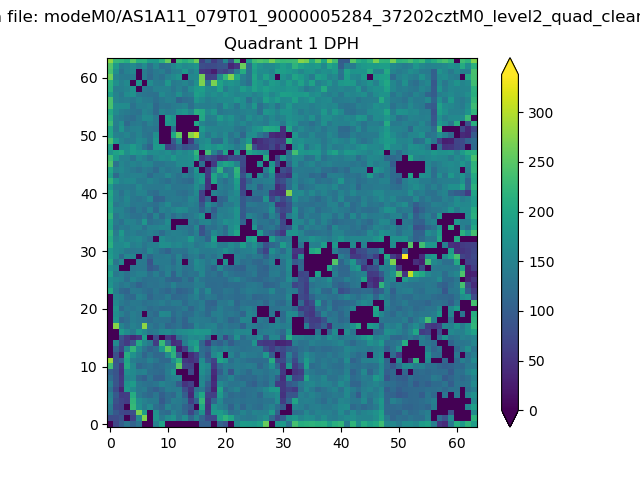 |
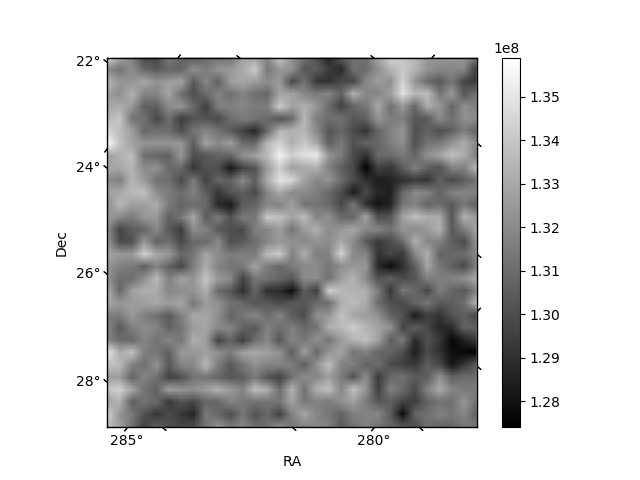
Quadrant B |
|---|---|---|---|
| Quadrant D | 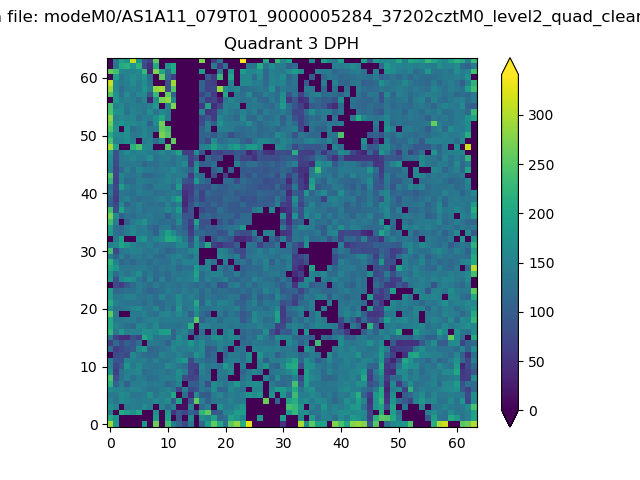 |
 |
Quadrant C |
| Plot type | Count rate plots | Images |
|---|---|---|
| Comparison with Poisson distribution Blue bars denote a histogram of data divided into 1 sec bins. Red curve is a Poisson curve with rate = median count rate of data. |
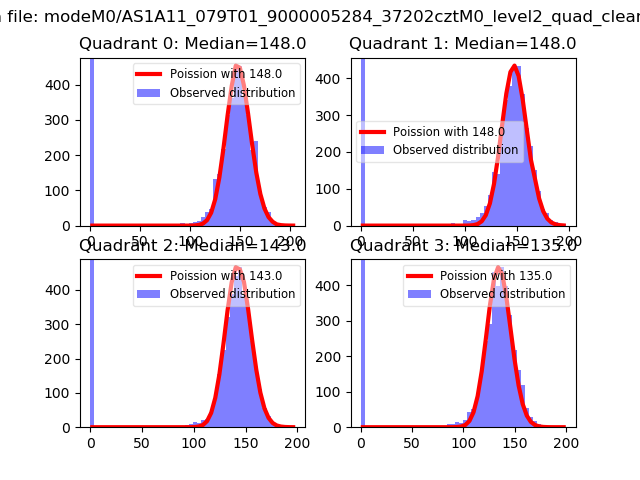 |
 |
| Quadrant-wise count rates Data is divided into 100 sec bins |
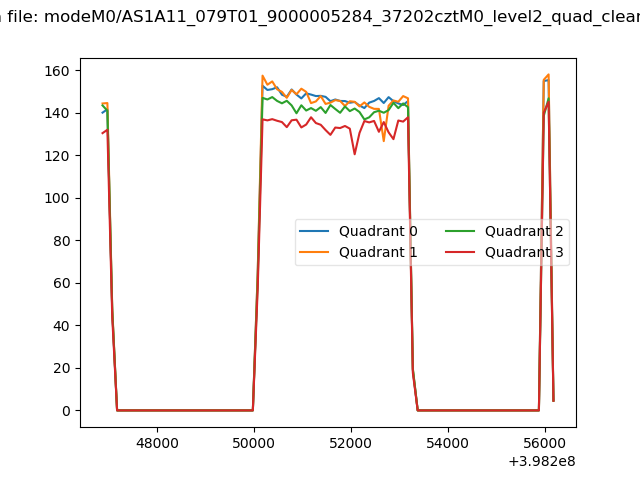 |
|
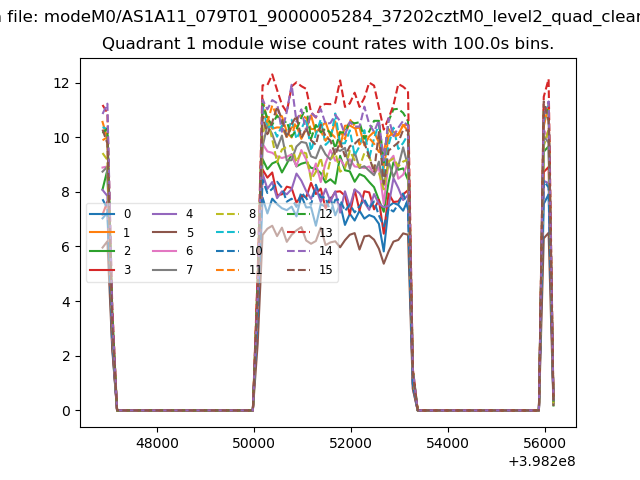
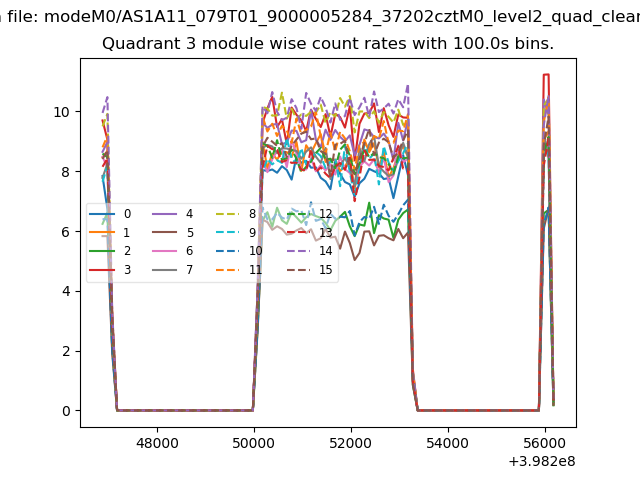
| Module-wise count rates for Quadrant A Data is divided into 100 sec bins |
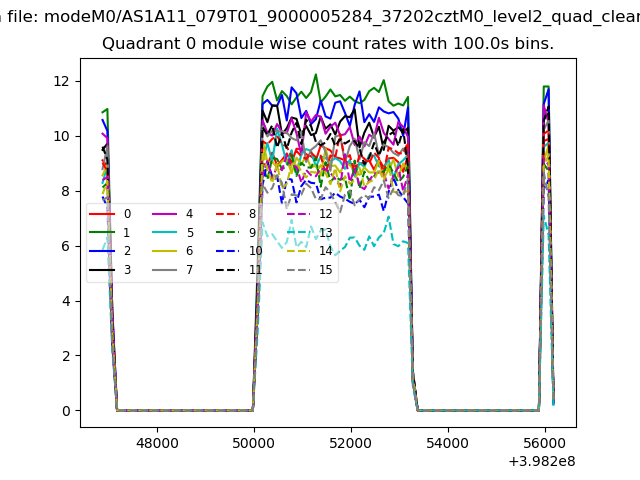 |
 |
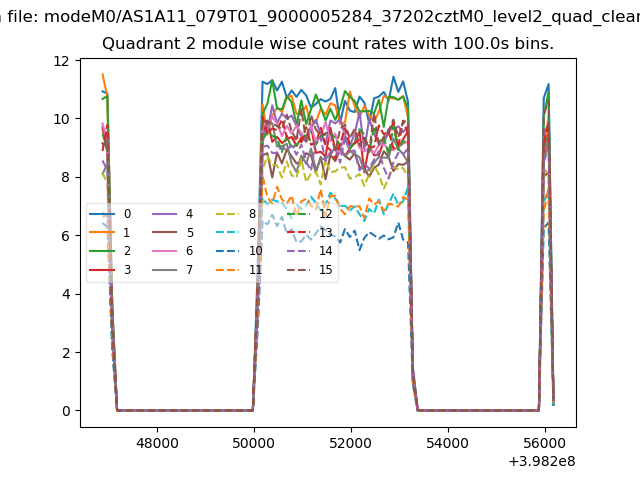
| Module-wise count rates for Quadrant B Data is divided into 100 sec bins |
 |
 |
| Module-wise count rates for Quadrant C Data is divided into 100 sec bins |
 |
 |
| Module-wise count rates for Quadrant D Data is divided into 100 sec bins |
 |
 |
| Parameter | Plot |
|---|---|
| CZT HV Monitor | 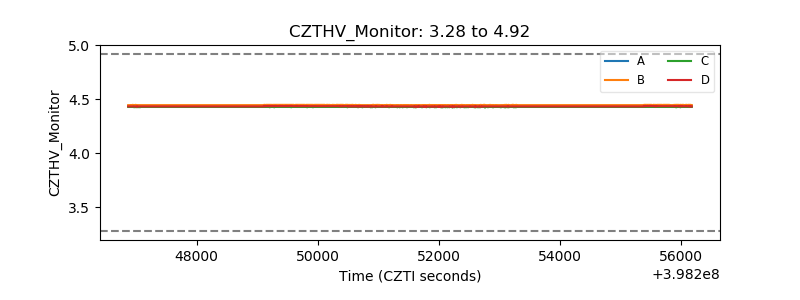 |
| D_VDD | 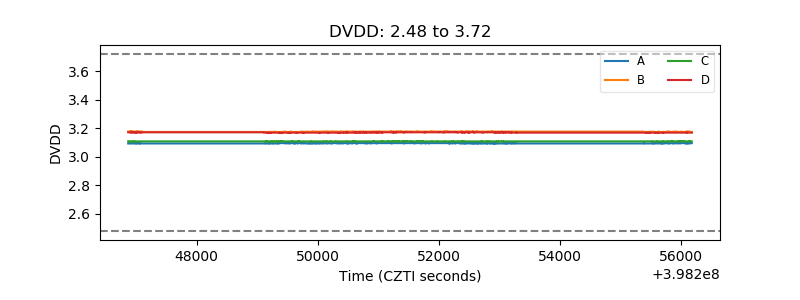 |
| Temperature 1 | 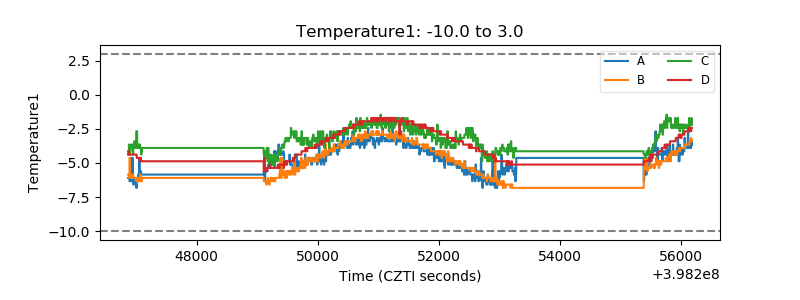 |
| Veto HV Monitor | 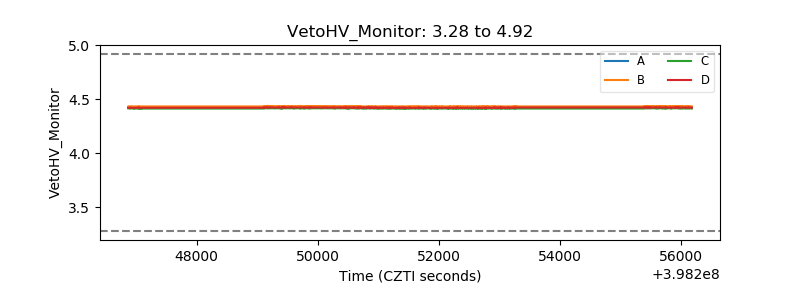 |
| Veto LLD | 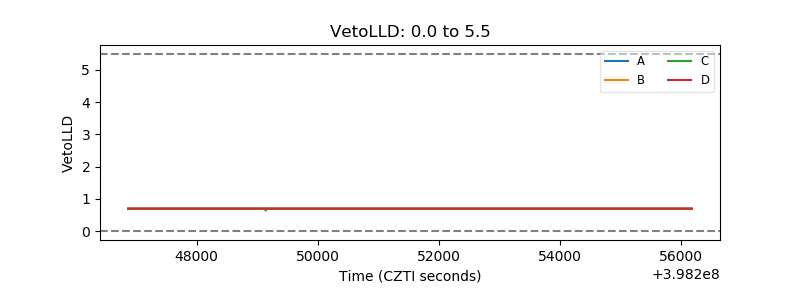 |
| Alpha Counter | 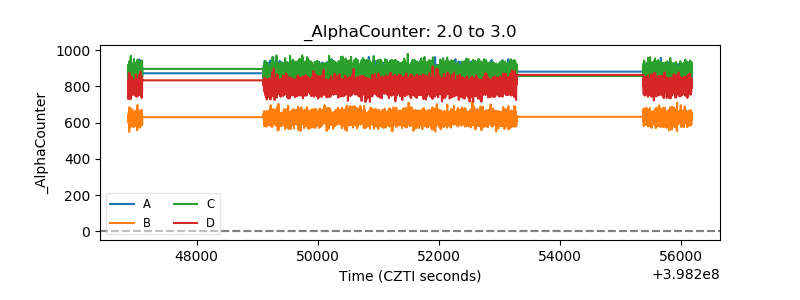 |
| _CPM_Rate | 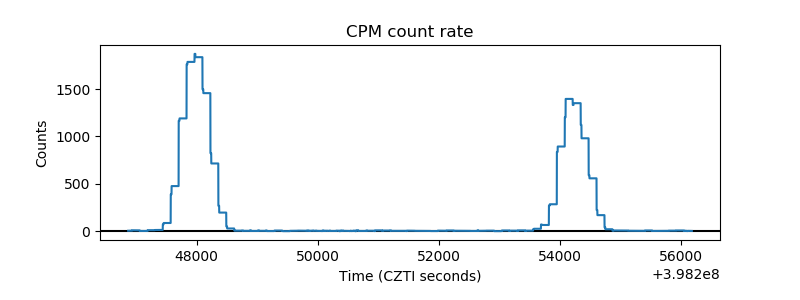 |
| CZT Counter | 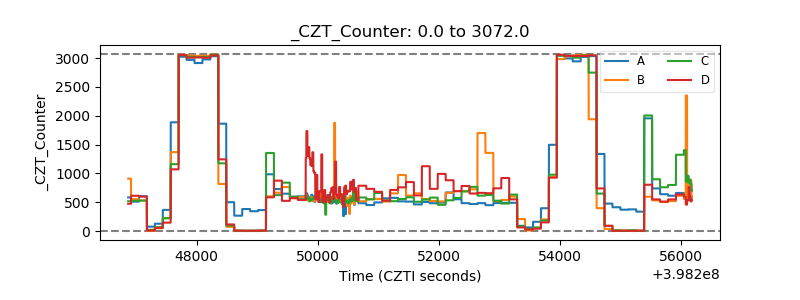 |
| +2.5 Volts monitor | 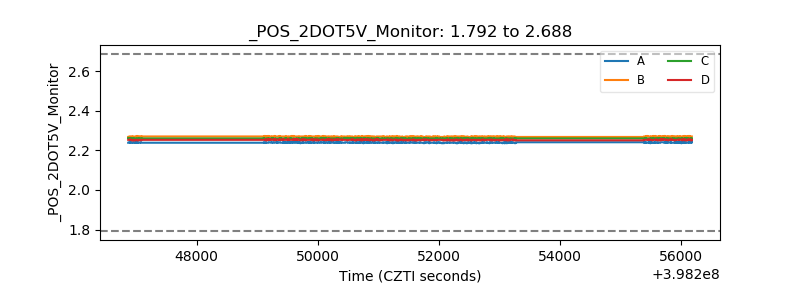 |
| +5 Volts monitor | 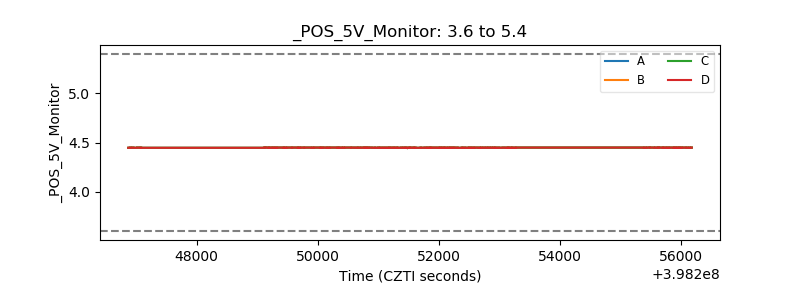 |
| _ROLL_ROT | 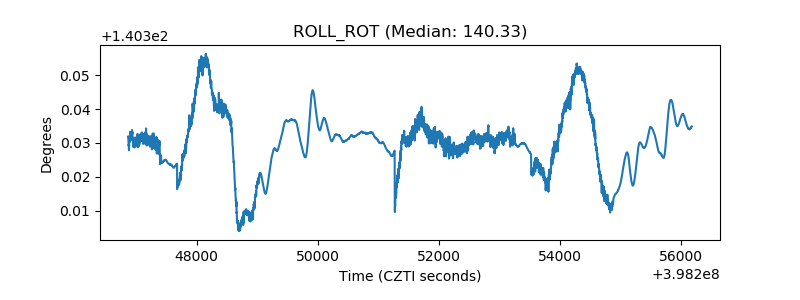 |
| _Roll_DEC | 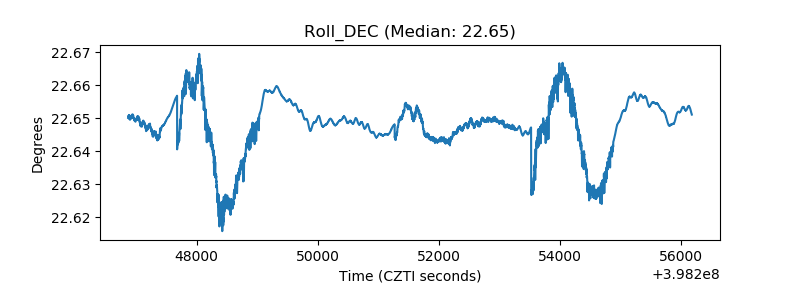 |
| _Roll_RA | 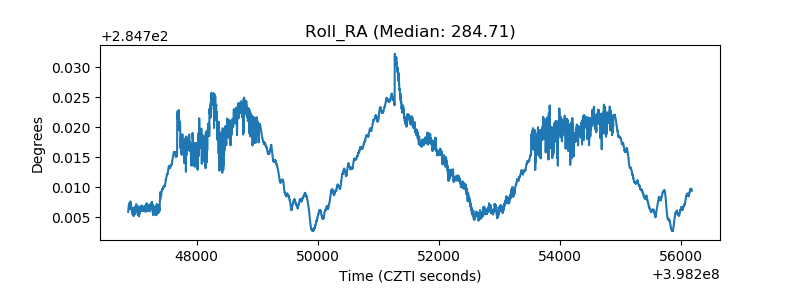 |
| Veto Counter | 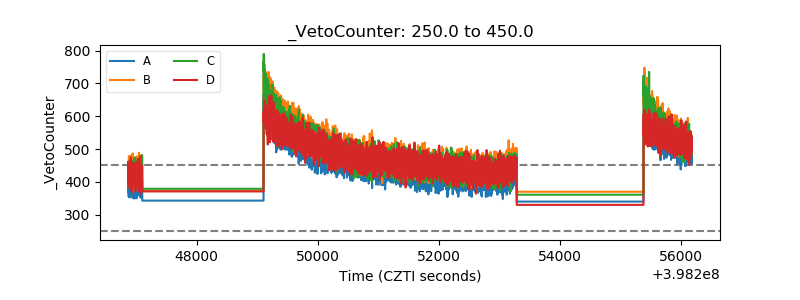 |