| Param | Original file | Final file |
|---|---|---|
| Filename | modeM0/AS1A11_079T01_9000005284_37203cztM0_level2.evt | modeM0/AS1A11_079T01_9000005284_37203cztM0_level2_quad_clean.evt |
| Size (bytes) | 484,502,400 | 92,600,640 |
| Size | 462.1 MB | 88.3 MB |
| Events in quadrant A | 2,864,973 | 638,010 |
| Events in quadrant B | 3,292,296 | 631,121 |
| Events in quadrant C | 3,638,601 | 615,448 |
| Events in quadrant D | 4,529,392 | 559,885 |
| Mode M9 | |||
|---|---|---|---|
| Quadrant | BADHDUFLAG | Total packets | Discarded packets |
| A | 0 | 38 | 0 |
| B | 0 | 38 | 0 |
| C | 0 | 38 | 0 |
| D | 0 | 39 | 0 |
| Mode SS | |||
|---|---|---|---|
| Quadrant | BADHDUFLAG | Total packets | Discarded packets |
| A | 0 | 104 | 0 |
| B | 0 | 104 | 0 |
| C | 0 | 104 | 0 |
| D | 0 | 104 | 0 |
| Mode M0 | |||
|---|---|---|---|
| Quadrant | BADHDUFLAG | Total packets | Discarded packets |
| A | 0 | 11574 | 3 |
| B | 0 | 12850 | 2 |
| C | 0 | 13967 | 2 |
| D | 0 | 16749 | 2 |
| Quadrant | Total seconds | Saturated seconds | Saturation percentage |
|---|---|---|---|
| A | 5136 | 22 | 0.428349% |
| B | 5136 | 147 | 2.862150% |
| C | 5136 | 61 | 1.187695% |
| D | 5136 | 488 | 9.501558% |
Noise dominated data is calculated using 1-second bins in cleaned event files. If a bin has >2000 counts, and if more than 50% of those come from <1% of pixels, then it is considered to be noise-dominated and hence unusable.
| Quadrant | # 1 sec bins | Bins with >0 counts | Bins with >2000 counts | High rate bins dominated by noise | Noise dominated (total time) | Noise dominated (detector-on time) | Marked lightcurve |
|---|---|---|---|---|---|---|---|
| A | 7288 | 5137 | 5 | 5 | 0.07% | 0.10% | 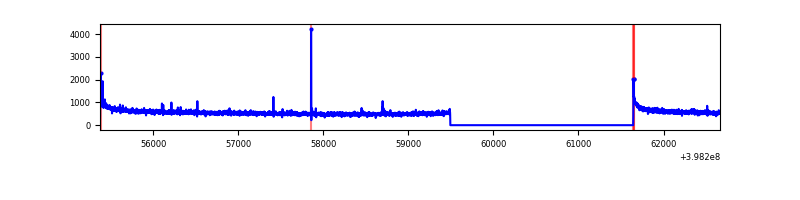 |
| B | 7288 | 5137 | 96 | 96 | 1.32% | 1.87% | 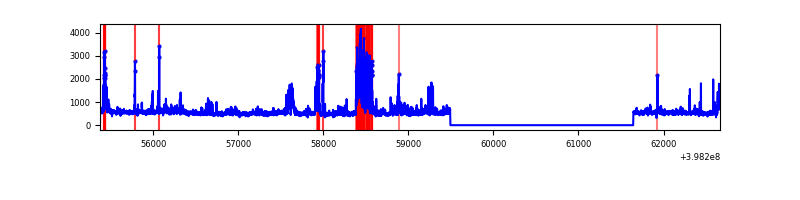 |
| C | 7288 | 5137 | 43 | 43 | 0.59% | 0.84% | 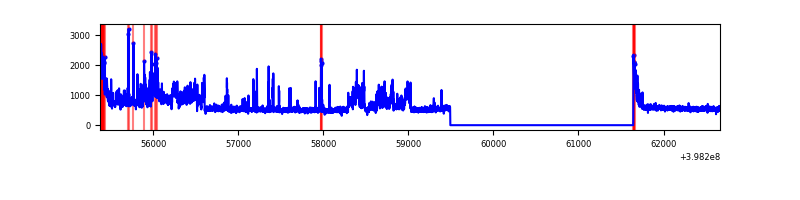 |
| D | 7288 | 5137 | 439 | 439 | 6.02% | 8.55% | 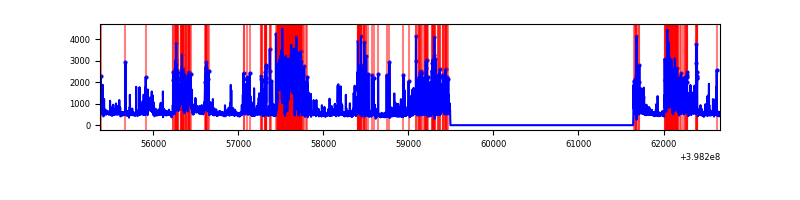 |
Top three noisy pixels from each quadrant. If the there are fewer than three noisy pixels in the level2.evt file, extra rows are filled as -1
| Pixel properties | Quadrant properties | ||||||
|---|---|---|---|---|---|---|---|
| Quadrant | DetID | PixID | Counts | Sigma | Mean | Median | Sigma |
| A | 10 | 83 | 258581 | 1939.4 | 666 | 655 | 133.0 |
| A | 13 | 248 | 10891 | 76.97 | 666 | 655 | 133.0 |
| A | 9 | 143 | 10763 | 76.0 | 666 | 655 | 133.0 |
| B | 5 | 172 | 424999 | 3492.53 | 643 | 628 | 121.5 |
| B | 5 | 184 | 175391 | 1438.28 | 643 | 628 | 121.5 |
| B | 0 | 213 | 115406 | 944.61 | 643 | 628 | 121.5 |
| C | 10 | 49 | 615272 | 4183.28 | 633 | 638 | 146.9 |
| C | 15 | 214 | 224488 | 1523.55 | 633 | 638 | 146.9 |
| C | 0 | 207 | 199692 | 1354.79 | 633 | 638 | 146.9 |
| D | 2 | 249 | 1088159 | 7203.81 | 619 | 603 | 151.0 |
| D | 12 | 227 | 499906 | 3307.31 | 619 | 603 | 151.0 |
| D | 2 | 153 | 122773 | 809.24 | 619 | 603 | 151.0 |
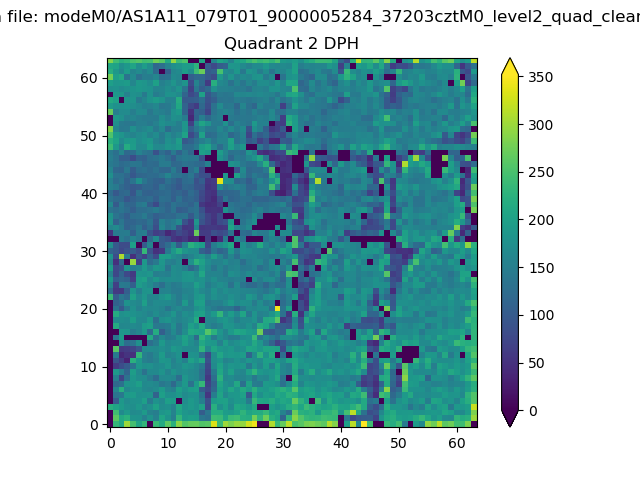
Histogram calculated using DETX and DETY for each event in the final _common_clean file
| Quadrant A | 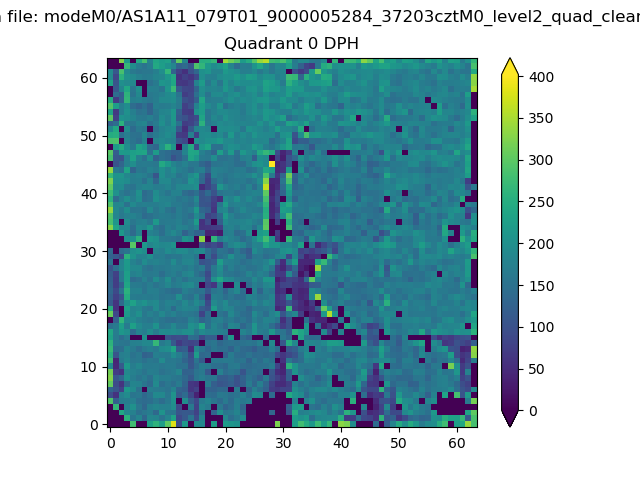 |
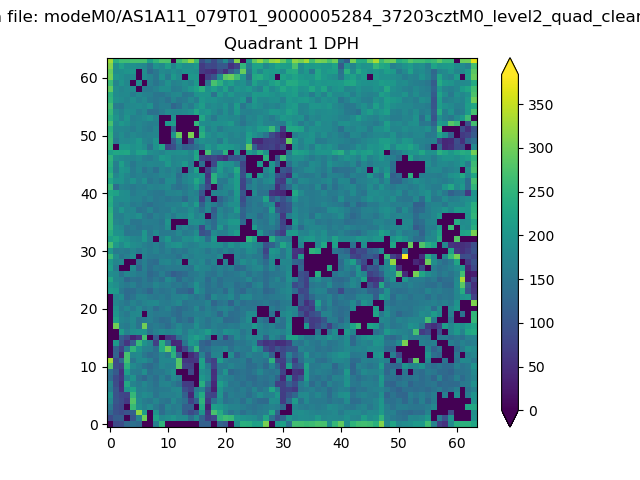 |
Quadrant B |
|---|---|---|---|
| Quadrant D | 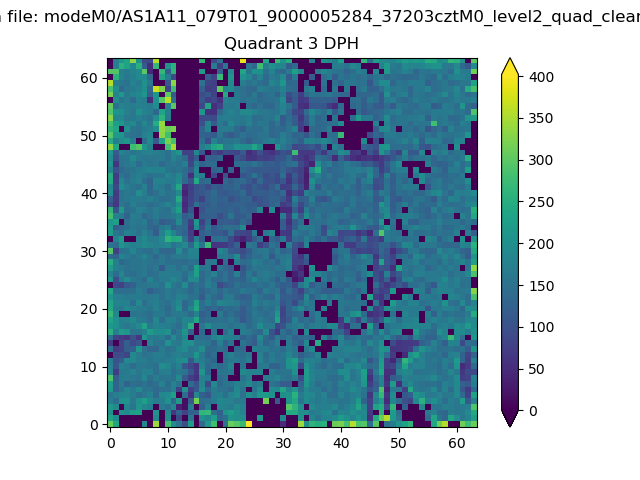 |
 |
Quadrant C |
| Plot type | Count rate plots | Images |
|---|---|---|
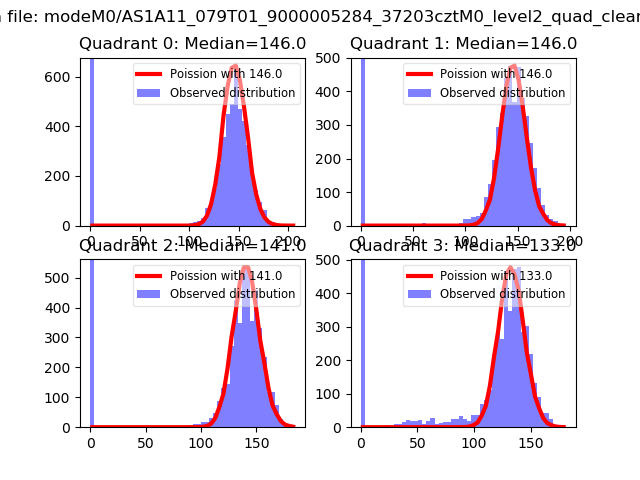
| Comparison with Poisson distribution Blue bars denote a histogram of data divided into 1 sec bins. Red curve is a Poisson curve with rate = median count rate of data. |
 |
 |
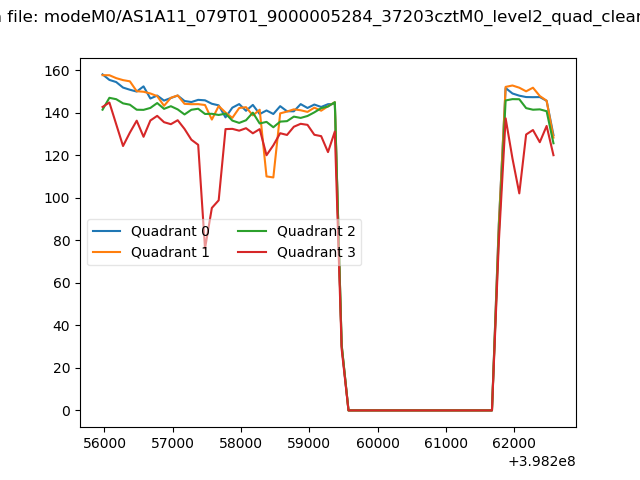
| Quadrant-wise count rates Data is divided into 100 sec bins |
 |
|
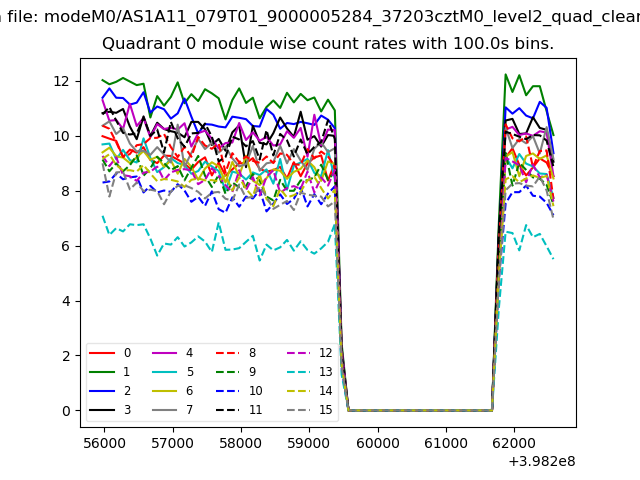
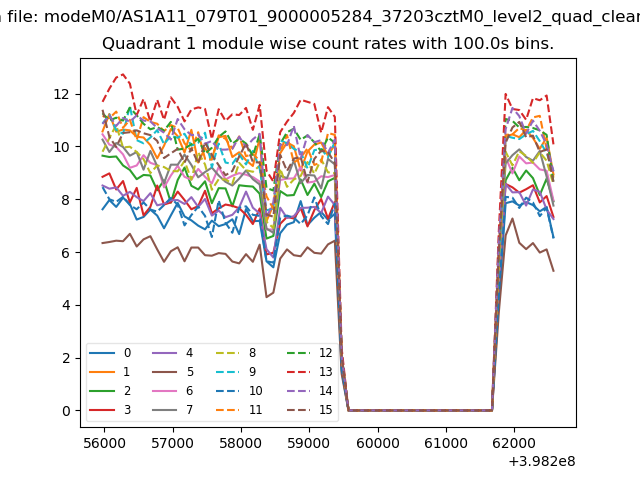
| Module-wise count rates for Quadrant A Data is divided into 100 sec bins |
 |
 |
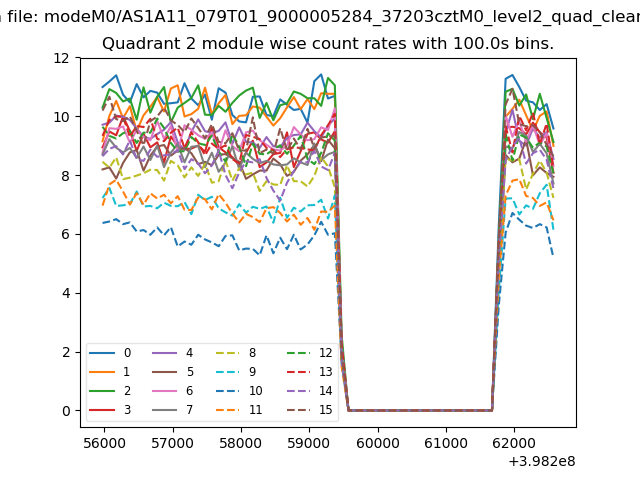
| Module-wise count rates for Quadrant B Data is divided into 100 sec bins |
 |
 |
| Module-wise count rates for Quadrant C Data is divided into 100 sec bins |
 |
 |
| Module-wise count rates for Quadrant D Data is divided into 100 sec bins |
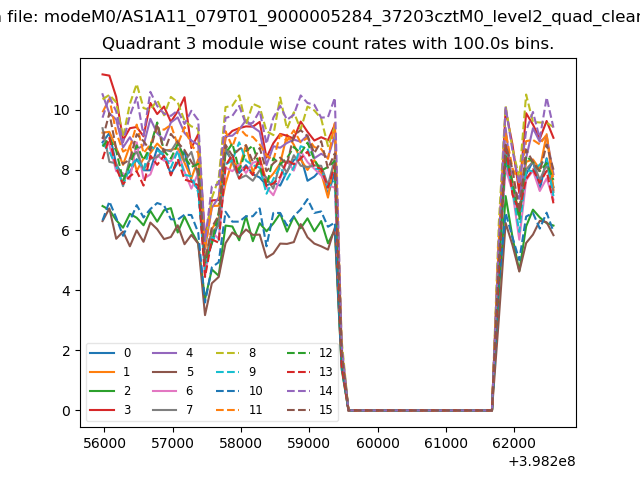 |
 |
| Parameter | Plot |
|---|---|
| CZT HV Monitor | 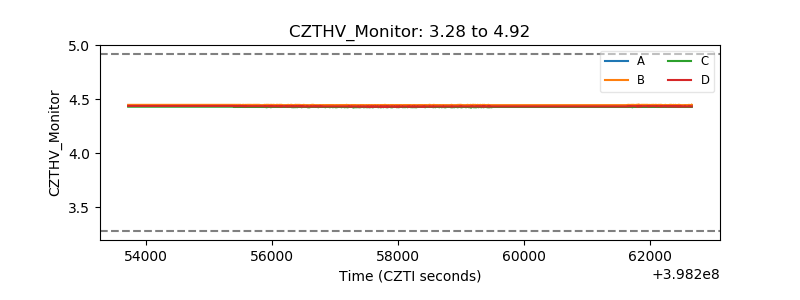 |
| D_VDD | 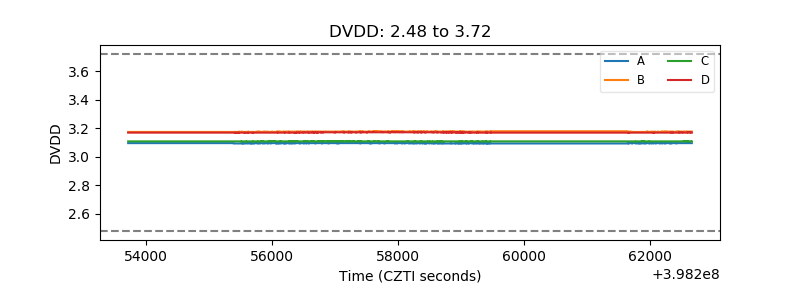 |
| Temperature 1 | 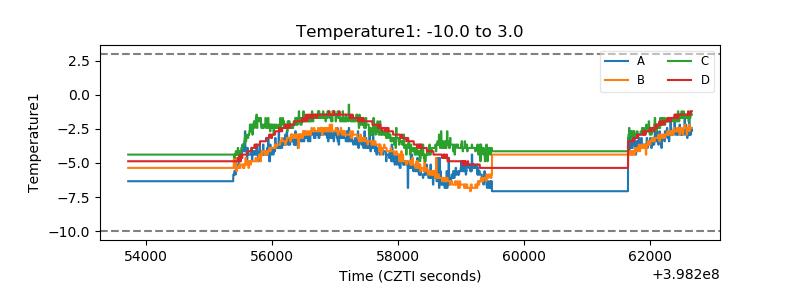 |
| Veto HV Monitor | 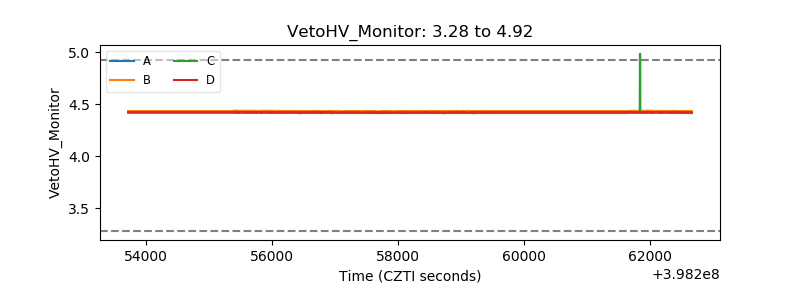 |
| Veto LLD | 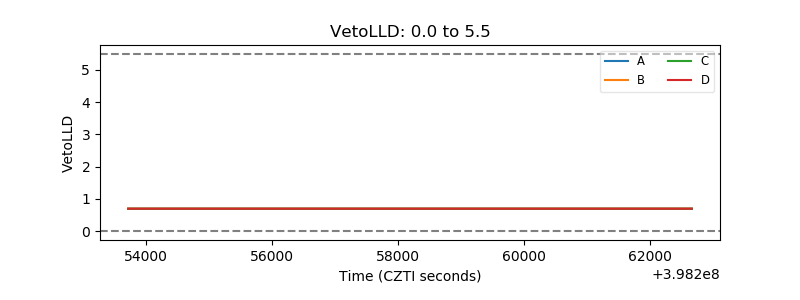 |
| Alpha Counter | 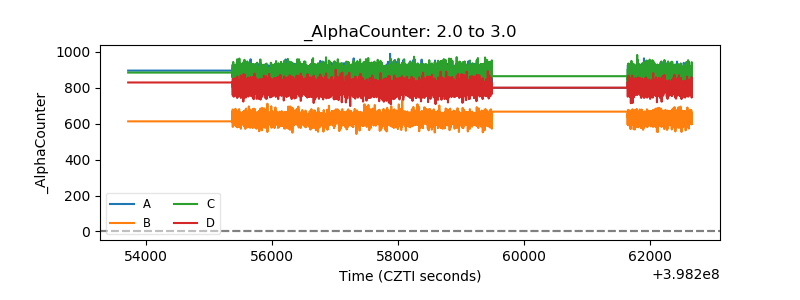 |
| _CPM_Rate | 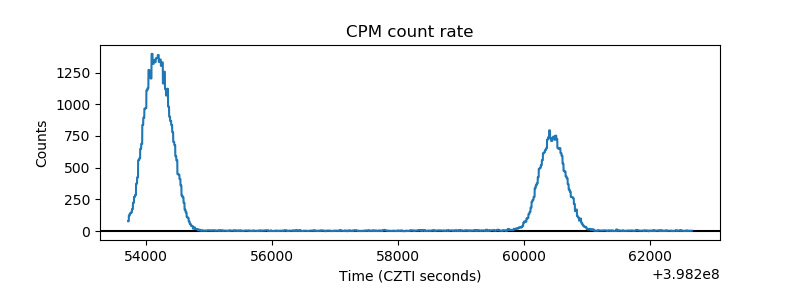 |
| CZT Counter | 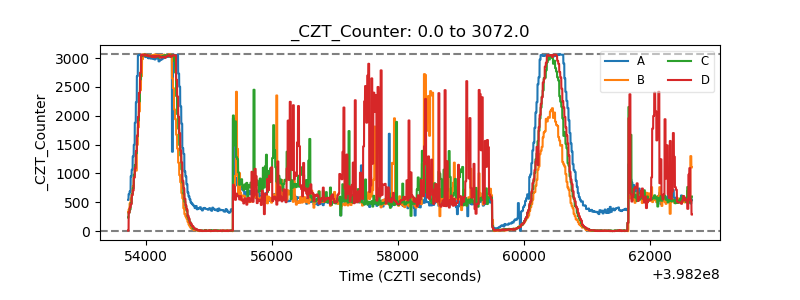 |
| +2.5 Volts monitor | 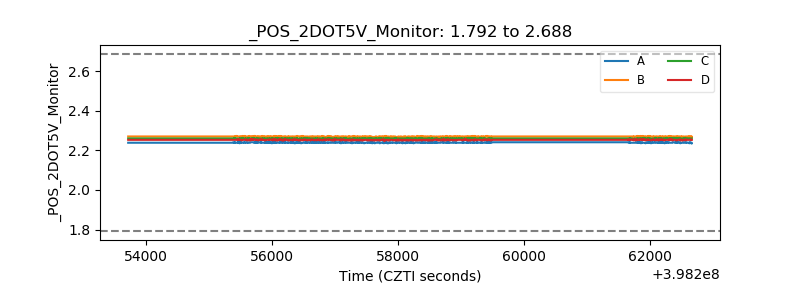 |
| +5 Volts monitor | 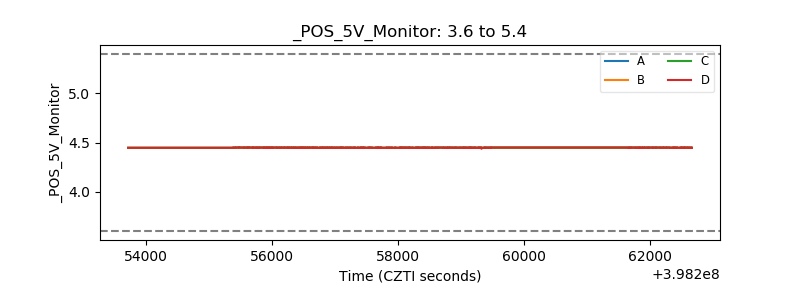 |
| _ROLL_ROT |  |
| _Roll_DEC | 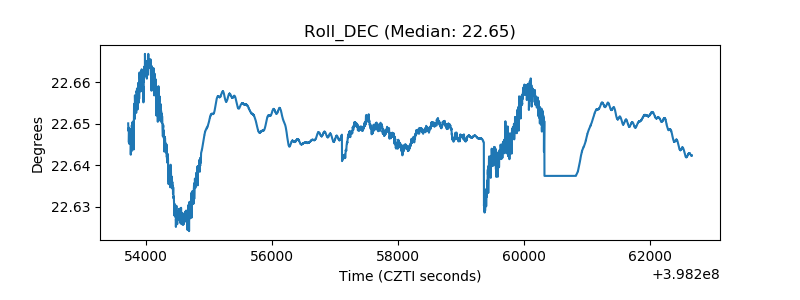 |
| _Roll_RA | 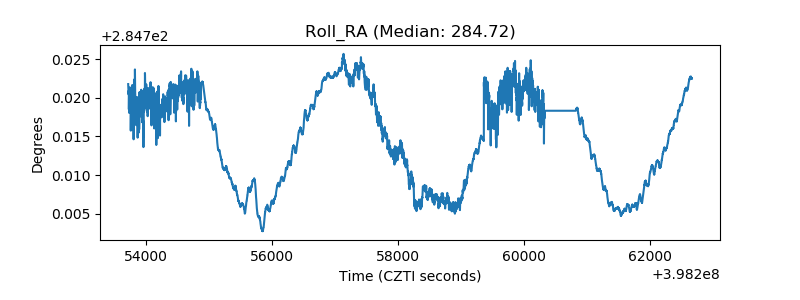 |
| Veto Counter | 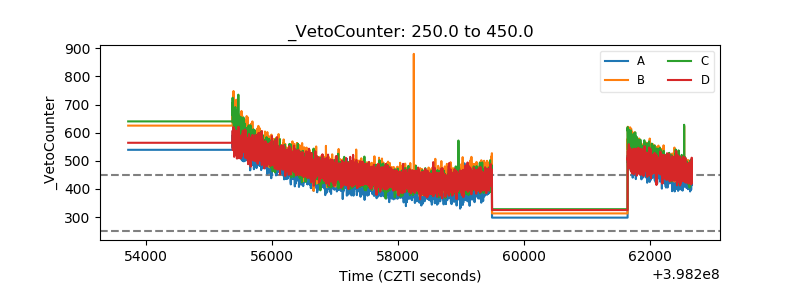 |