| Param | Original file | Final file |
|---|---|---|
| Filename | modeM0/AS1A11_079T01_9000005284_37204cztM0_level2.evt | modeM0/AS1A11_079T01_9000005284_37204cztM0_level2_quad_clean.evt |
| Size (bytes) | 459,682,560 | 94,559,040 |
| Size | 438.4 MB | 90.2 MB |
| Events in quadrant A | 2,802,958 | 645,306 |
| Events in quadrant B | 3,532,328 | 633,592 |
| Events in quadrant C | 3,752,949 | 626,651 |
| Events in quadrant D | 3,478,742 | 591,798 |
| Mode M9 | |||
|---|---|---|---|
| Quadrant | BADHDUFLAG | Total packets | Discarded packets |
| A | 0 | 27 | 0 |
| B | 0 | 27 | 0 |
| C | 0 | 27 | 0 |
| D | 0 | 28 | 0 |
| Mode SS | |||
|---|---|---|---|
| Quadrant | BADHDUFLAG | Total packets | Discarded packets |
| A | 0 | 108 | 0 |
| B | 0 | 108 | 0 |
| C | 0 | 108 | 0 |
| D | 0 | 108 | 0 |
| Mode M0 | |||
|---|---|---|---|
| Quadrant | BADHDUFLAG | Total packets | Discarded packets |
| A | 0 | 11479 | 3 |
| B | 0 | 13784 | 2 |
| C | 0 | 14388 | 2 |
| D | 0 | 13727 | 2 |
| Quadrant | Total seconds | Saturated seconds | Saturation percentage |
|---|---|---|---|
| A | 5223 | 16 | 0.306337% |
| B | 5223 | 199 | 3.810071% |
| C | 5223 | 42 | 0.804136% |
| D | 5223 | 214 | 4.097262% |
Noise dominated data is calculated using 1-second bins in cleaned event files. If a bin has >2000 counts, and if more than 50% of those come from <1% of pixels, then it is considered to be noise-dominated and hence unusable.
| Quadrant | # 1 sec bins | Bins with >0 counts | Bins with >2000 counts | High rate bins dominated by noise | Noise dominated (total time) | Noise dominated (detector-on time) | Marked lightcurve |
|---|---|---|---|---|---|---|---|
| A | 7315 | 5224 | 9 | 9 | 0.12% | 0.17% | 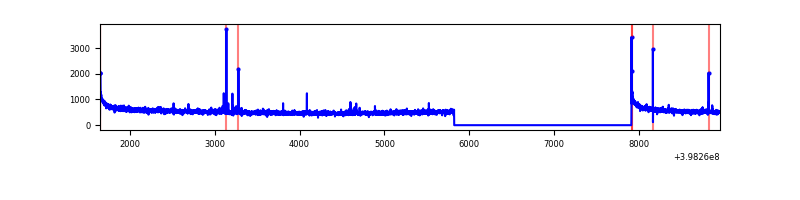 |
| B | 7315 | 5224 | 145 | 145 | 1.98% | 2.78% | 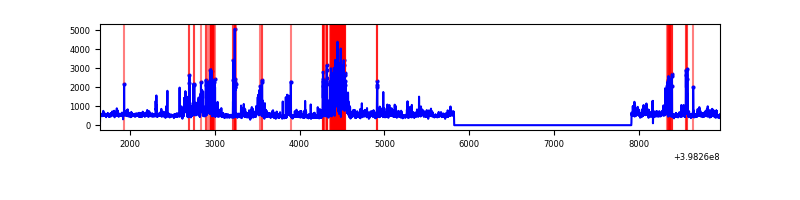 |
| C | 7315 | 5224 | 29 | 29 | 0.40% | 0.56% | 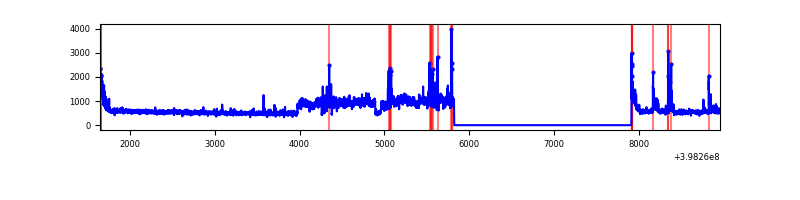 |
| D | 7315 | 5224 | 161 | 161 | 2.20% | 3.08% | 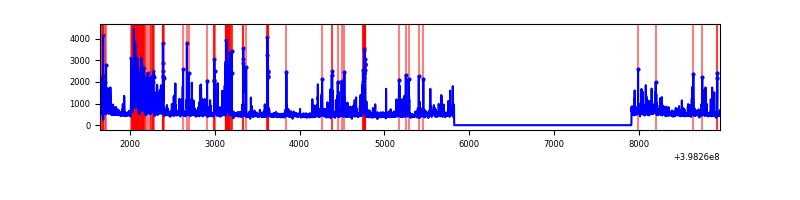 |
Top three noisy pixels from each quadrant. If the there are fewer than three noisy pixels in the level2.evt file, extra rows are filled as -1
| Pixel properties | Quadrant properties | ||||||
|---|---|---|---|---|---|---|---|
| Quadrant | DetID | PixID | Counts | Sigma | Mean | Median | Sigma |
| A | 10 | 83 | 262279 | 2030.37 | 644 | 633 | 128.9 |
| A | 13 | 248 | 14369 | 106.59 | 644 | 633 | 128.9 |
| A | 9 | 143 | 13290 | 98.22 | 644 | 633 | 128.9 |
| B | 5 | 172 | 694964 | 5814.54 | 624 | 609 | 119.4 |
| B | 0 | 213 | 321704 | 2688.86 | 624 | 609 | 119.4 |
| B | 0 | 155 | 33295 | 273.71 | 624 | 609 | 119.4 |
| C | 10 | 49 | 914423 | 6371.5 | 618 | 623 | 143.4 |
| C | 15 | 214 | 227022 | 1578.58 | 618 | 623 | 143.4 |
| C | 0 | 10 | 96994 | 671.95 | 618 | 623 | 143.4 |
| D | 2 | 249 | 805145 | 5378.58 | 616 | 601 | 149.6 |
| D | 2 | 153 | 136340 | 907.45 | 616 | 601 | 149.6 |
| D | 13 | 249 | 51872 | 342.76 | 616 | 601 | 149.6 |
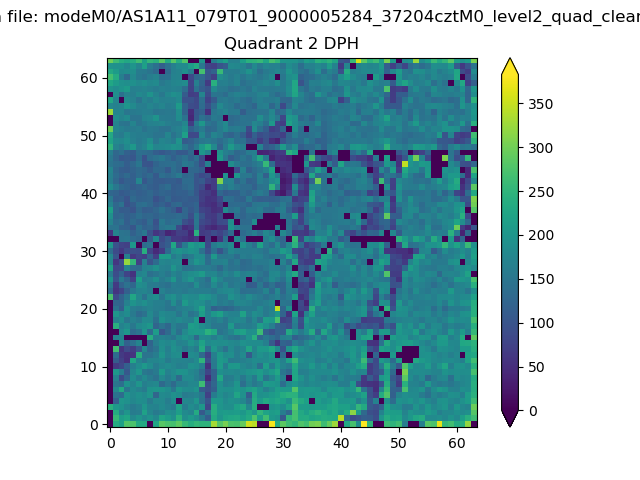
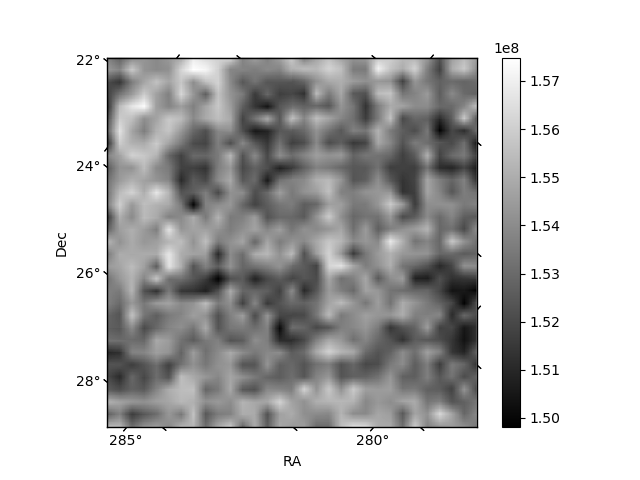
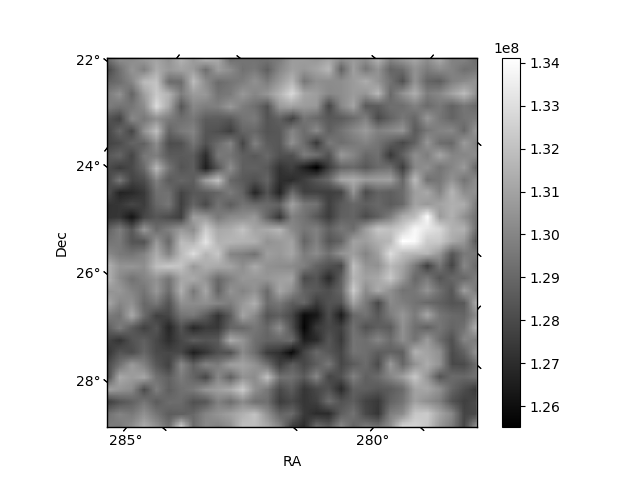
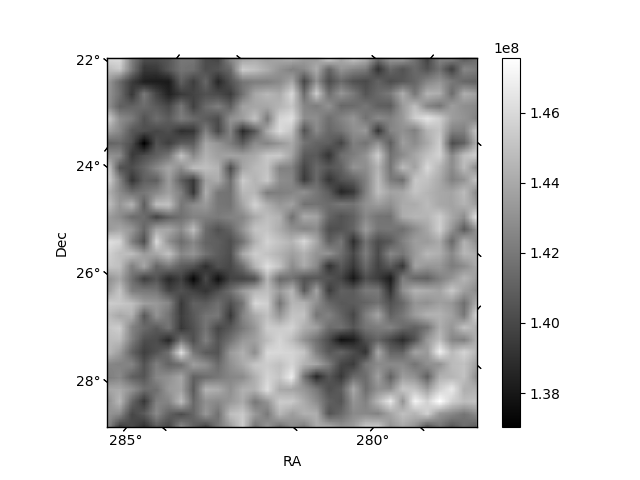
Histogram calculated using DETX and DETY for each event in the final _common_clean file
| Quadrant A | 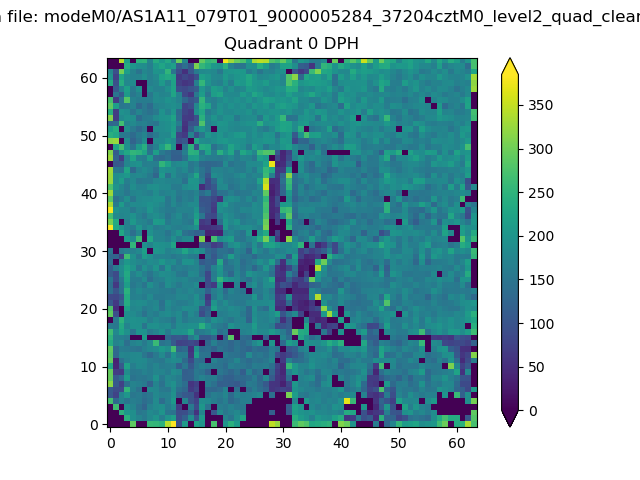 |
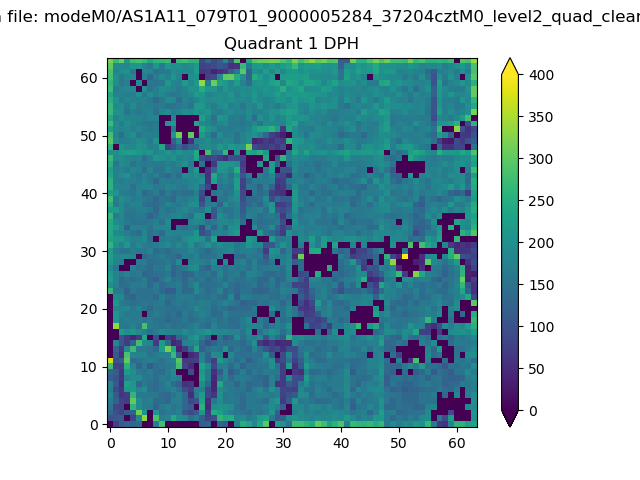 |
Quadrant B |
|---|---|---|---|
| Quadrant D | 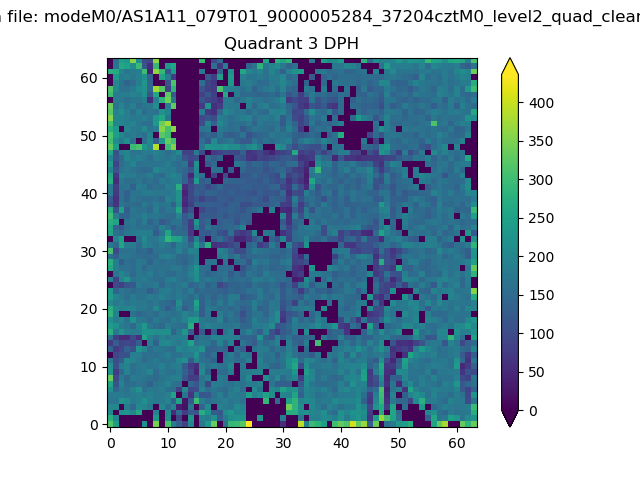 |
 |
Quadrant C |
| Plot type | Count rate plots | Images |
|---|---|---|
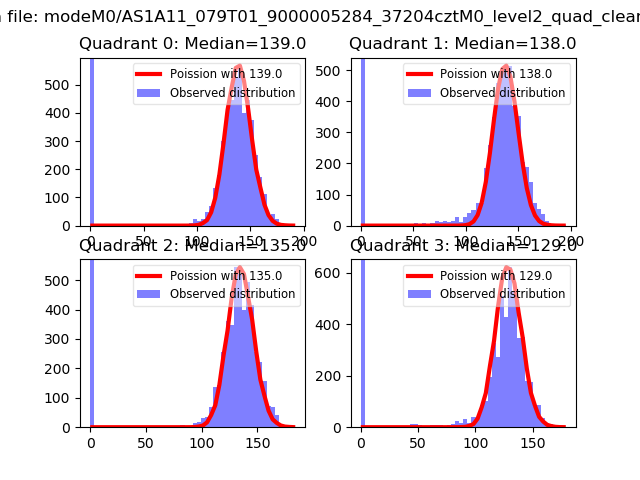
| Comparison with Poisson distribution Blue bars denote a histogram of data divided into 1 sec bins. Red curve is a Poisson curve with rate = median count rate of data. |
 |
 |
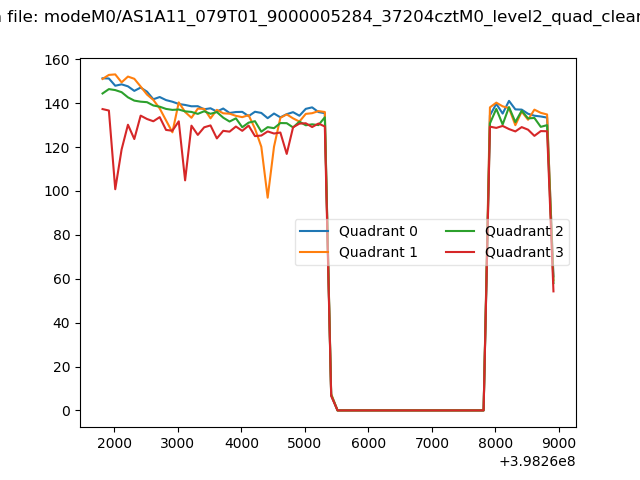
| Quadrant-wise count rates Data is divided into 100 sec bins |
 |
|
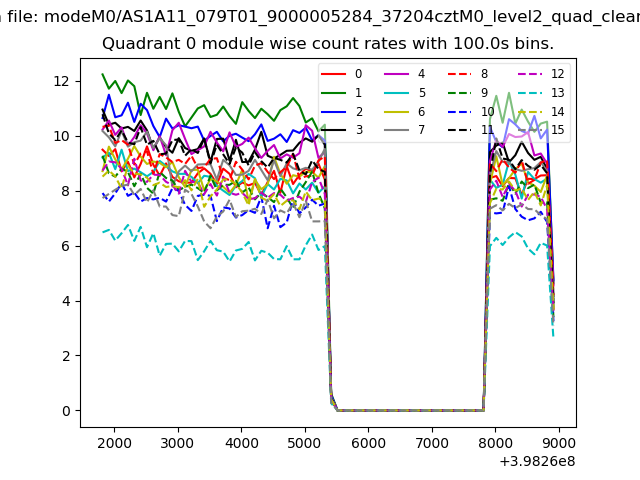
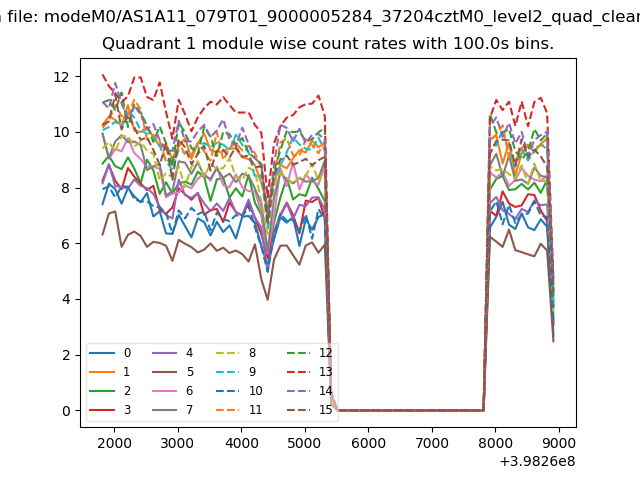
| Module-wise count rates for Quadrant A Data is divided into 100 sec bins |
 |
 |
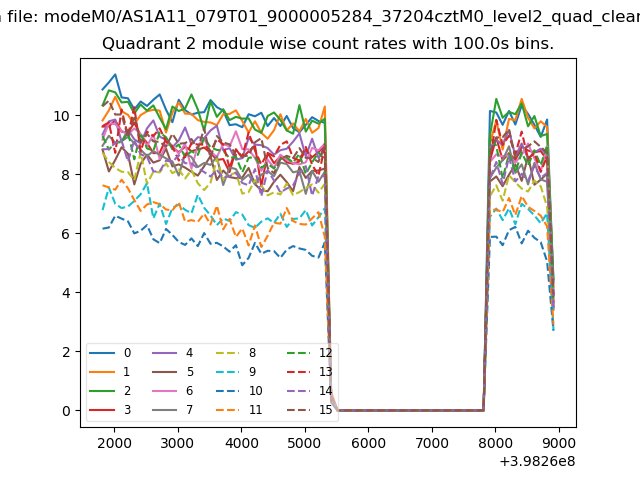
| Module-wise count rates for Quadrant B Data is divided into 100 sec bins |
 |
 |
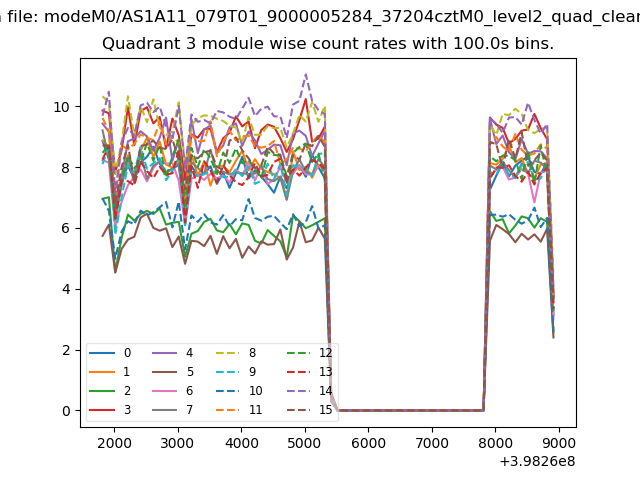
| Module-wise count rates for Quadrant C Data is divided into 100 sec bins |
 |
 |
| Module-wise count rates for Quadrant D Data is divided into 100 sec bins |
 |
 |
| Parameter | Plot |
|---|---|
| CZT HV Monitor | 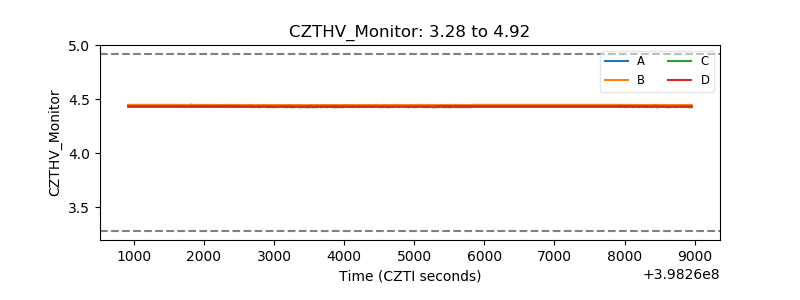 |
| D_VDD | 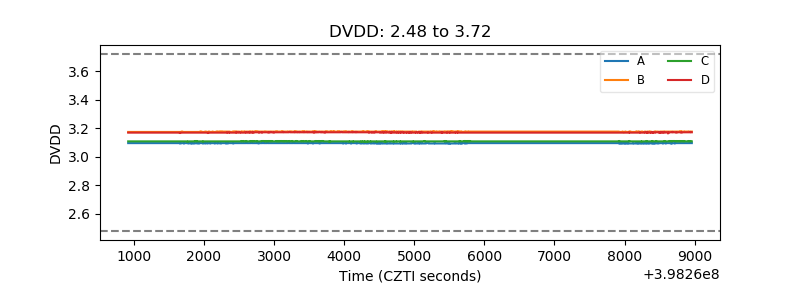 |
| Temperature 1 | 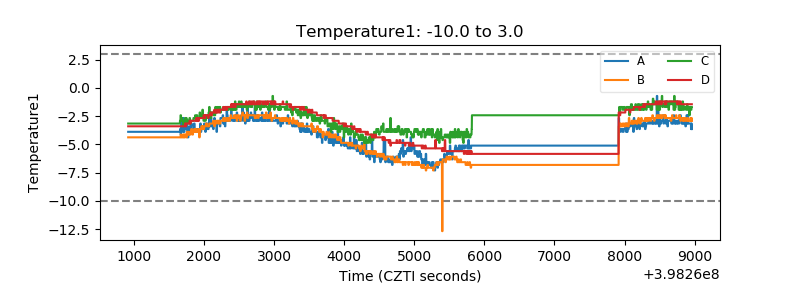 |
| Veto HV Monitor | 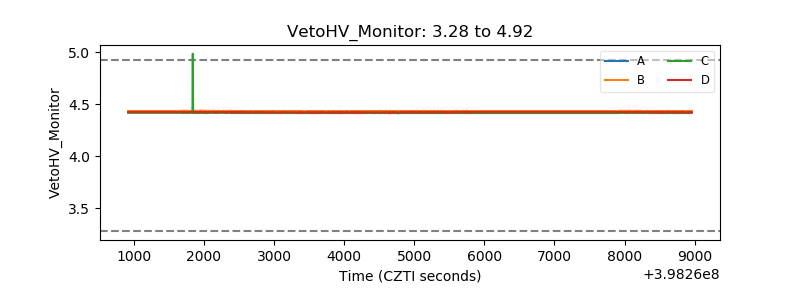 |
| Veto LLD | 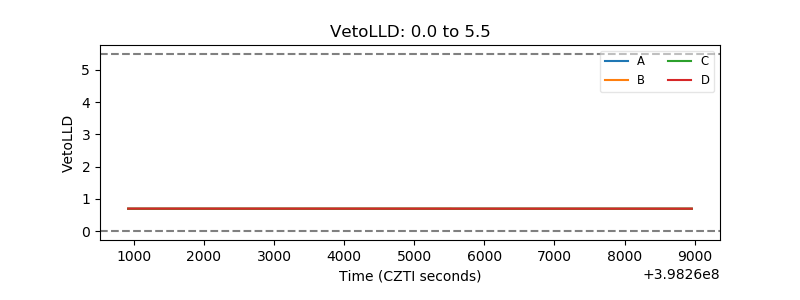 |
| Alpha Counter | 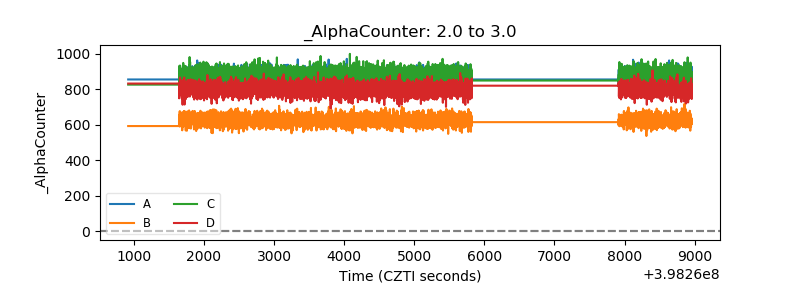 |
| _CPM_Rate | 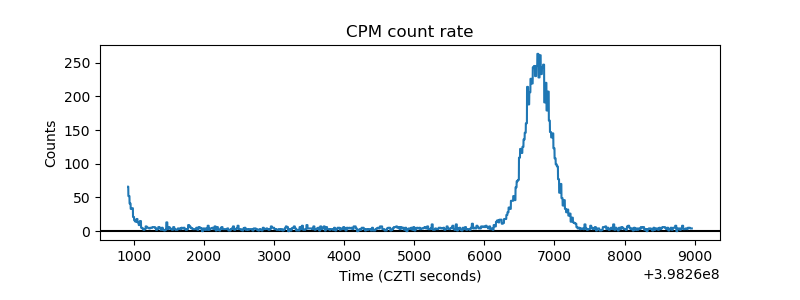 |
| CZT Counter | 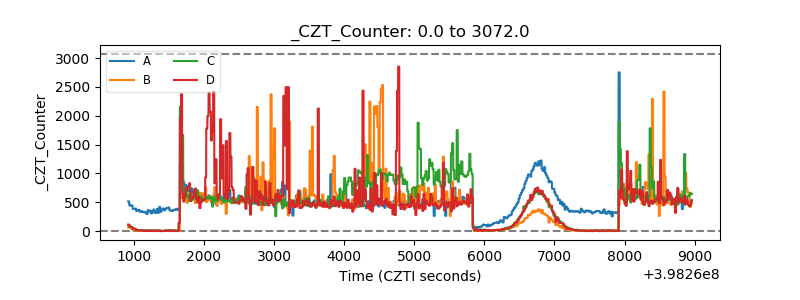 |
| +2.5 Volts monitor | 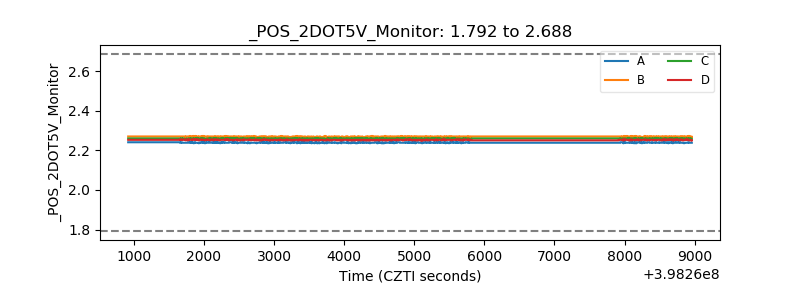 |
| +5 Volts monitor | 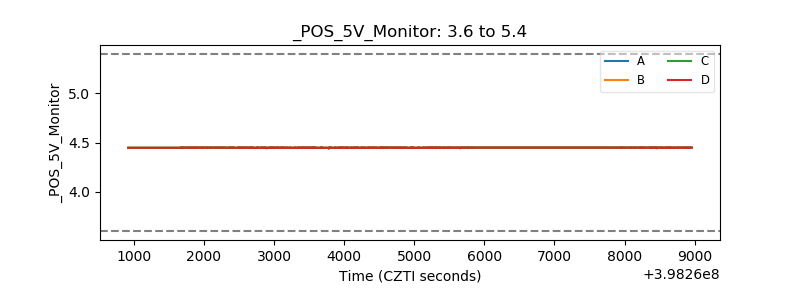 |
| _ROLL_ROT |  |
| _Roll_DEC | 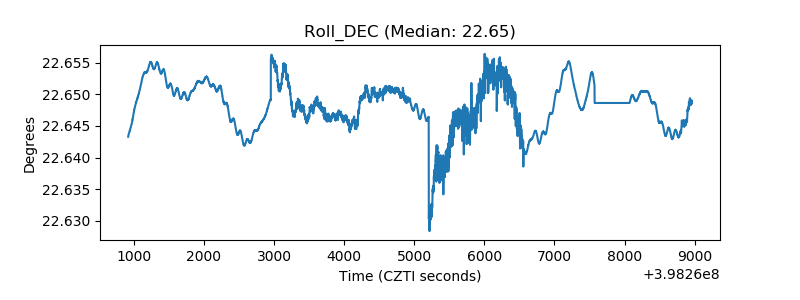 |
| _Roll_RA | 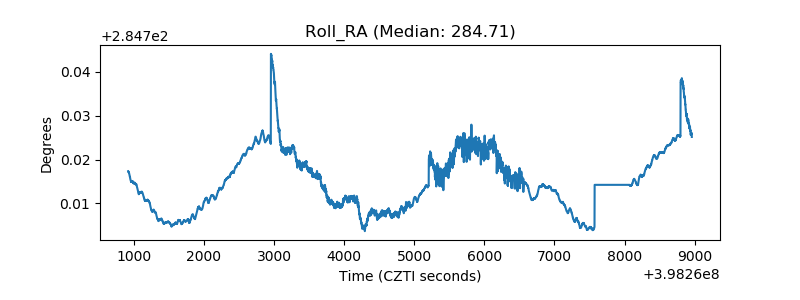 |
| Veto Counter |  |