| Param | Original file | Final file |
|---|---|---|
| Filename | modeM0/AS1A11_079T01_9000005284_37207cztM0_level2.evt | modeM0/AS1A11_079T01_9000005284_37207cztM0_level2_quad_clean.evt |
| Size (bytes) | 430,381,440 | 69,572,160 |
| Size | 410.4 MB | 66.3 MB |
| Events in quadrant A | 2,897,068 | 434,426 |
| Events in quadrant B | 3,541,634 | 429,846 |
| Events in quadrant C | 2,975,322 | 431,795 |
| Events in quadrant D | 3,230,723 | 409,817 |
| Mode M9 | |||
|---|---|---|---|
| Quadrant | BADHDUFLAG | Total packets | Discarded packets |
| A | 0 | 25 | 0 |
| B | 0 | 25 | 0 |
| C | 0 | 25 | 0 |
| D | 0 | 26 | 0 |
| Mode SS | |||
|---|---|---|---|
| Quadrant | BADHDUFLAG | Total packets | Discarded packets |
| A | 0 | 116 | 0 |
| B | 0 | 116 | 0 |
| C | 0 | 116 | 0 |
| D | 0 | 116 | 0 |
| Mode M0 | |||
|---|---|---|---|
| Quadrant | BADHDUFLAG | Total packets | Discarded packets |
| A | 0 | 12310 | 3 |
| B | 0 | 14418 | 2 |
| C | 0 | 12340 | 2 |
| D | 0 | 13484 | 2 |
| Quadrant | Total seconds | Saturated seconds | Saturation percentage |
|---|---|---|---|
| A | 5734 | 26 | 0.453436% |
| B | 5734 | 112 | 1.953261% |
| C | 5734 | 33 | 0.575514% |
| D | 5734 | 115 | 2.005581% |
Noise dominated data is calculated using 1-second bins in cleaned event files. If a bin has >2000 counts, and if more than 50% of those come from <1% of pixels, then it is considered to be noise-dominated and hence unusable.
| Quadrant | # 1 sec bins | Bins with >0 counts | Bins with >2000 counts | High rate bins dominated by noise | Noise dominated (total time) | Noise dominated (detector-on time) | Marked lightcurve |
|---|---|---|---|---|---|---|---|
| A | 7077 | 5735 | 13 | 13 | 0.18% | 0.23% | 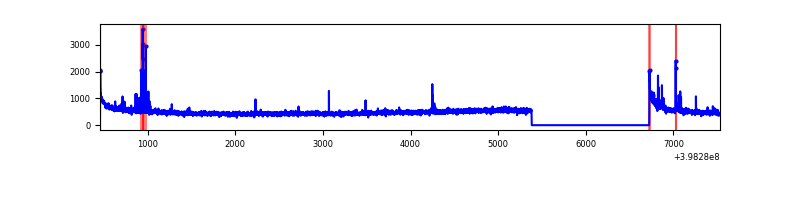 |
| B | 7077 | 5735 | 58 | 58 | 0.82% | 1.01% | 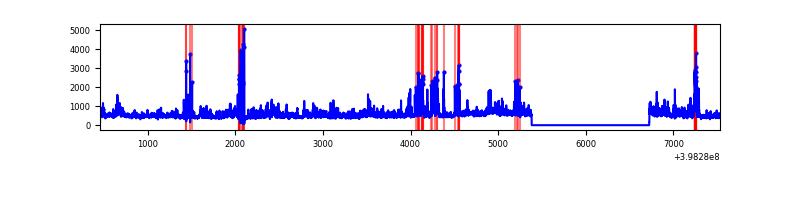 |
| C | 7077 | 5735 | 22 | 22 | 0.31% | 0.38% | 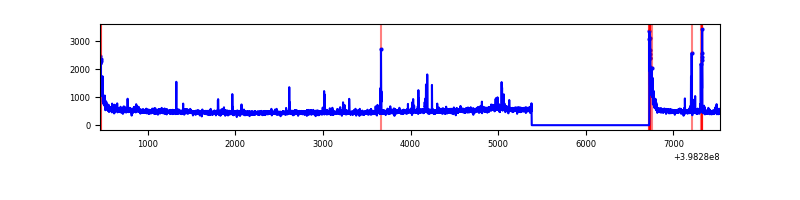 |
| D | 7077 | 5735 | 91 | 91 | 1.29% | 1.59% | 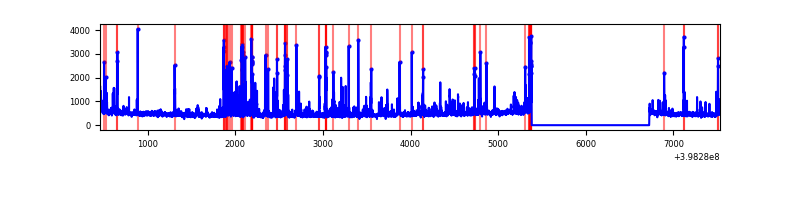 |
Top three noisy pixels from each quadrant. If the there are fewer than three noisy pixels in the level2.evt file, extra rows are filled as -1
| Pixel properties | Quadrant properties | ||||||
|---|---|---|---|---|---|---|---|
| Quadrant | DetID | PixID | Counts | Sigma | Mean | Median | Sigma |
| A | 10 | 83 | 277628 | 2089.26 | 655 | 643 | 132.6 |
| A | 13 | 248 | 38926 | 288.76 | 655 | 643 | 132.6 |
| A | 9 | 143 | 23083 | 169.26 | 655 | 643 | 132.6 |
| B | 0 | 213 | 460419 | 3681.28 | 645 | 626 | 124.9 |
| B | 5 | 172 | 406885 | 3252.66 | 645 | 626 | 124.9 |
| B | 4 | 232 | 43189 | 340.77 | 645 | 626 | 124.9 |
| C | 15 | 214 | 244797 | 1627.27 | 639 | 643 | 150.0 |
| C | 0 | 10 | 107386 | 711.43 | 639 | 643 | 150.0 |
| C | 14 | 254 | 56237 | 370.53 | 639 | 643 | 150.0 |
| D | 2 | 249 | 417316 | 2674.94 | 636 | 622 | 155.8 |
| D | 13 | 249 | 170993 | 1093.69 | 636 | 622 | 155.8 |
| D | 2 | 153 | 43069 | 272.49 | 636 | 622 | 155.8 |
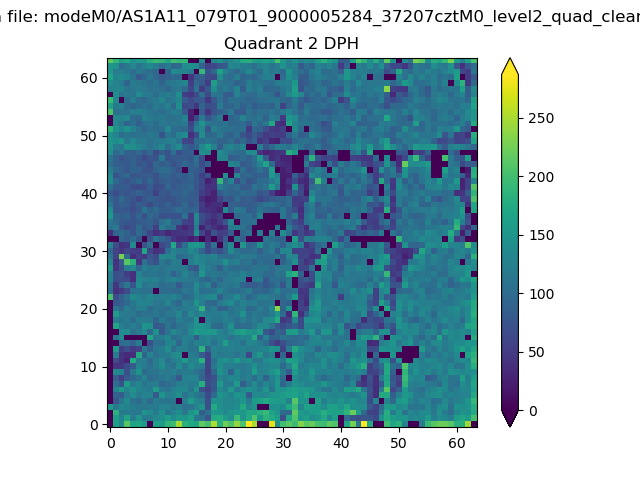
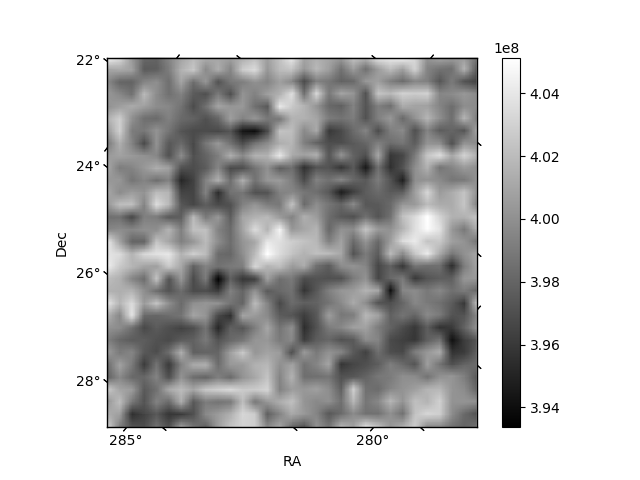
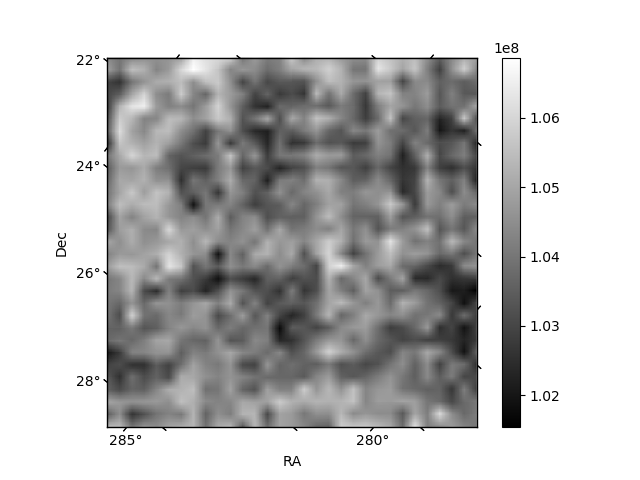
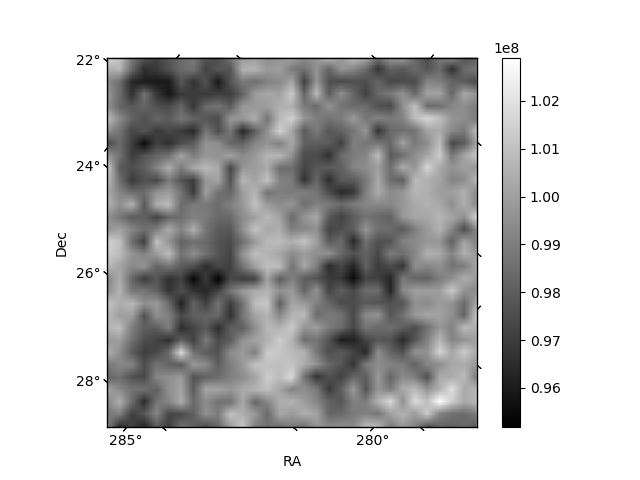
Histogram calculated using DETX and DETY for each event in the final _common_clean file
| Quadrant A | 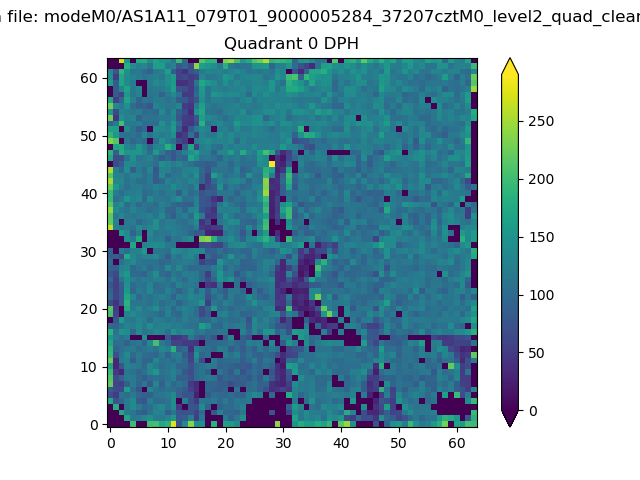 |
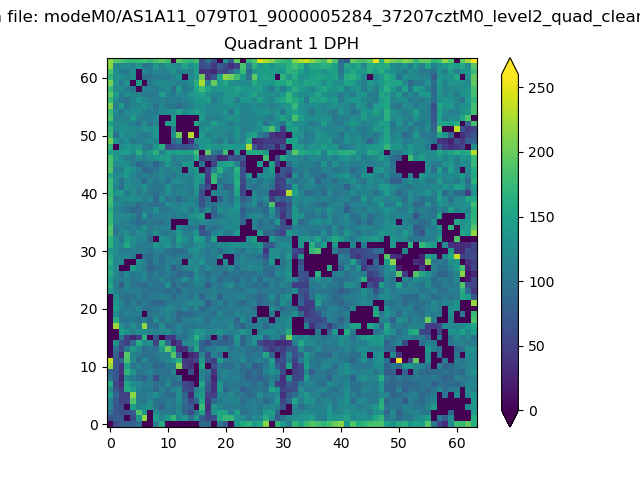 |
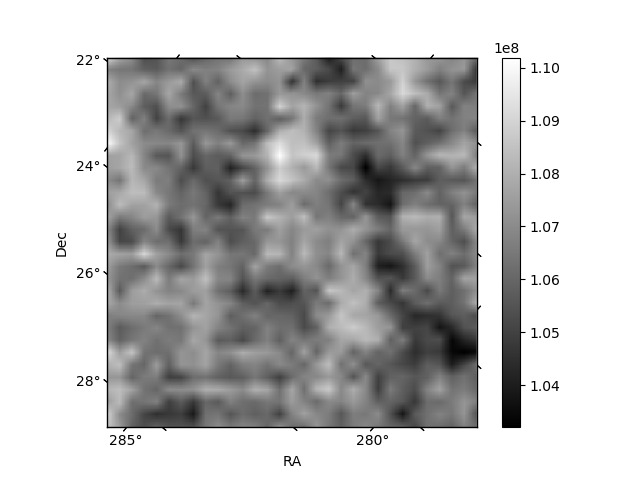
Quadrant B |
|---|---|---|---|
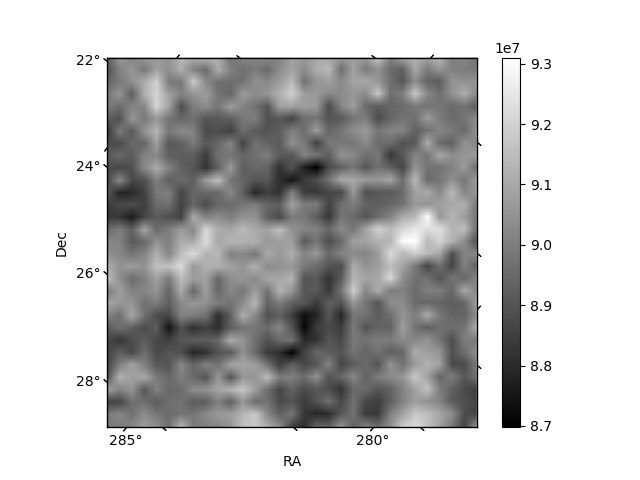
| Quadrant D | 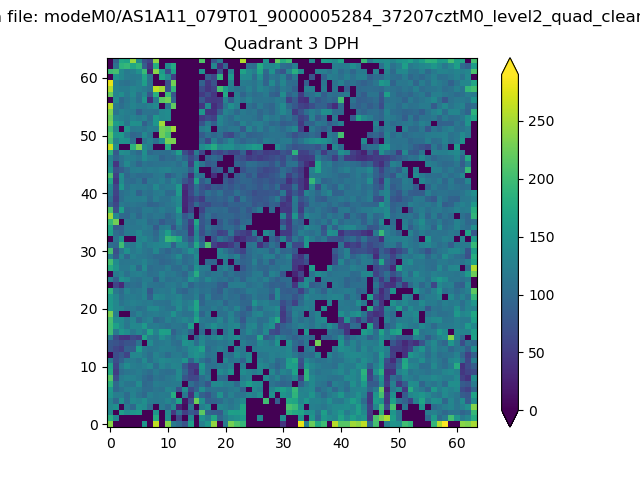 |
 |
Quadrant C |
| Plot type | Count rate plots | Images |
|---|---|---|
| Comparison with Poisson distribution Blue bars denote a histogram of data divided into 1 sec bins. Red curve is a Poisson curve with rate = median count rate of data. |
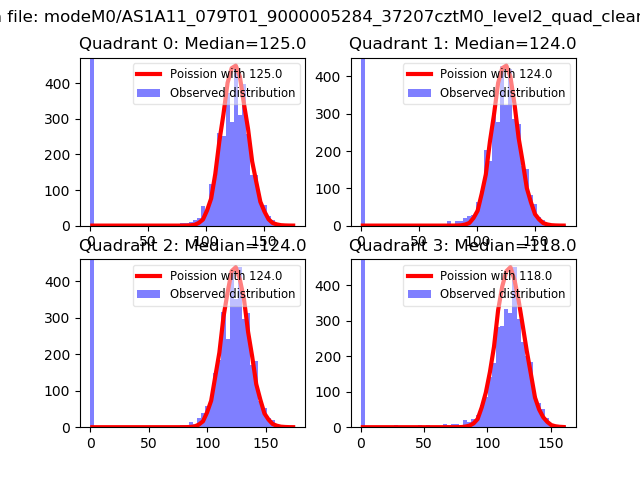 |
 |
| Quadrant-wise count rates Data is divided into 100 sec bins |
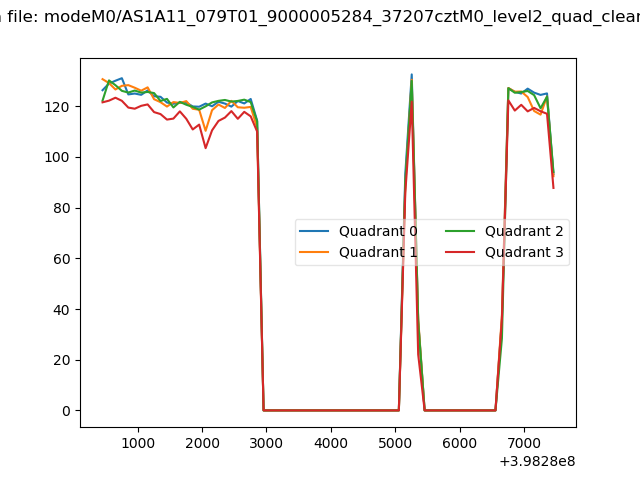 |
|
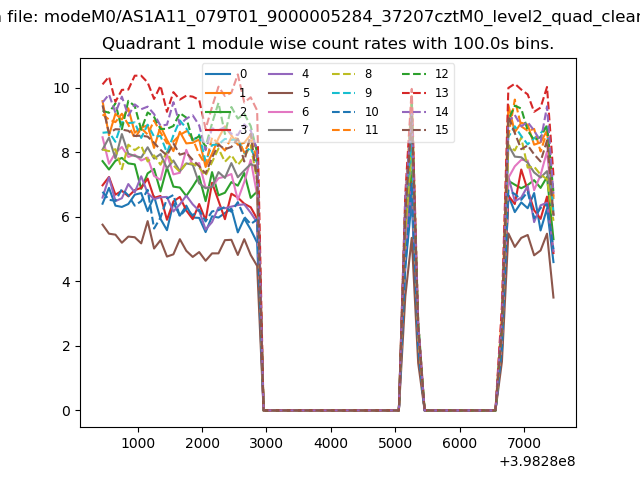
| Module-wise count rates for Quadrant A Data is divided into 100 sec bins |
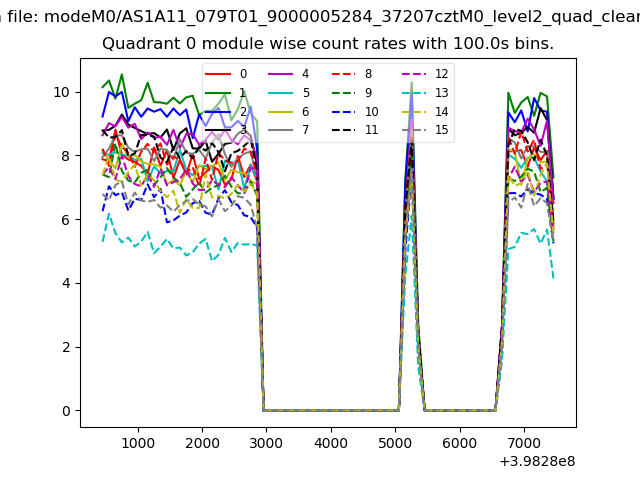 |
 |
| Module-wise count rates for Quadrant B Data is divided into 100 sec bins |
 |
 |
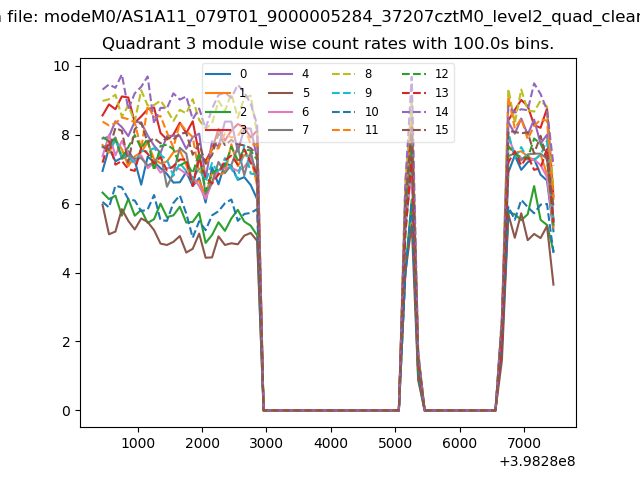
| Module-wise count rates for Quadrant C Data is divided into 100 sec bins |
 |
 |
| Module-wise count rates for Quadrant D Data is divided into 100 sec bins |
 |
 |
| Parameter | Plot |
|---|---|
| CZT HV Monitor | 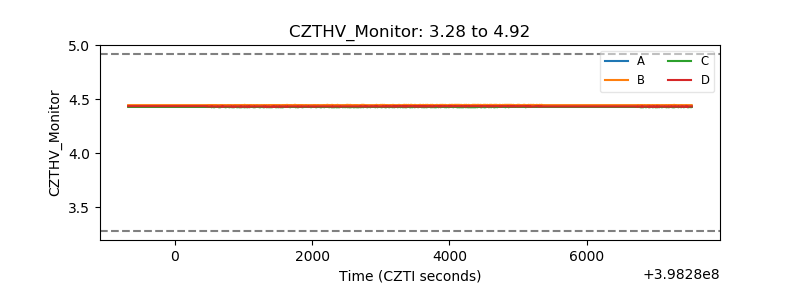 |
| D_VDD | 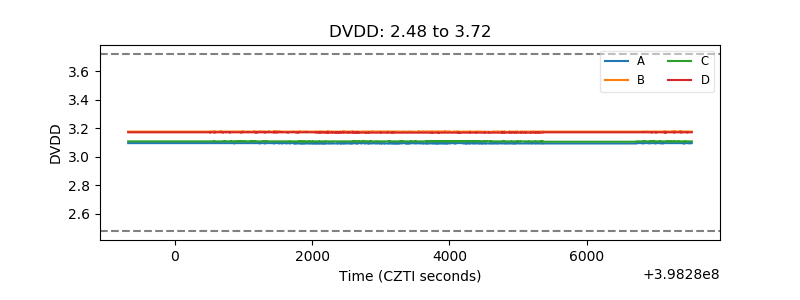 |
| Temperature 1 | 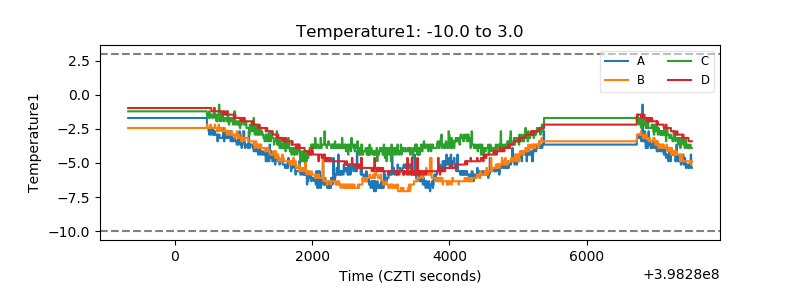 |
| Veto HV Monitor | 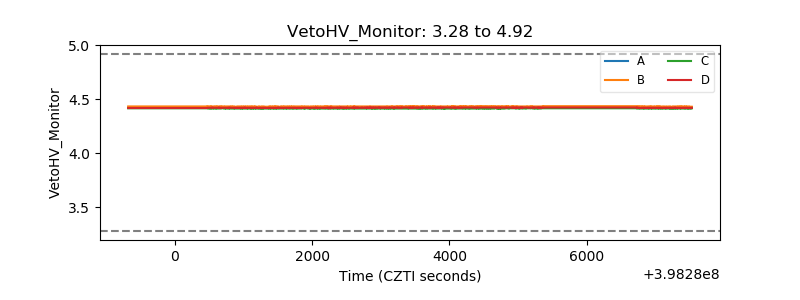 |
| Veto LLD | 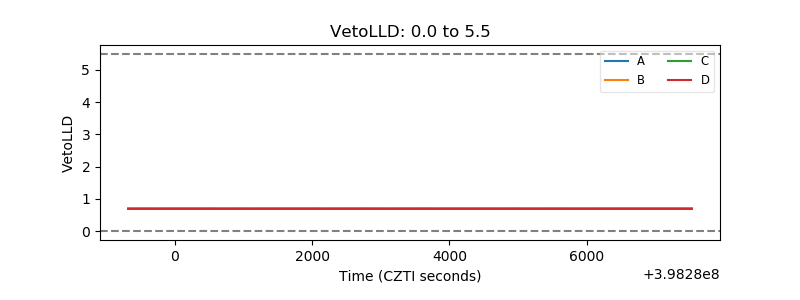 |
| Alpha Counter | 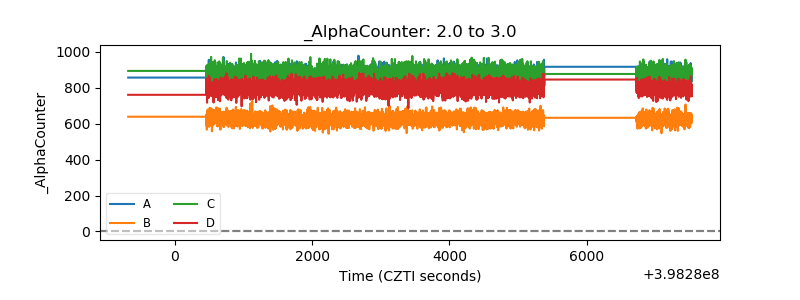 |
| _CPM_Rate | 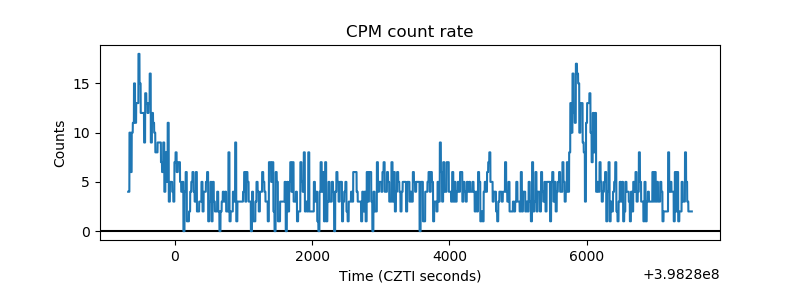 |
| CZT Counter | 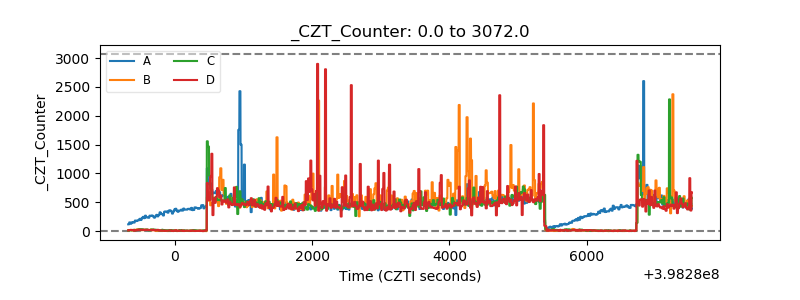 |
| +2.5 Volts monitor | 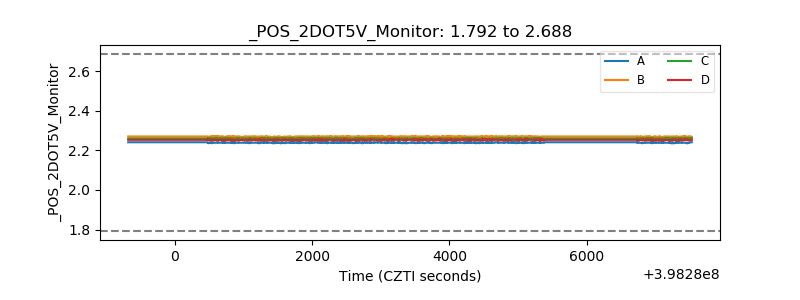 |
| +5 Volts monitor | 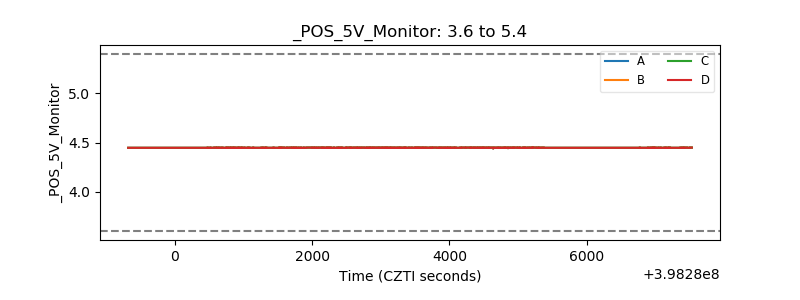 |
| _ROLL_ROT | 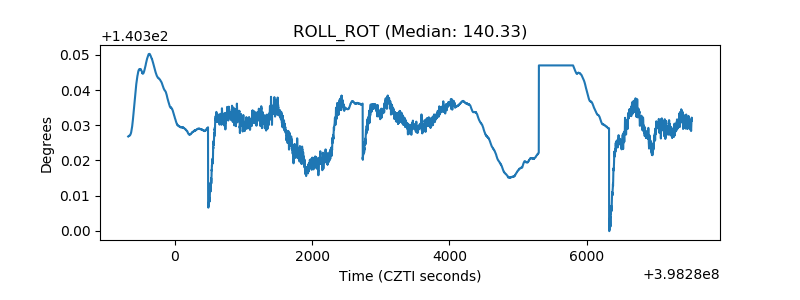 |
| _Roll_DEC | 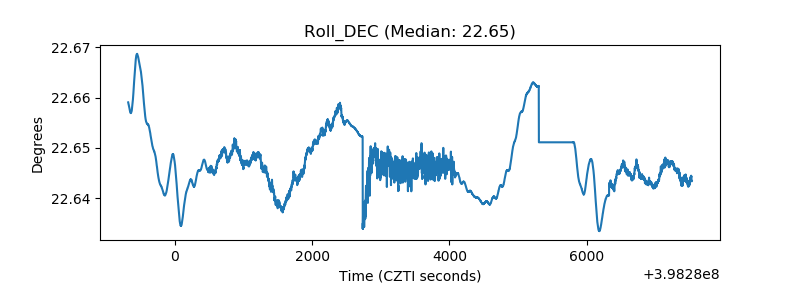 |
| _Roll_RA | 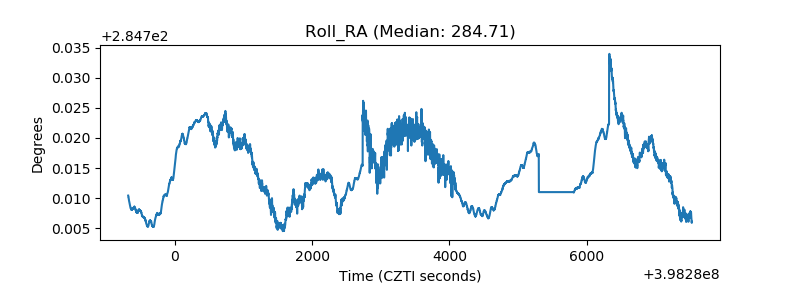 |
| Veto Counter | 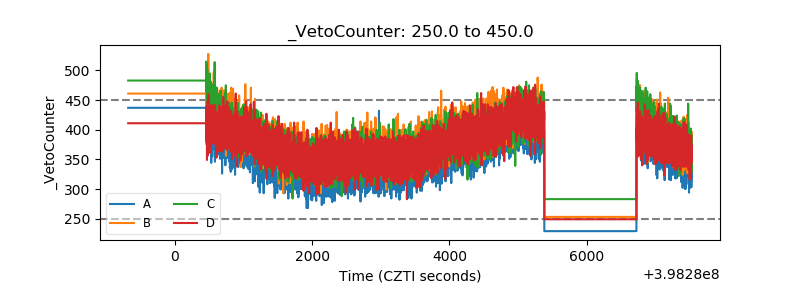 |