| Param | Original file | Final file |
|---|---|---|
| Filename | modeM0/AS1A11_079T01_9000005284_37208cztM0_level2.evt | modeM0/AS1A11_079T01_9000005284_37208cztM0_level2_quad_clean.evt |
| Size (bytes) | 457,254,720 | 72,616,320 |
| Size | 436.1 MB | 69.3 MB |
| Events in quadrant A | 3,105,809 | 449,061 |
| Events in quadrant B | 3,560,945 | 452,884 |
| Events in quadrant C | 3,032,900 | 455,335 |
| Events in quadrant D | 3,747,328 | 428,853 |
| Mode M9 | |||
|---|---|---|---|
| Quadrant | BADHDUFLAG | Total packets | Discarded packets |
| A | 0 | 22 | 0 |
| B | 0 | 22 | 0 |
| C | 0 | 22 | 0 |
| D | 0 | 23 | 0 |
| Mode SS | |||
|---|---|---|---|
| Quadrant | BADHDUFLAG | Total packets | Discarded packets |
| A | 0 | 120 | 0 |
| B | 0 | 120 | 0 |
| C | 0 | 120 | 0 |
| D | 0 | 120 | 0 |
| Mode M0 | |||
|---|---|---|---|
| Quadrant | BADHDUFLAG | Total packets | Discarded packets |
| A | 0 | 13071 | 3 |
| B | 0 | 14551 | 2 |
| C | 0 | 12686 | 2 |
| D | 0 | 15185 | 2 |
| Quadrant | Total seconds | Saturated seconds | Saturation percentage |
|---|---|---|---|
| A | 5906 | 110 | 1.862513% |
| B | 5906 | 100 | 1.693193% |
| C | 5906 | 30 | 0.507958% |
| D | 5906 | 202 | 3.420251% |
Noise dominated data is calculated using 1-second bins in cleaned event files. If a bin has >2000 counts, and if more than 50% of those come from <1% of pixels, then it is considered to be noise-dominated and hence unusable.
| Quadrant | # 1 sec bins | Bins with >0 counts | Bins with >2000 counts | High rate bins dominated by noise | Noise dominated (total time) | Noise dominated (detector-on time) | Marked lightcurve |
|---|---|---|---|---|---|---|---|
| A | 7219 | 5907 | 64 | 64 | 0.89% | 1.08% | 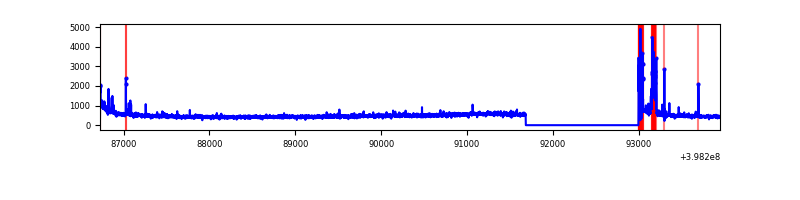 |
| B | 7219 | 5907 | 47 | 47 | 0.65% | 0.80% | 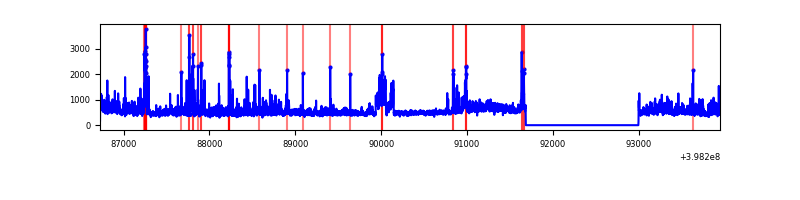 |
| C | 7219 | 5907 | 21 | 21 | 0.29% | 0.36% | 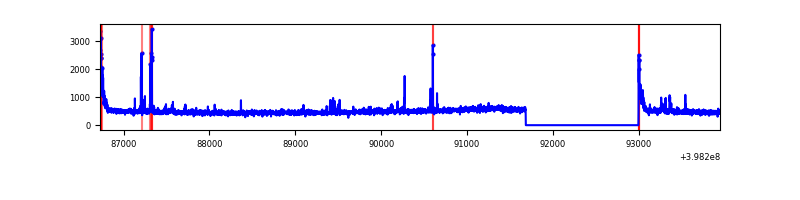 |
| D | 7219 | 5907 | 181 | 181 | 2.51% | 3.06% | 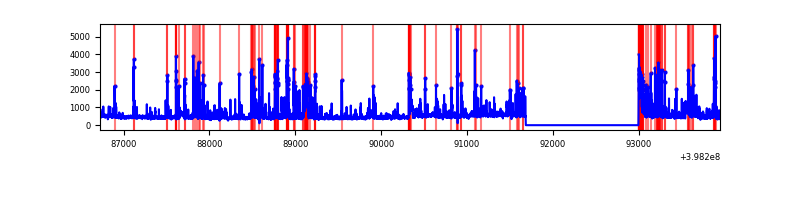 |
Top three noisy pixels from each quadrant. If the there are fewer than three noisy pixels in the level2.evt file, extra rows are filled as -1
| Pixel properties | Quadrant properties | ||||||
|---|---|---|---|---|---|---|---|
| Quadrant | DetID | PixID | Counts | Sigma | Mean | Median | Sigma |
| A | 10 | 83 | 262669 | 1943.34 | 665 | 653 | 134.8 |
| A | 15 | 237 | 217010 | 1604.69 | 665 | 653 | 134.8 |
| A | 9 | 143 | 32346 | 235.06 | 665 | 653 | 134.8 |
| B | 0 | 213 | 430131 | 3351.45 | 664 | 647 | 128.1 |
| B | 5 | 172 | 249535 | 1942.18 | 664 | 647 | 128.1 |
| B | 5 | 184 | 112028 | 869.16 | 664 | 647 | 128.1 |
| C | 15 | 214 | 252859 | 1635.84 | 658 | 663 | 154.2 |
| C | 0 | 10 | 106261 | 684.95 | 658 | 663 | 154.2 |
| C | 14 | 254 | 75026 | 482.35 | 658 | 663 | 154.2 |
| D | 2 | 249 | 560914 | 3560.53 | 648 | 632 | 157.4 |
| D | 13 | 249 | 367845 | 2333.6 | 648 | 632 | 157.4 |
| D | 12 | 233 | 142844 | 903.74 | 648 | 632 | 157.4 |
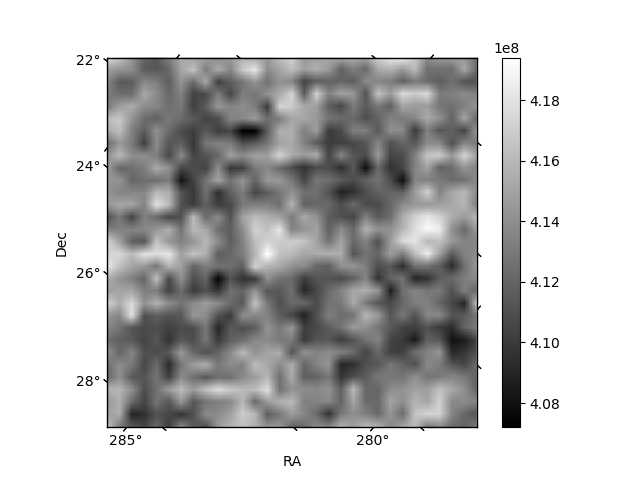
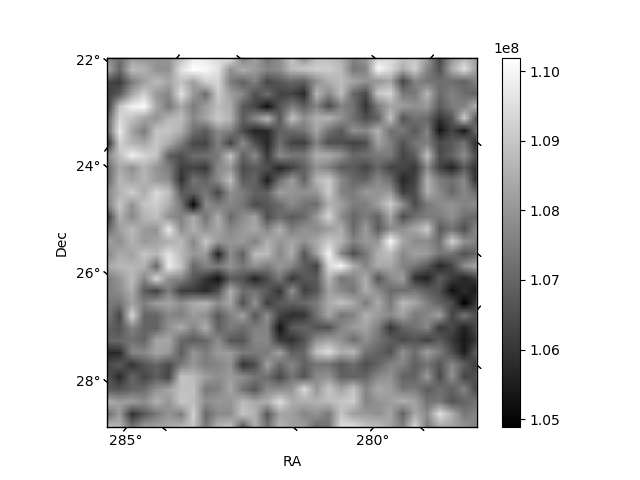
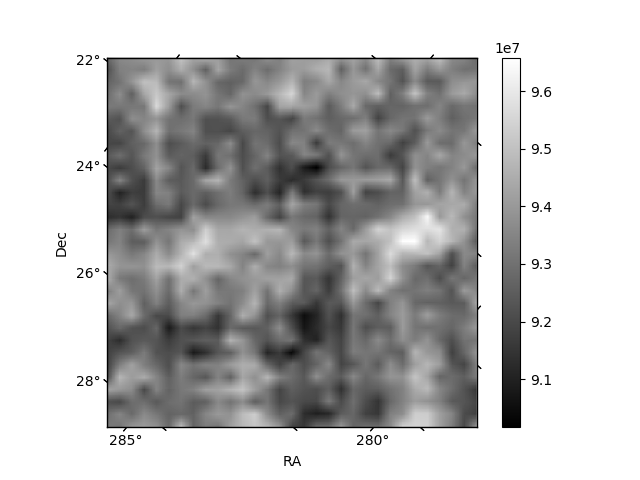
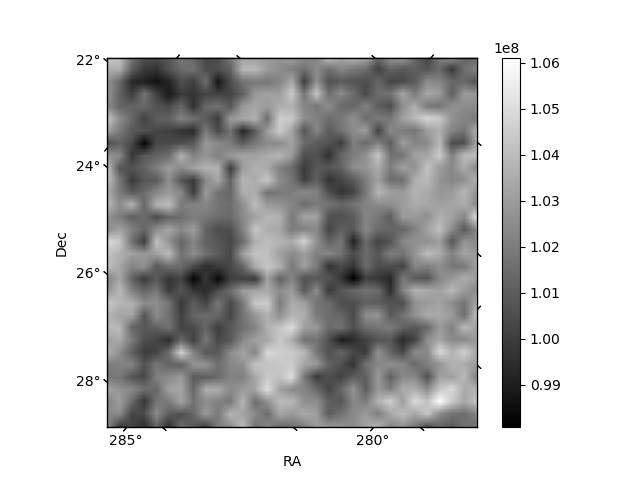
Histogram calculated using DETX and DETY for each event in the final _common_clean file
| Quadrant A | 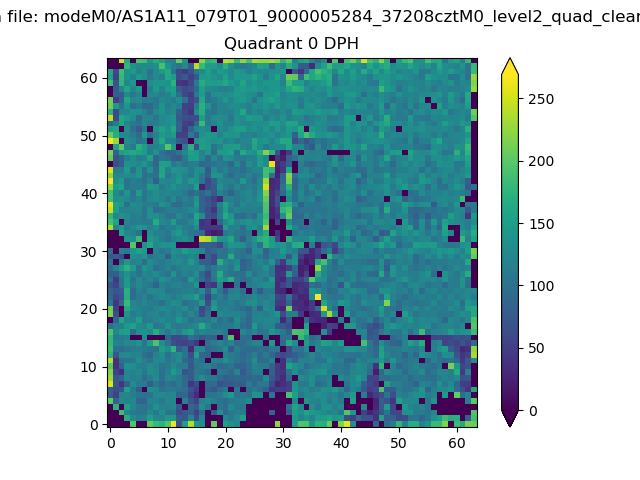 |
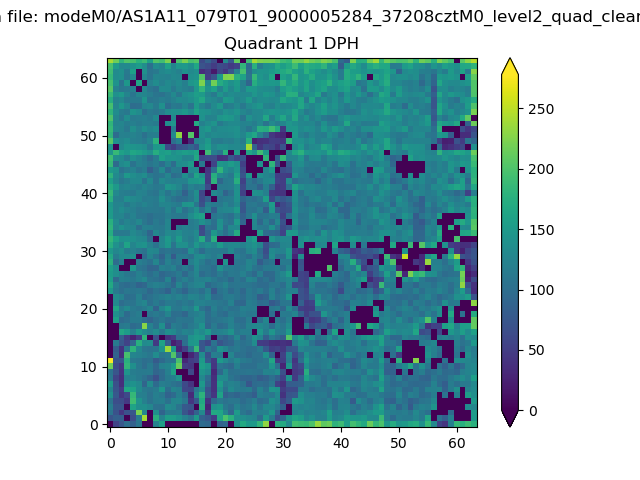 |
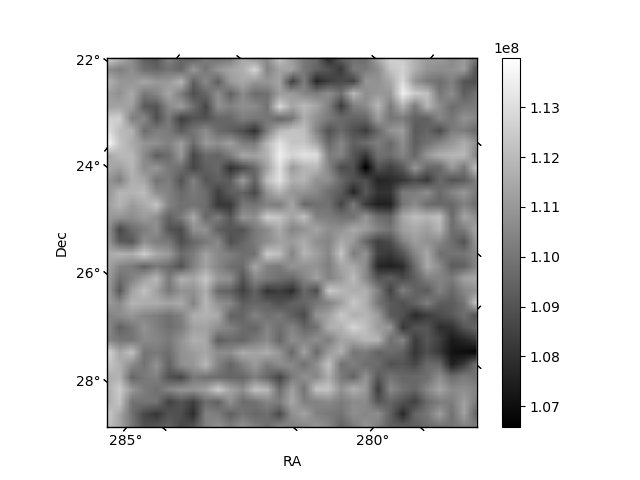
Quadrant B |
|---|---|---|---|
| Quadrant D | 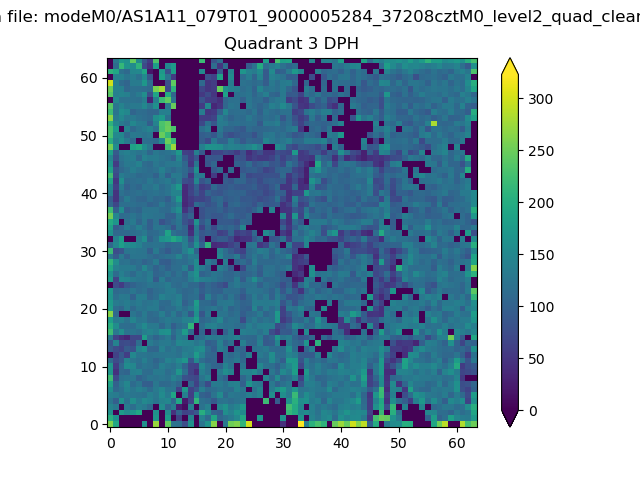 |
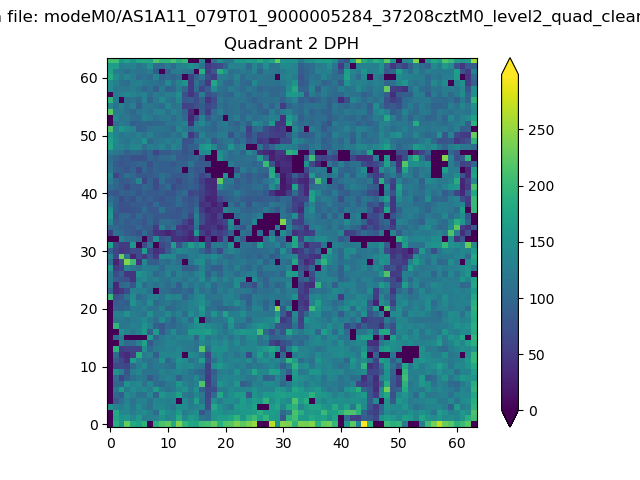 |
Quadrant C |
| Plot type | Count rate plots | Images |
|---|---|---|
| Comparison with Poisson distribution Blue bars denote a histogram of data divided into 1 sec bins. Red curve is a Poisson curve with rate = median count rate of data. |
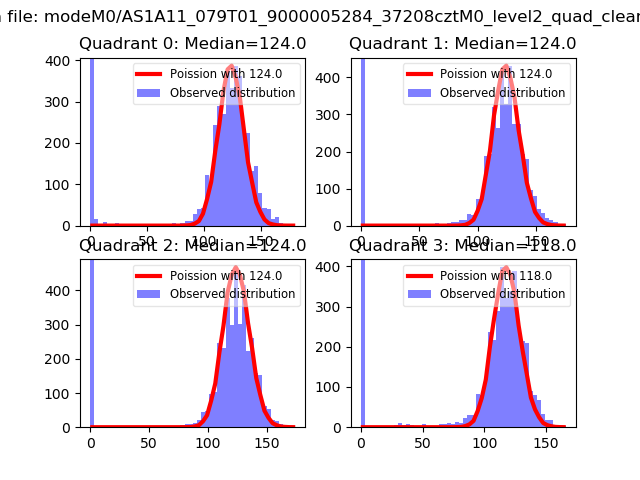 |
 |
| Quadrant-wise count rates Data is divided into 100 sec bins |
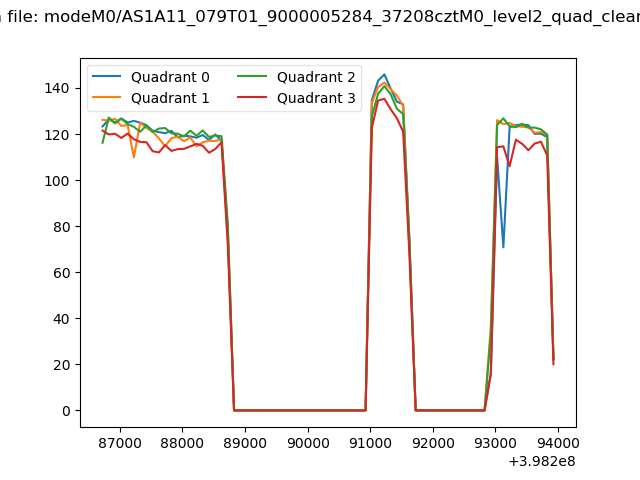 |
|
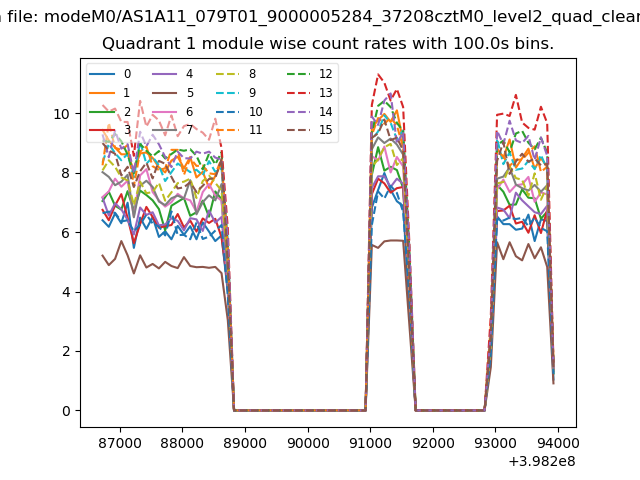
| Module-wise count rates for Quadrant A Data is divided into 100 sec bins |
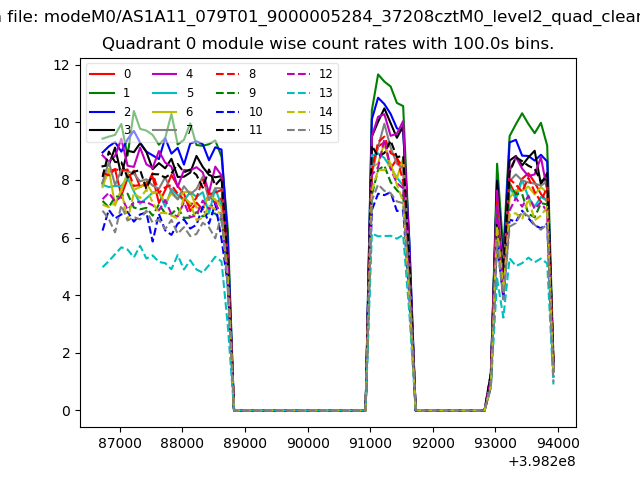 |
 |
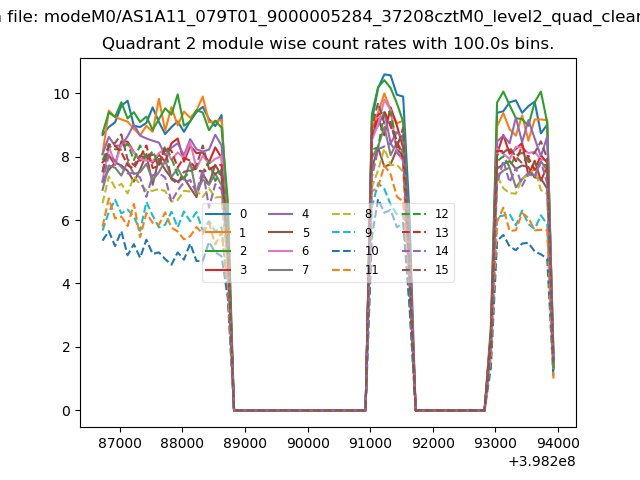
| Module-wise count rates for Quadrant B Data is divided into 100 sec bins |
 |
 |
| Module-wise count rates for Quadrant C Data is divided into 100 sec bins |
 |
 |
| Module-wise count rates for Quadrant D Data is divided into 100 sec bins |
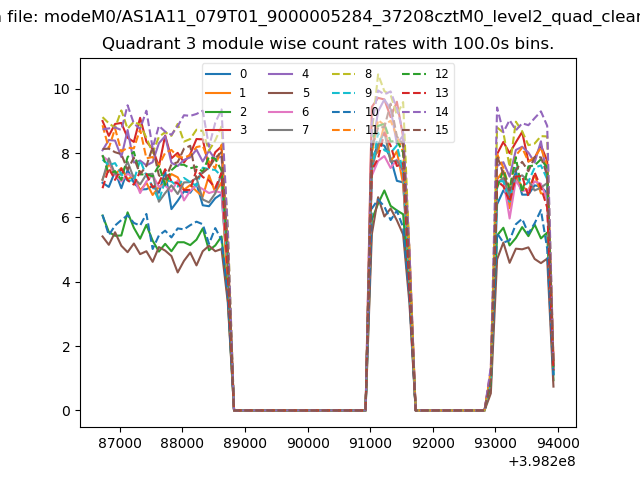 |
 |
| Parameter | Plot |
|---|---|
| CZT HV Monitor | 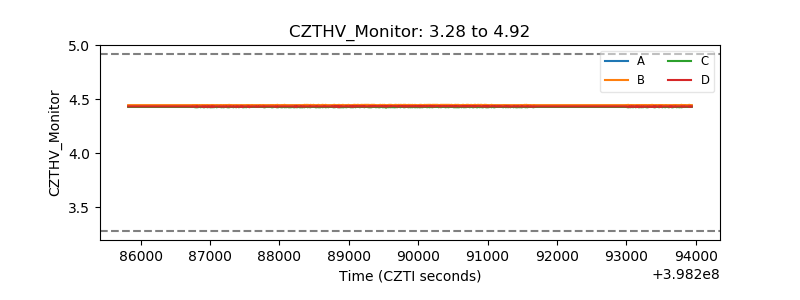 |
| D_VDD | 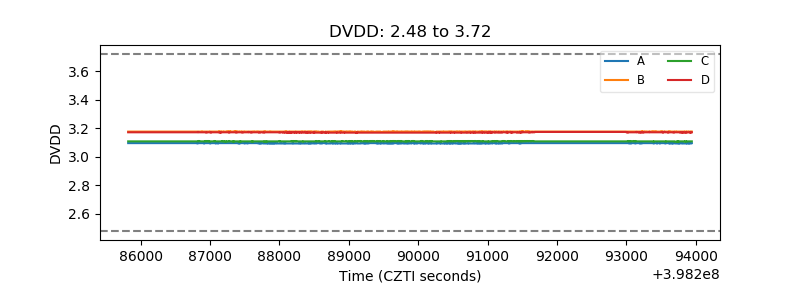 |
| Temperature 1 | 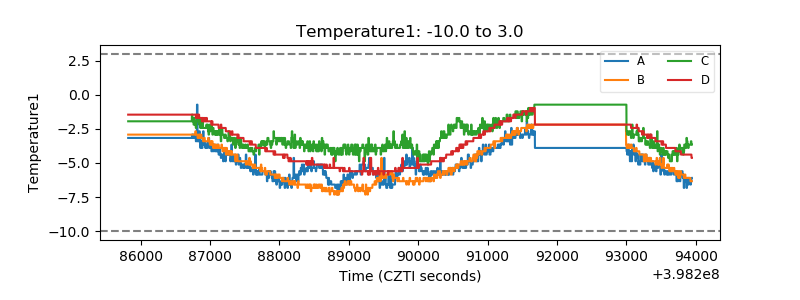 |
| Veto HV Monitor | 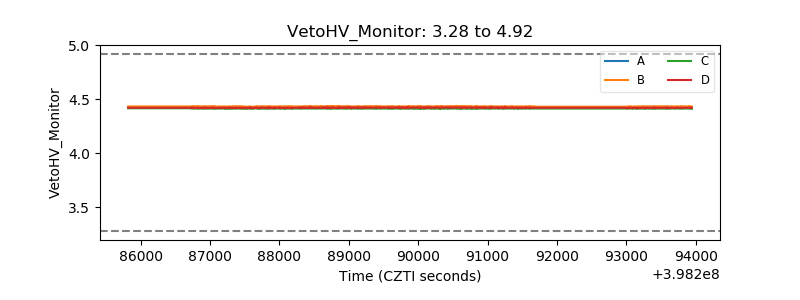 |
| Veto LLD | 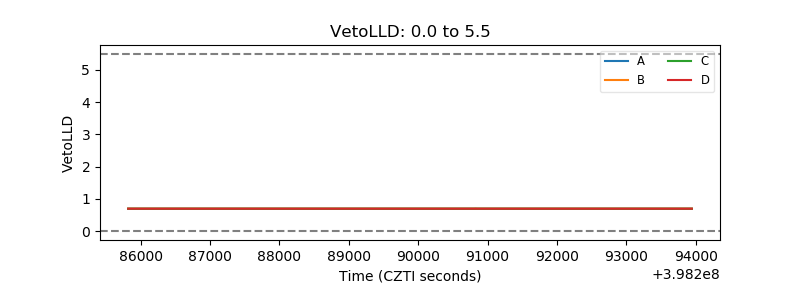 |
| Alpha Counter | 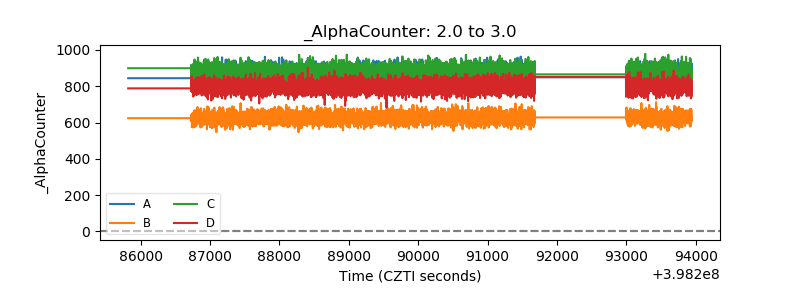 |
| _CPM_Rate | 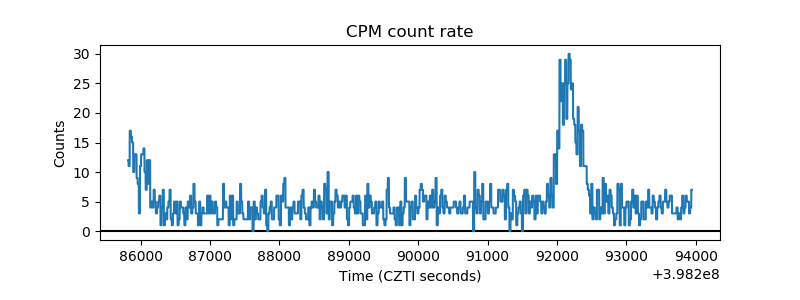 |
| CZT Counter | 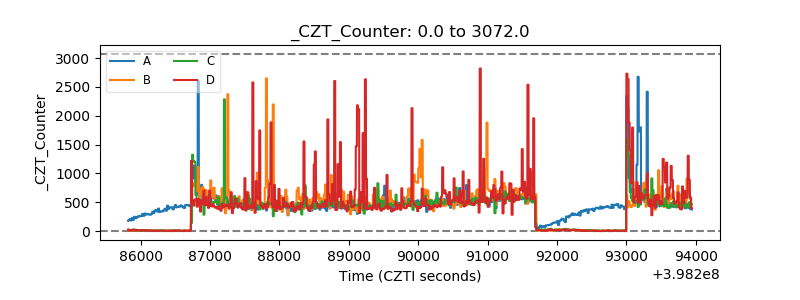 |
| +2.5 Volts monitor | 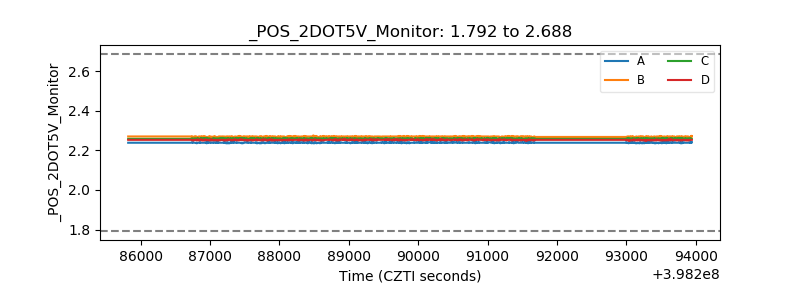 |
| +5 Volts monitor | 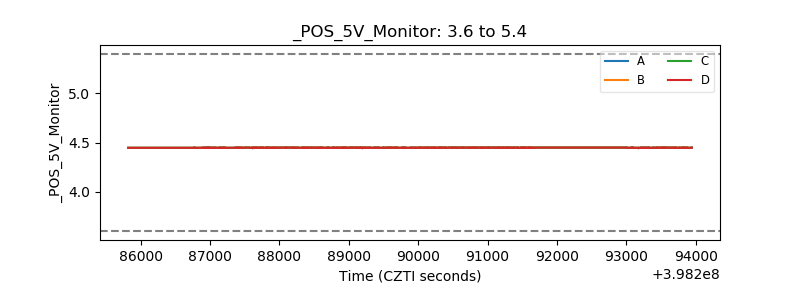 |
| _ROLL_ROT | 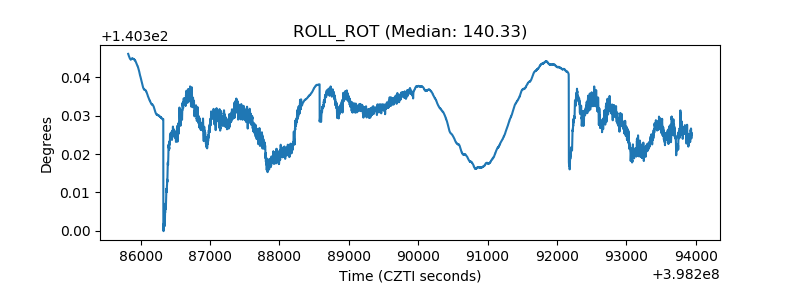 |
| _Roll_DEC | 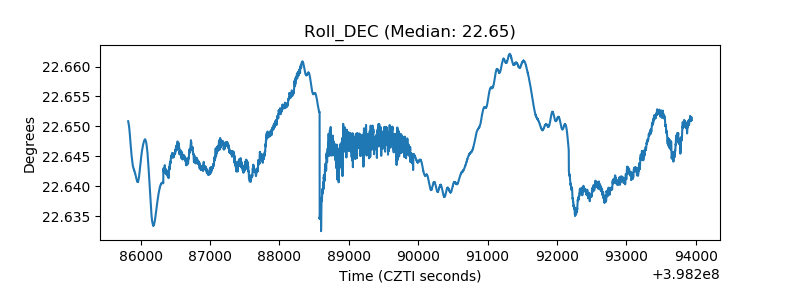 |
| _Roll_RA | 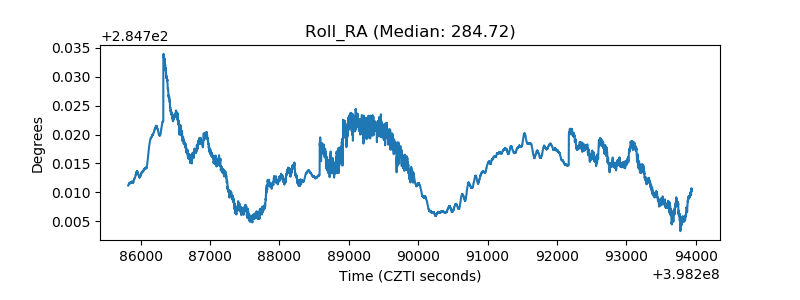 |
| Veto Counter | 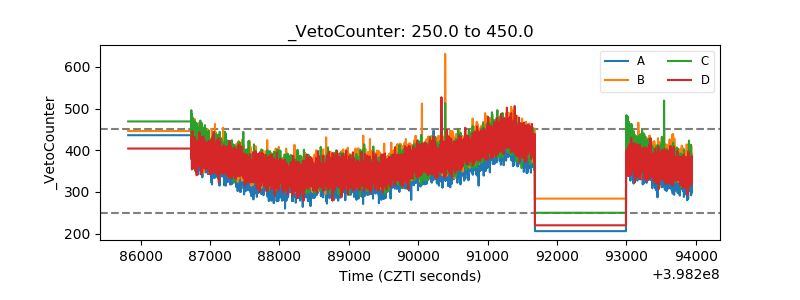 |