| Param | Original file | Final file |
|---|---|---|
| Filename | modeM0/AS1A11_079T01_9000005284_37210cztM0_level2.evt | modeM0/AS1A11_079T01_9000005284_37210cztM0_level2_quad_clean.evt |
| Size (bytes) | 841,000,320 | 130,890,240 |
| Size | 802.0 MB | 124.8 MB |
| Events in quadrant A | 5,710,451 | 804,635 |
| Events in quadrant B | 6,350,336 | 815,598 |
| Events in quadrant C | 5,824,722 | 813,010 |
| Events in quadrant D | 6,834,200 | 763,184 |
| Mode M9 | |||
|---|---|---|---|
| Quadrant | BADHDUFLAG | Total packets | Discarded packets |
| A | 0 | 42 | 0 |
| B | 0 | 42 | 0 |
| C | 0 | 42 | 0 |
| D | 0 | 42 | 0 |
| Mode SS | |||
|---|---|---|---|
| Quadrant | BADHDUFLAG | Total packets | Discarded packets |
| A | 0 | 228 | 0 |
| B | 0 | 228 | 0 |
| C | 0 | 228 | 0 |
| D | 0 | 228 | 0 |
| Mode M0 | |||
|---|---|---|---|
| Quadrant | BADHDUFLAG | Total packets | Discarded packets |
| A | 0 | 24128 | 4 |
| B | 0 | 26155 | 3 |
| C | 0 | 24296 | 3 |
| D | 0 | 28060 | 3 |
| Quadrant | Total seconds | Saturated seconds | Saturation percentage |
|---|---|---|---|
| A | 11088 | 132 | 1.190476% |
| B | 11088 | 157 | 1.415945% |
| C | 11088 | 38 | 0.342713% |
| D | 11088 | 403 | 3.634560% |
Noise dominated data is calculated using 1-second bins in cleaned event files. If a bin has >2000 counts, and if more than 50% of those come from <1% of pixels, then it is considered to be noise-dominated and hence unusable.
| Quadrant | # 1 sec bins | Bins with >0 counts | Bins with >2000 counts | High rate bins dominated by noise | Noise dominated (total time) | Noise dominated (detector-on time) | Marked lightcurve |
|---|---|---|---|---|---|---|---|
| A | 15235 | 11091 | 78 | 78 | 0.51% | 0.70% | 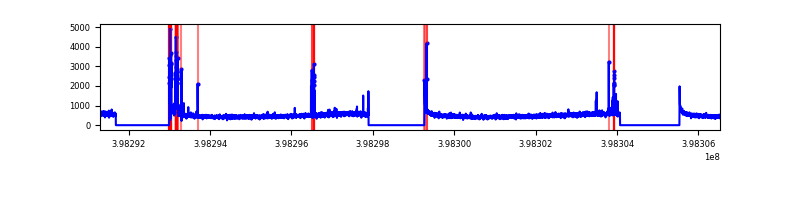 |
| B | 15235 | 11091 | 85 | 85 | 0.56% | 0.77% | 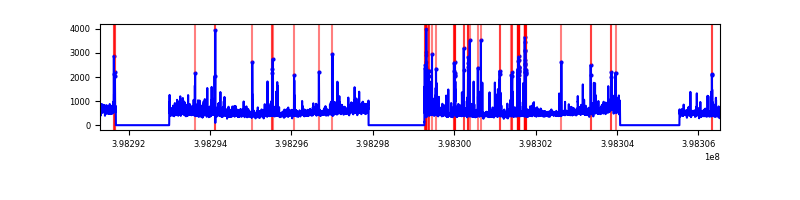 |
| C | 15235 | 11091 | 27 | 27 | 0.18% | 0.24% | 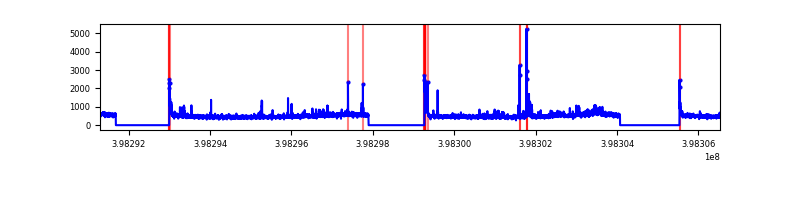 |
| D | 15235 | 11091 | 306 | 306 | 2.01% | 2.76% | 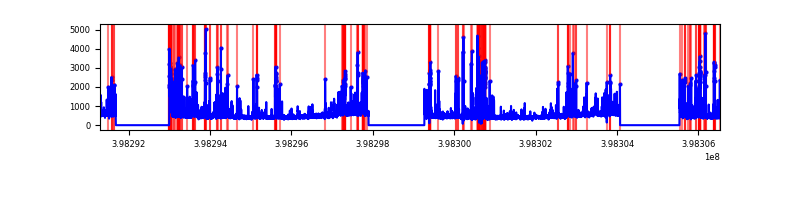 |
Top three noisy pixels from each quadrant. If the there are fewer than three noisy pixels in the level2.evt file, extra rows are filled as -1
| Pixel properties | Quadrant properties | ||||||
|---|---|---|---|---|---|---|---|
| Quadrant | DetID | PixID | Counts | Sigma | Mean | Median | Sigma |
| A | 10 | 83 | 452619 | 1747.4 | 1274 | 1250 | 258.3 |
| A | 15 | 237 | 251750 | 969.77 | 1274 | 1250 | 258.3 |
| A | 9 | 143 | 45772 | 172.36 | 1274 | 1250 | 258.3 |
| B | 0 | 213 | 629594 | 2588.97 | 1266 | 1232 | 242.7 |
| B | 5 | 172 | 405266 | 1664.7 | 1266 | 1232 | 242.7 |
| B | 0 | 190 | 138976 | 567.53 | 1266 | 1232 | 242.7 |
| C | 15 | 214 | 471014 | 1607.05 | 1250 | 1261 | 292.3 |
| C | 0 | 207 | 209764 | 713.3 | 1250 | 1261 | 292.3 |
| C | 0 | 10 | 143643 | 487.1 | 1250 | 1261 | 292.3 |
| D | 2 | 249 | 875408 | 2901.3 | 1231 | 1201 | 301.3 |
| D | 13 | 249 | 526134 | 1742.14 | 1231 | 1201 | 301.3 |
| D | 12 | 233 | 319063 | 1054.91 | 1231 | 1201 | 301.3 |
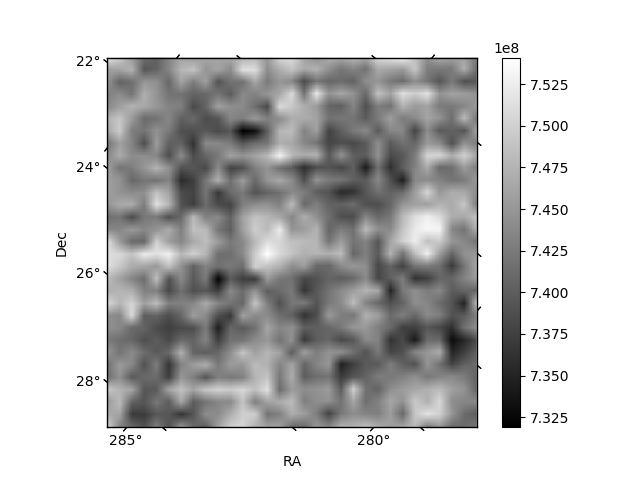
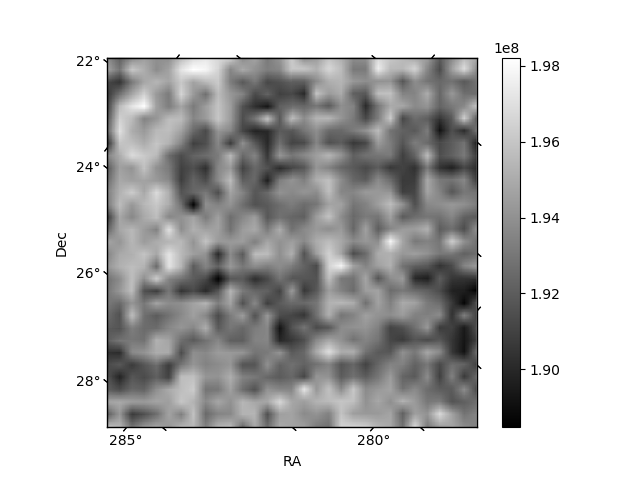
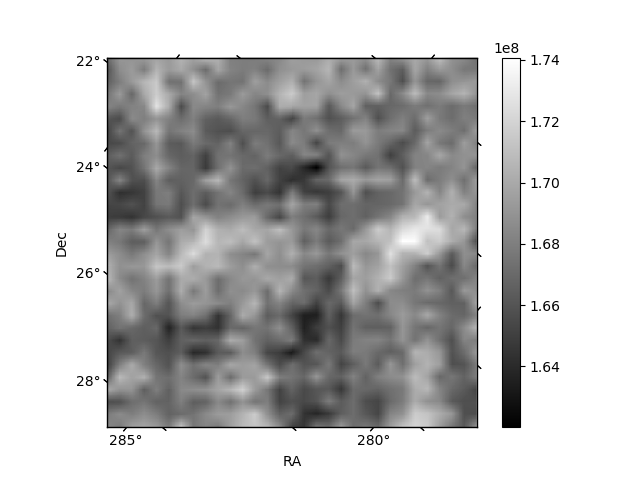
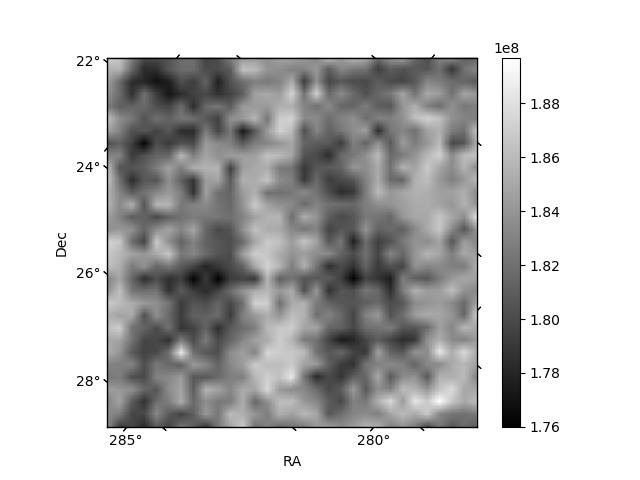
Histogram calculated using DETX and DETY for each event in the final _common_clean file
| Quadrant A | 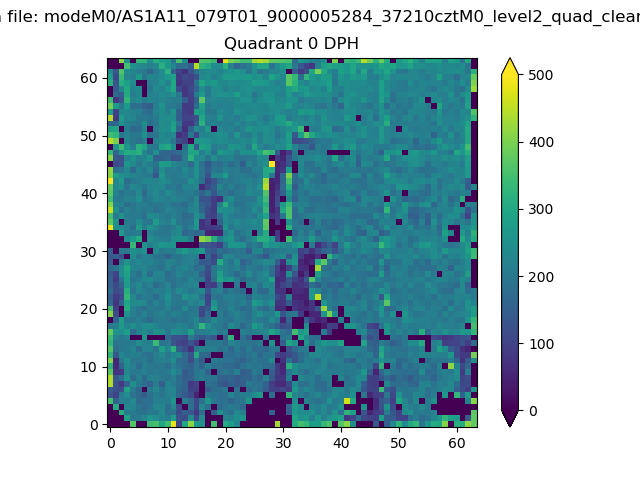 |
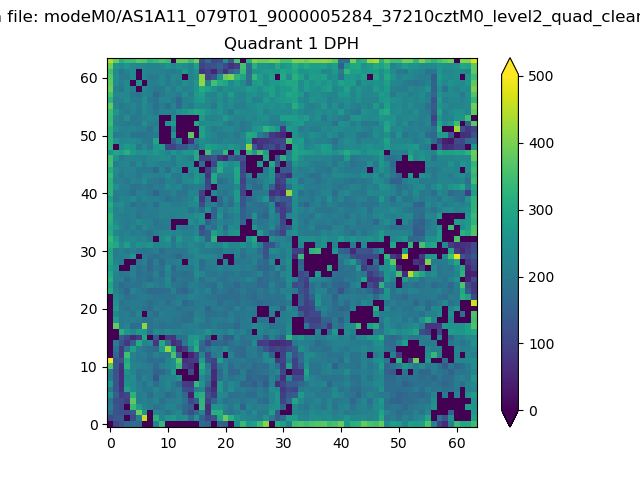 |
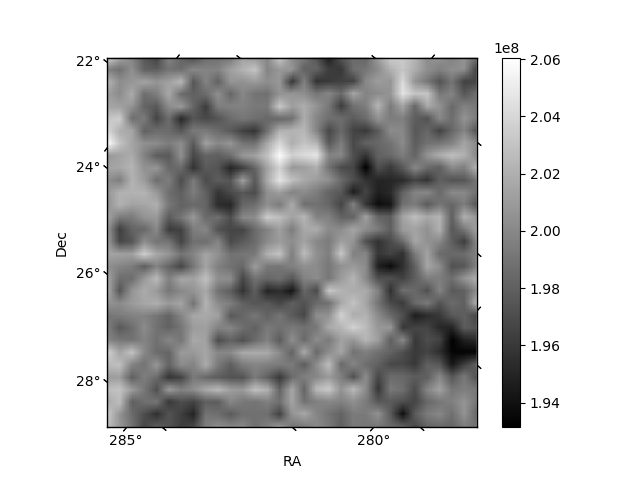
Quadrant B |
|---|---|---|---|
| Quadrant D | 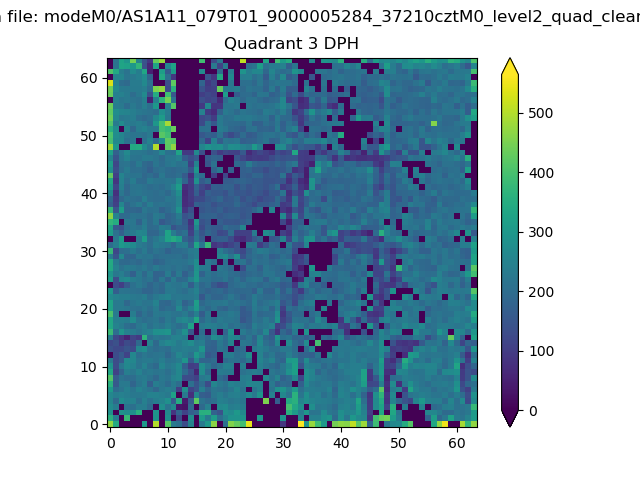 |
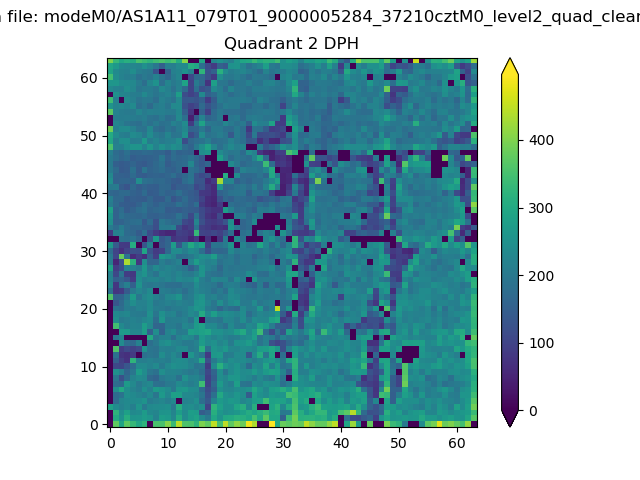 |
Quadrant C |
| Plot type | Count rate plots | Images |
|---|---|---|
| Comparison with Poisson distribution Blue bars denote a histogram of data divided into 1 sec bins. Red curve is a Poisson curve with rate = median count rate of data. |
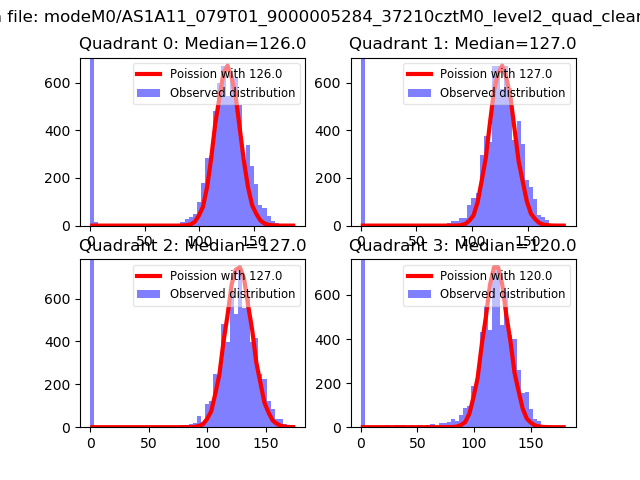 |
 |
| Quadrant-wise count rates Data is divided into 100 sec bins |
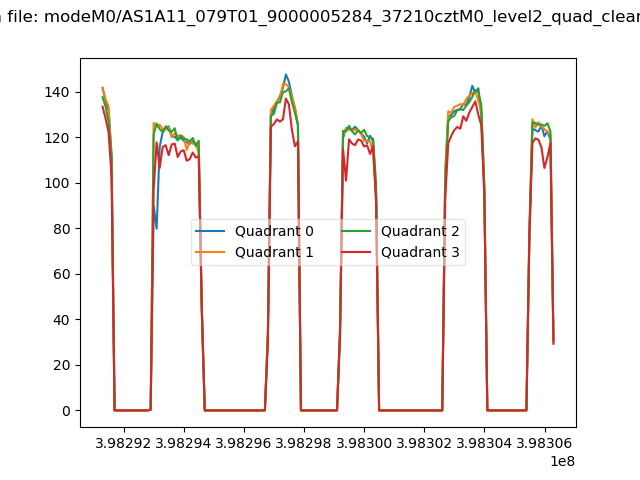 |
|
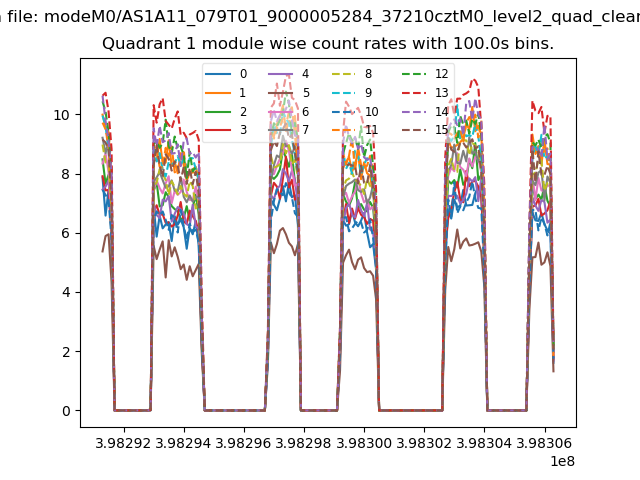
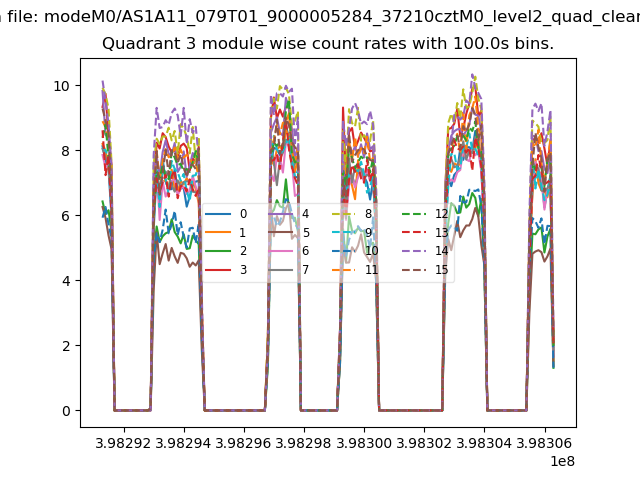
| Module-wise count rates for Quadrant A Data is divided into 100 sec bins |
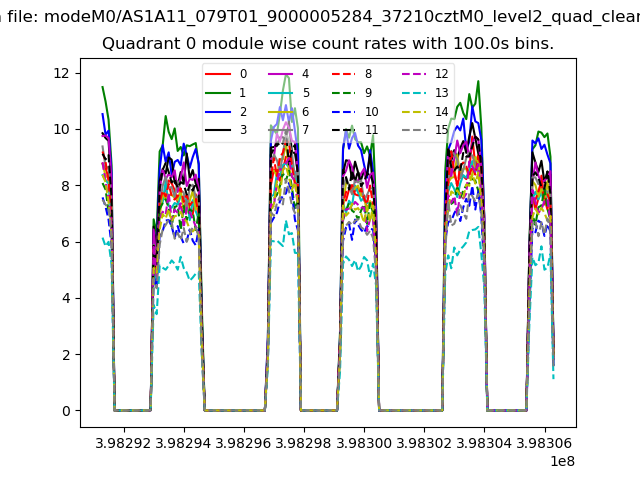 |
 |
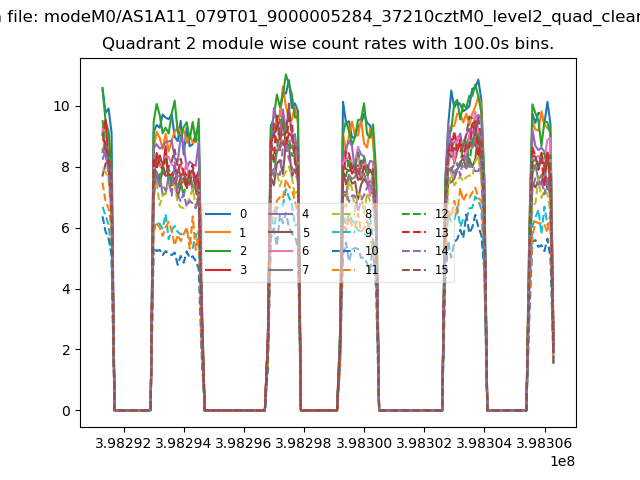
| Module-wise count rates for Quadrant B Data is divided into 100 sec bins |
 |
 |
| Module-wise count rates for Quadrant C Data is divided into 100 sec bins |
 |
 |
| Module-wise count rates for Quadrant D Data is divided into 100 sec bins |
 |
 |
| Parameter | Plot |
|---|---|
| CZT HV Monitor | 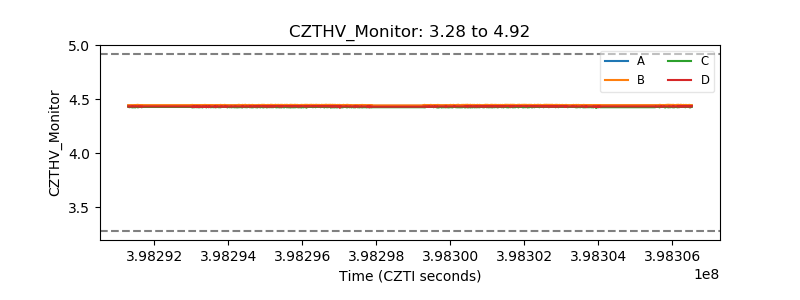 |
| D_VDD | 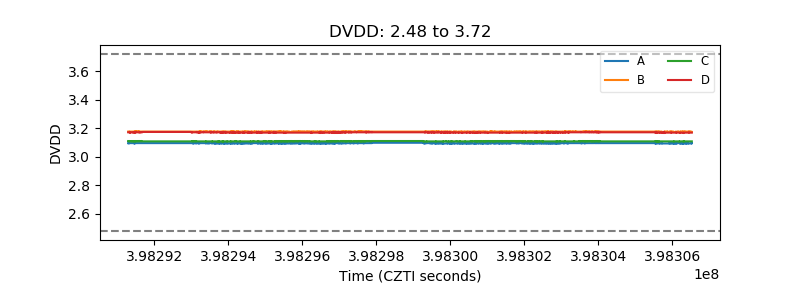 |
| Temperature 1 | 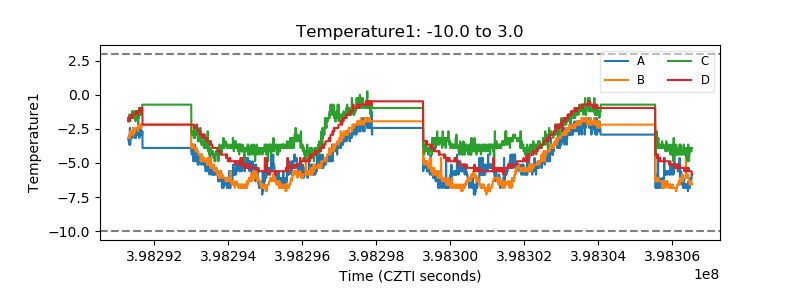 |
| Veto HV Monitor | 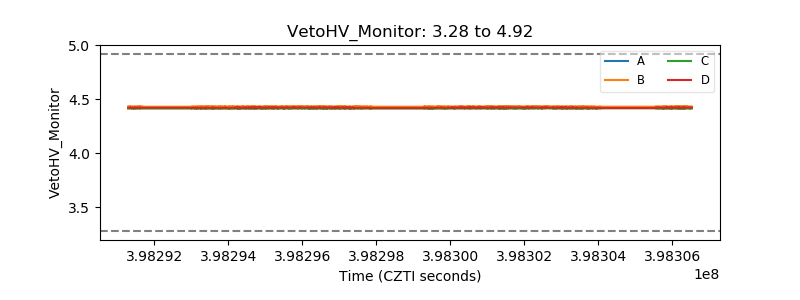 |
| Veto LLD | 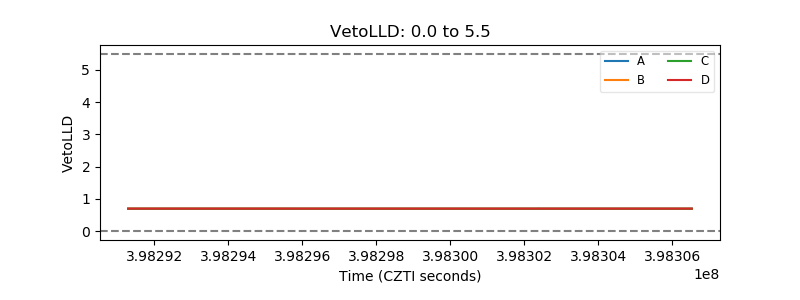 |
| Alpha Counter | 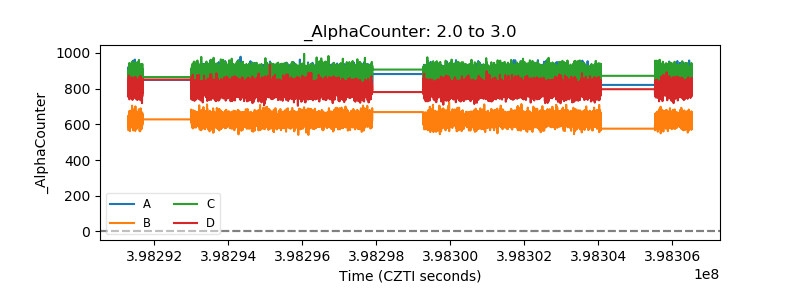 |
| _CPM_Rate | 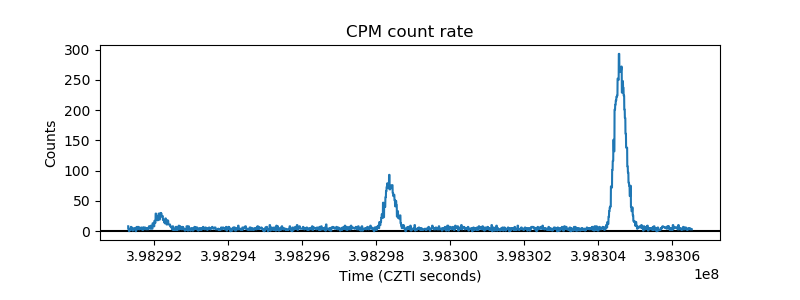 |
| CZT Counter | 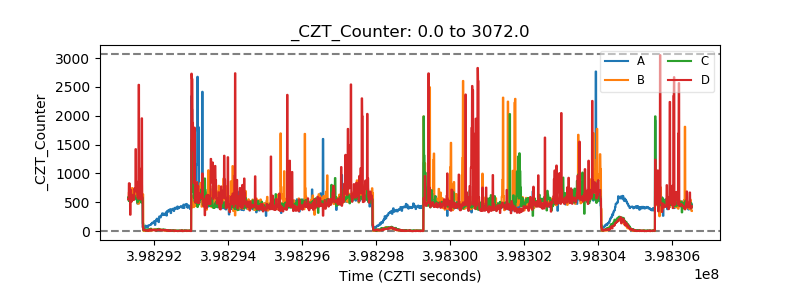 |
| +2.5 Volts monitor | 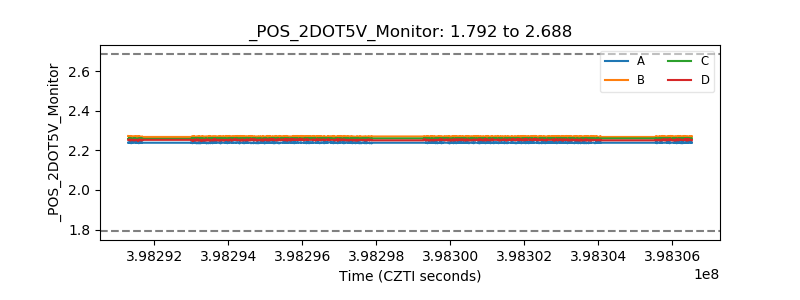 |
| +5 Volts monitor | 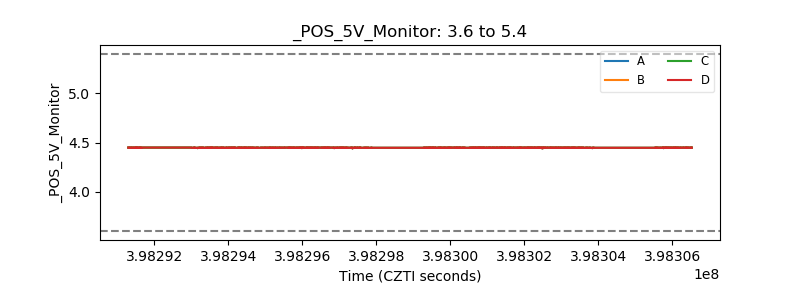 |
| _ROLL_ROT | 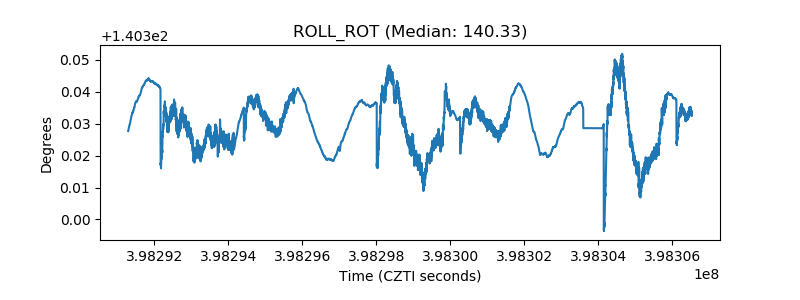 |
| _Roll_DEC |  |
| _Roll_RA | 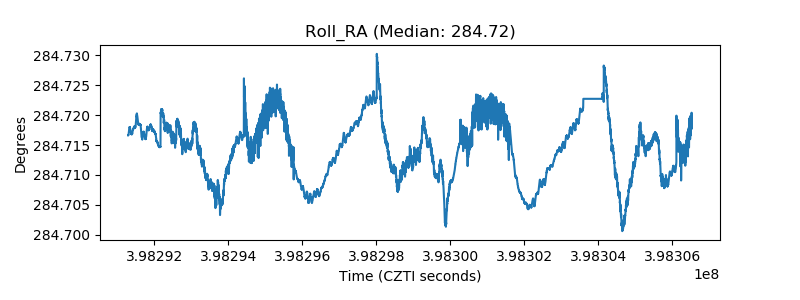 |
| Veto Counter | 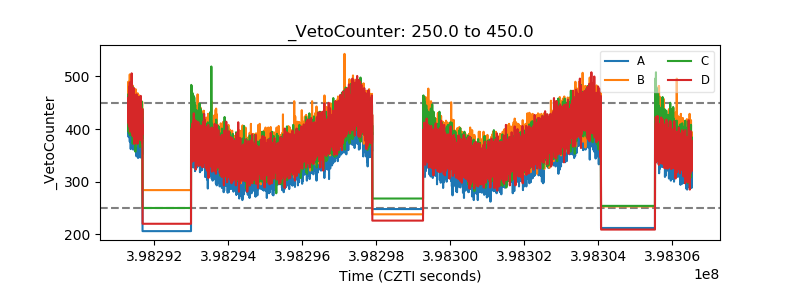 |