| Param | Original file | Final file |
|---|---|---|
| Filename | modeM0/AS1A11_079T01_9000005284_37212cztM0_level2.evt | modeM0/AS1A11_079T01_9000005284_37212cztM0_level2_quad_clean.evt |
| Size (bytes) | 433,379,520 | 51,906,240 |
| Size | 413.3 MB | 49.5 MB |
| Events in quadrant A | 2,761,667 | 304,308 |
| Events in quadrant B | 2,670,728 | 309,043 |
| Events in quadrant C | 2,882,698 | 302,870 |
| Events in quadrant D | 4,441,838 | 276,009 |
| Mode M9 | |||
|---|---|---|---|
| Quadrant | BADHDUFLAG | Total packets | Discarded packets |
| A | 0 | 18 | 0 |
| B | 0 | 18 | 0 |
| C | 0 | 18 | 0 |
| D | 0 | 19 | 0 |
| Mode SS | |||
|---|---|---|---|
| Quadrant | BADHDUFLAG | Total packets | Discarded packets |
| A | 0 | 110 | 0 |
| B | 0 | 110 | 0 |
| C | 0 | 110 | 0 |
| D | 0 | 110 | 0 |
| Mode M0 | |||
|---|---|---|---|
| Quadrant | BADHDUFLAG | Total packets | Discarded packets |
| A | 0 | 11454 | 3 |
| B | 0 | 11310 | 2 |
| C | 0 | 11702 | 2 |
| D | 0 | 16924 | 2 |
| Quadrant | Total seconds | Saturated seconds | Saturation percentage |
|---|---|---|---|
| A | 5413 | 10 | 0.184740% |
| B | 5413 | 21 | 0.387955% |
| C | 5413 | 40 | 0.738962% |
| D | 5413 | 598 | 11.047478% |
Noise dominated data is calculated using 1-second bins in cleaned event files. If a bin has >2000 counts, and if more than 50% of those come from <1% of pixels, then it is considered to be noise-dominated and hence unusable.
| Quadrant | # 1 sec bins | Bins with >0 counts | Bins with >2000 counts | High rate bins dominated by noise | Noise dominated (total time) | Noise dominated (detector-on time) | Marked lightcurve |
|---|---|---|---|---|---|---|---|
| A | 7115 | 5414 | 2 | 2 | 0.03% | 0.04% | 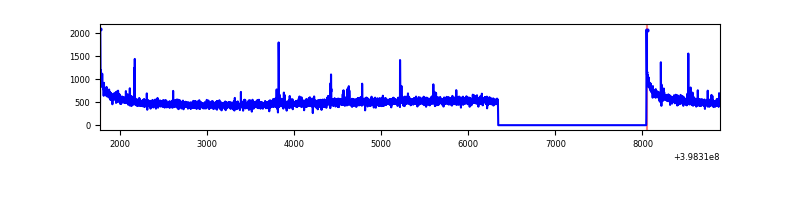 |
| B | 7115 | 5414 | 6 | 6 | 0.08% | 0.11% | 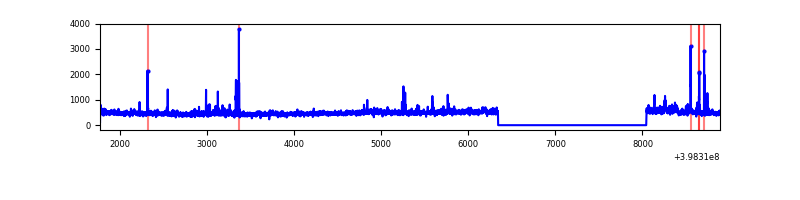 |
| C | 7115 | 5414 | 37 | 37 | 0.52% | 0.68% | 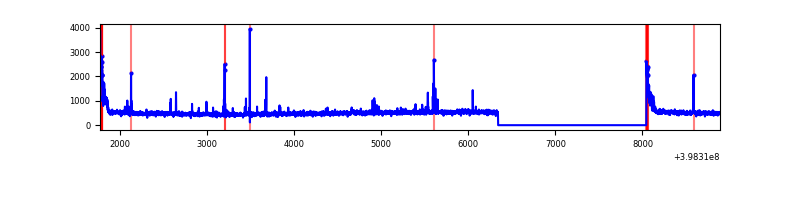 |
| D | 7115 | 5414 | 439 | 439 | 6.17% | 8.11% | 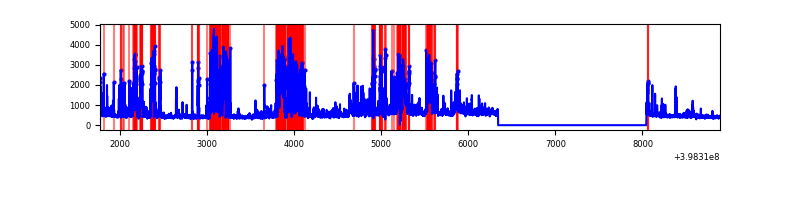 |
Top three noisy pixels from each quadrant. If the there are fewer than three noisy pixels in the level2.evt file, extra rows are filled as -1
| Pixel properties | Quadrant properties | ||||||
|---|---|---|---|---|---|---|---|
| Quadrant | DetID | PixID | Counts | Sigma | Mean | Median | Sigma |
| A | 10 | 83 | 258884 | 1989.91 | 636 | 624 | 129.8 |
| A | 9 | 143 | 30391 | 229.36 | 636 | 624 | 129.8 |
| A | 13 | 254 | 8221 | 58.54 | 636 | 624 | 129.8 |
| B | 0 | 213 | 75385 | 608.79 | 632 | 614 | 122.8 |
| B | 5 | 172 | 72287 | 583.57 | 632 | 614 | 122.8 |
| B | 0 | 190 | 19917 | 157.17 | 632 | 614 | 122.8 |
| C | 15 | 214 | 234362 | 1625.2 | 616 | 619 | 143.8 |
| C | 0 | 10 | 148941 | 1031.27 | 616 | 619 | 143.8 |
| C | 14 | 254 | 73615 | 507.53 | 616 | 619 | 143.8 |
| D | 2 | 249 | 1598254 | 11226.93 | 585 | 568 | 142.3 |
| D | 1 | 52 | 167816 | 1175.25 | 585 | 568 | 142.3 |
| D | 13 | 249 | 164221 | 1149.99 | 585 | 568 | 142.3 |
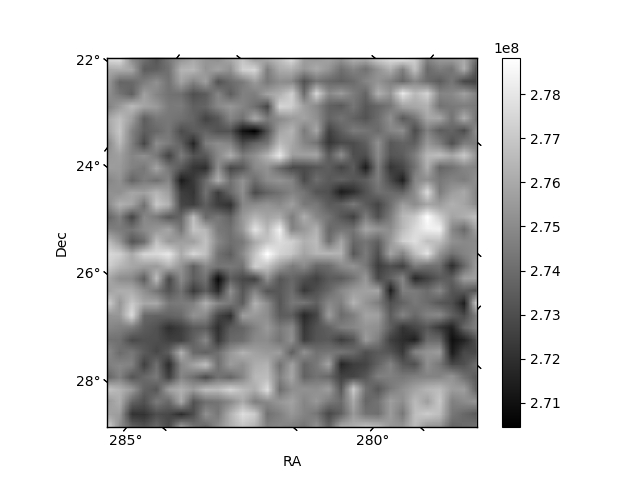
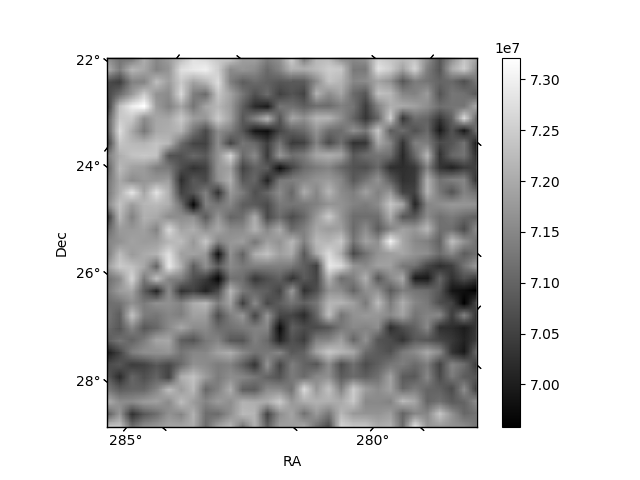
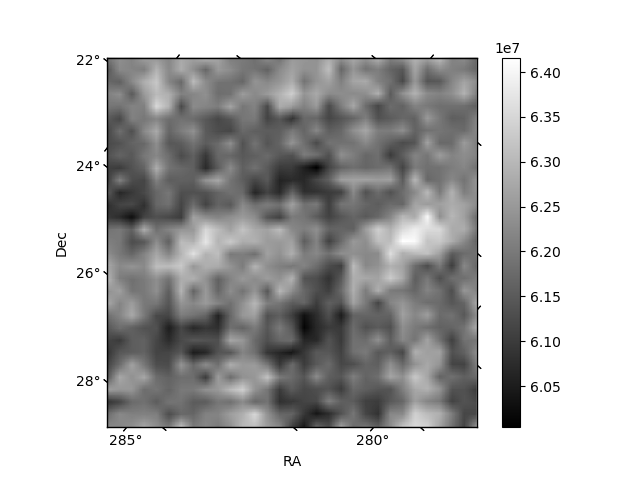
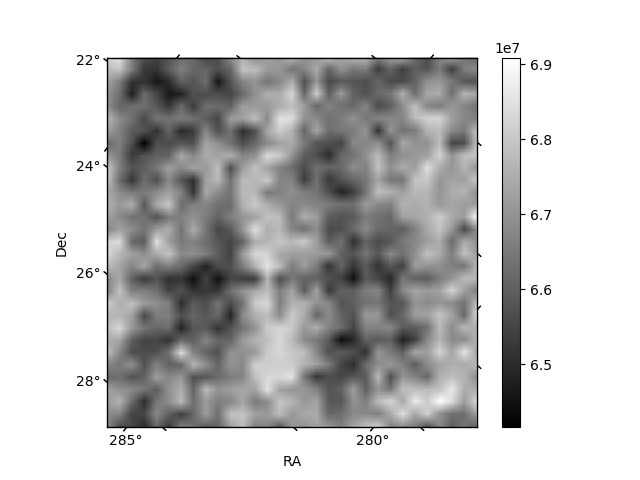
Histogram calculated using DETX and DETY for each event in the final _common_clean file
| Quadrant A | 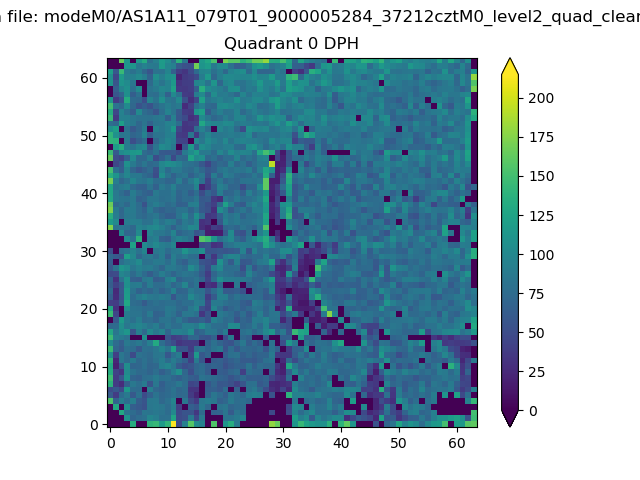 |
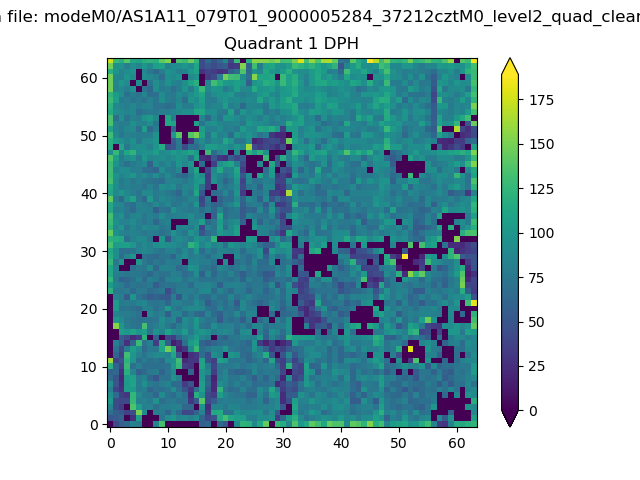 |
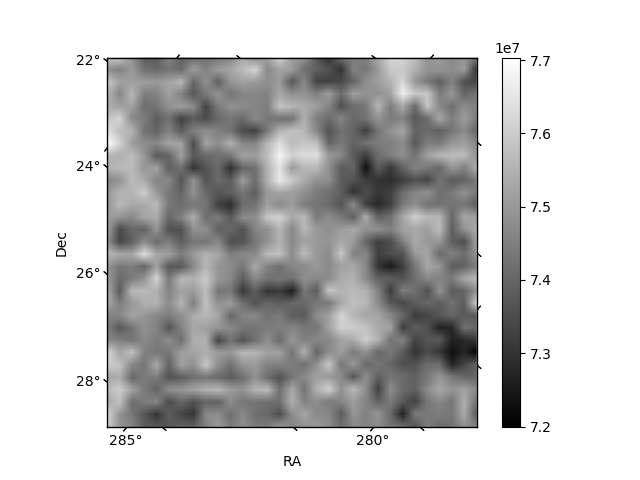
Quadrant B |
|---|---|---|---|
| Quadrant D | 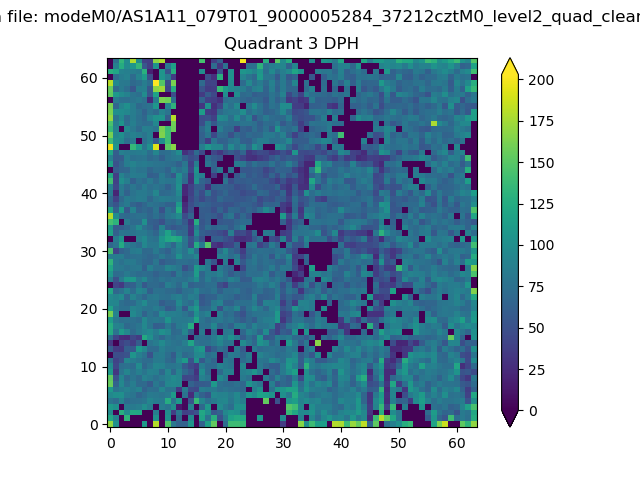 |
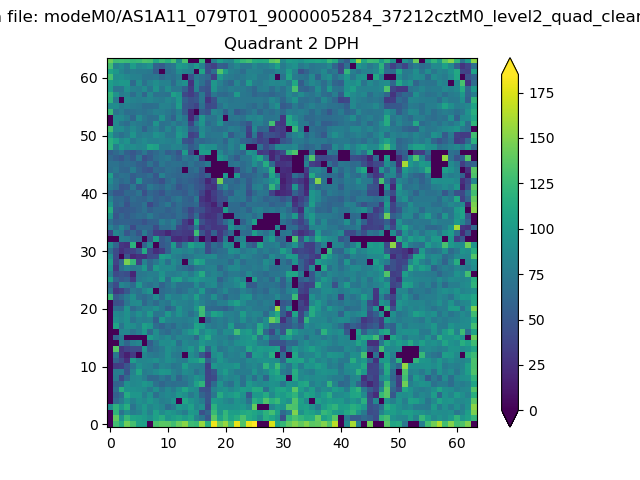 |
Quadrant C |
| Plot type | Count rate plots | Images |
|---|---|---|
| Comparison with Poisson distribution Blue bars denote a histogram of data divided into 1 sec bins. Red curve is a Poisson curve with rate = median count rate of data. |
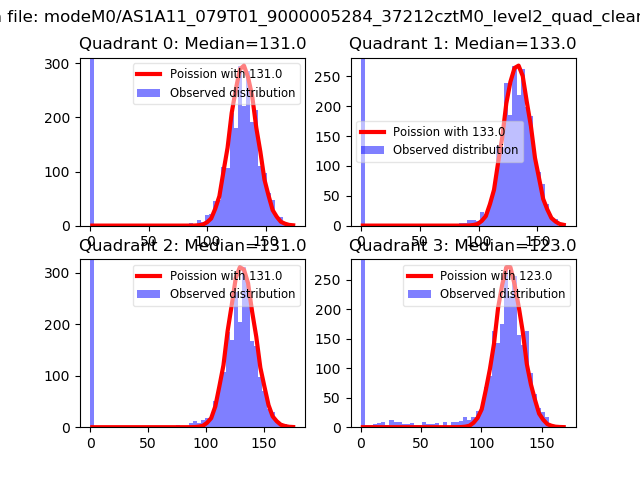 |
 |
| Quadrant-wise count rates Data is divided into 100 sec bins |
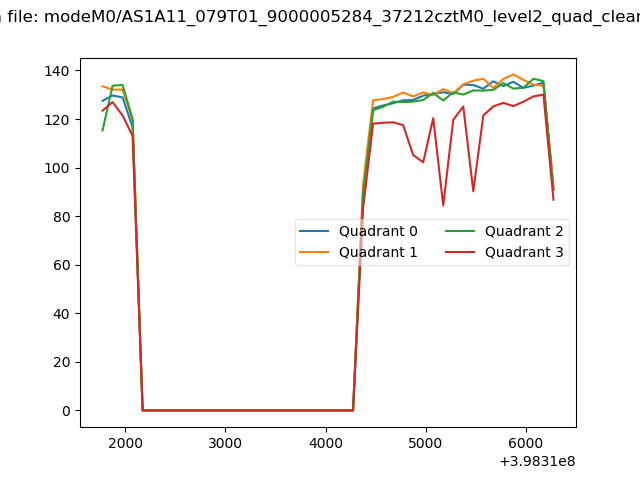 |
|
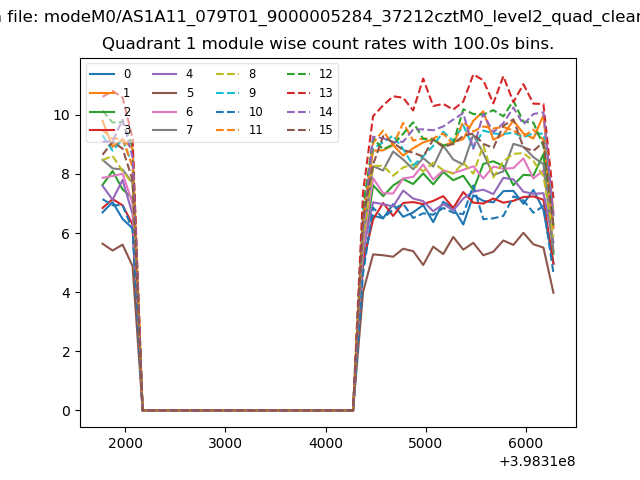
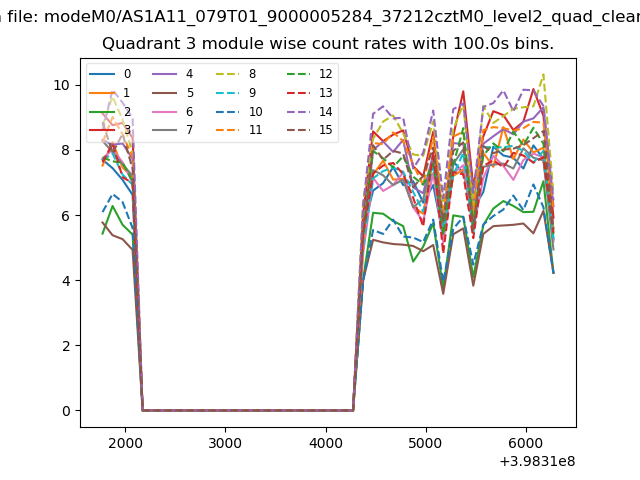
| Module-wise count rates for Quadrant A Data is divided into 100 sec bins |
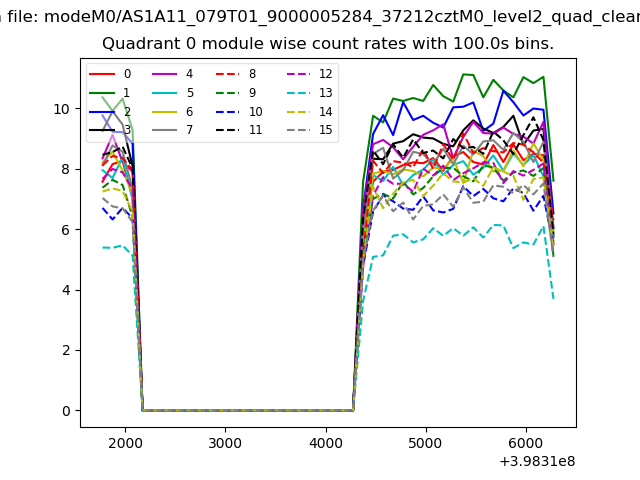 |
 |
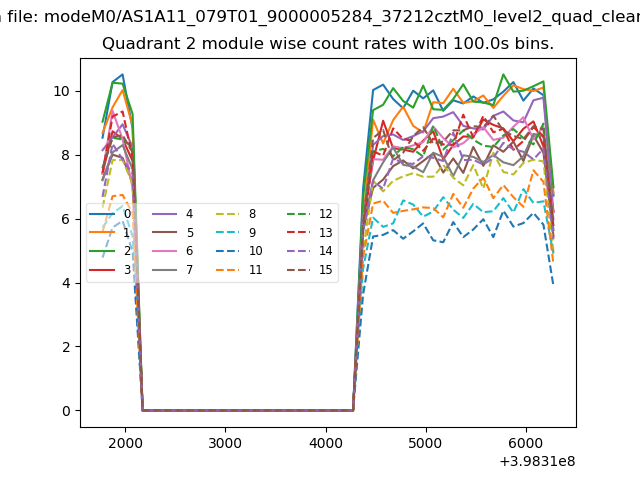
| Module-wise count rates for Quadrant B Data is divided into 100 sec bins |
 |
 |
| Module-wise count rates for Quadrant C Data is divided into 100 sec bins |
 |
 |
| Module-wise count rates for Quadrant D Data is divided into 100 sec bins |
 |
 |
| Parameter | Plot |
|---|---|
| CZT HV Monitor | 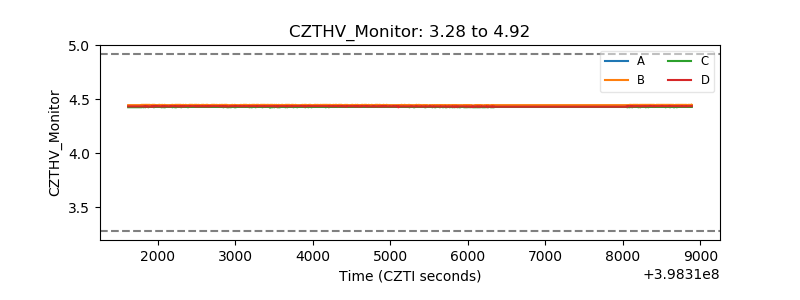 |
| D_VDD | 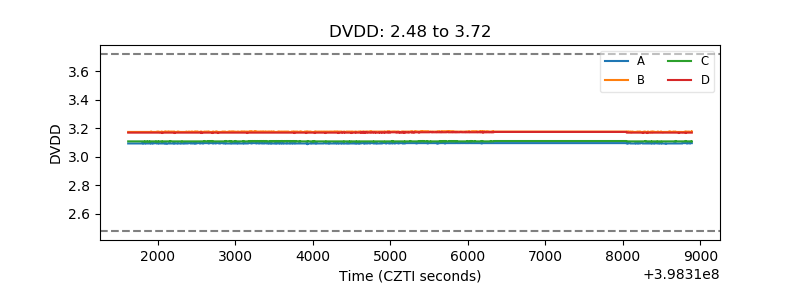 |
| Temperature 1 | 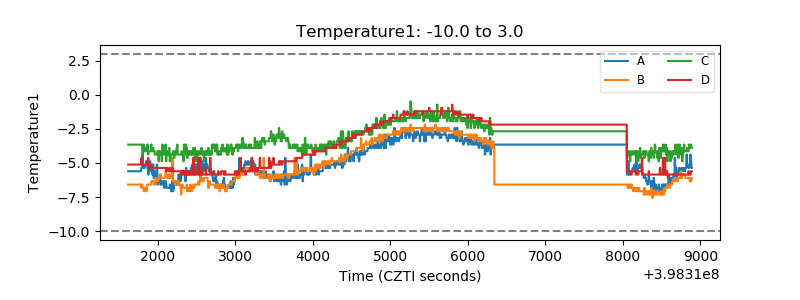 |
| Veto HV Monitor | 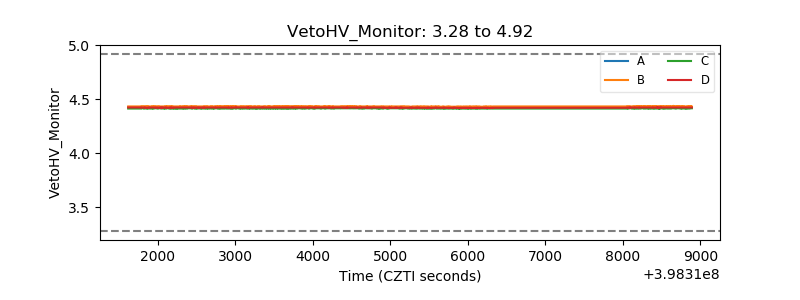 |
| Veto LLD | 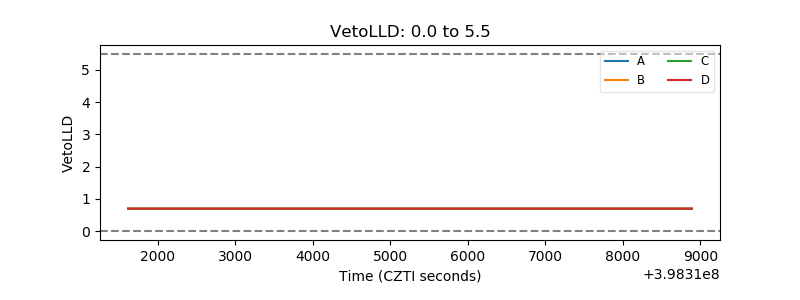 |
| Alpha Counter | 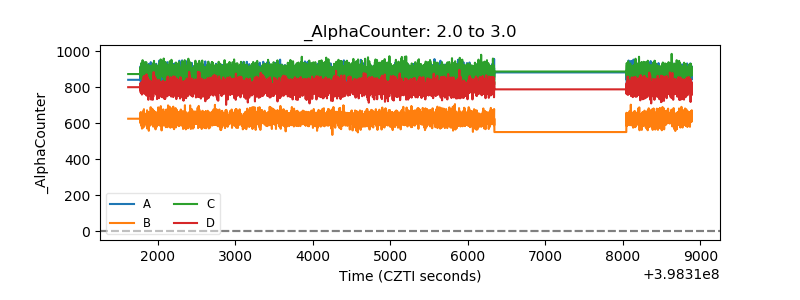 |
| _CPM_Rate | 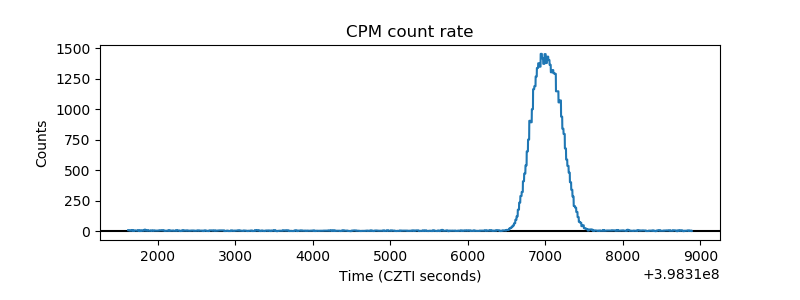 |
| CZT Counter | 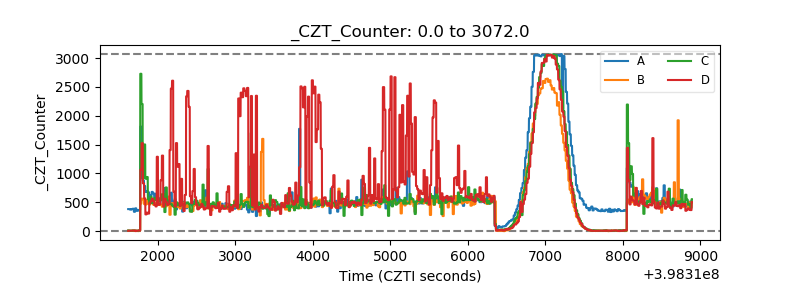 |
| +2.5 Volts monitor | 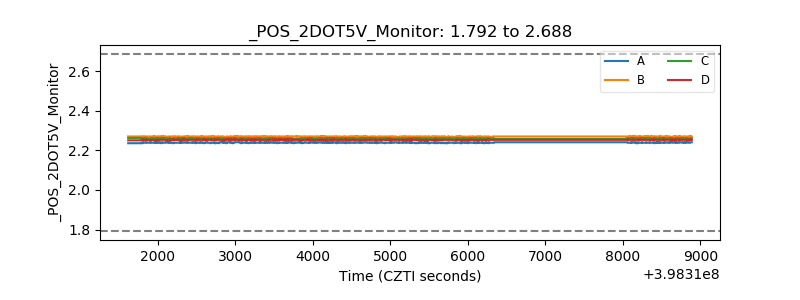 |
| +5 Volts monitor | 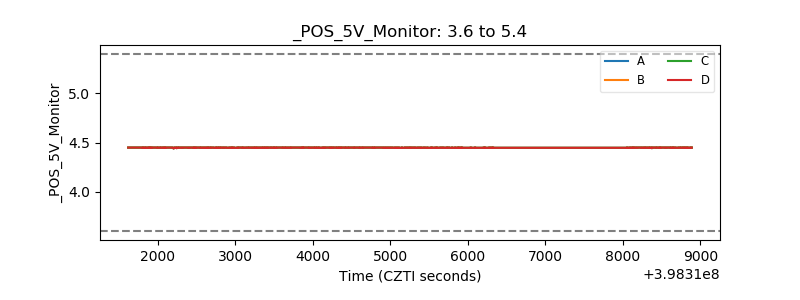 |
| _ROLL_ROT | 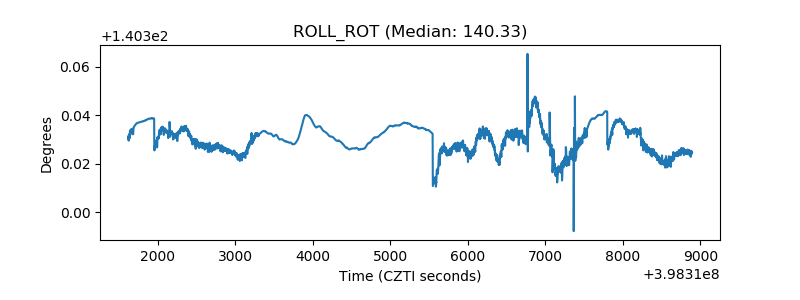 |
| _Roll_DEC | 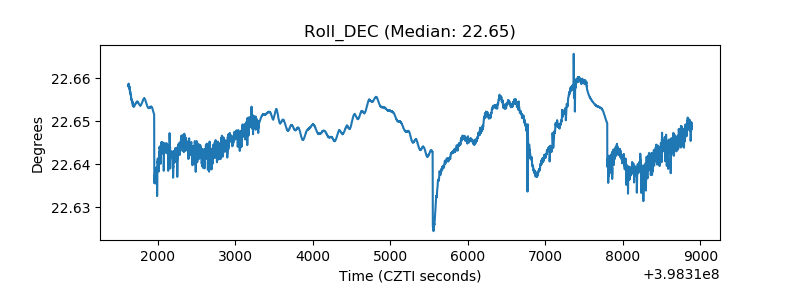 |
| _Roll_RA | 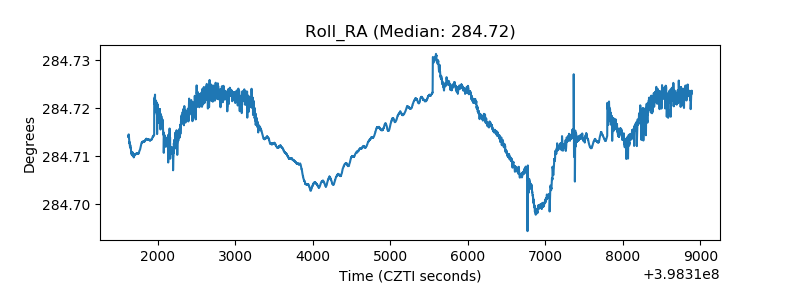 |
| Veto Counter | 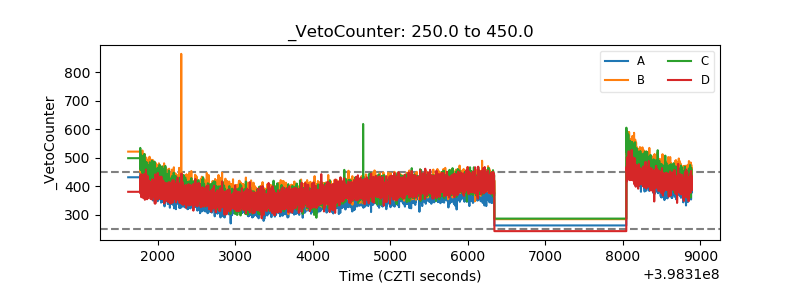 |