| Param | Original file | Final file |
|---|---|---|
| Filename | modeM0/AS1A11_079T01_9000005284_37215cztM0_level2.evt | modeM0/AS1A11_079T01_9000005284_37215cztM0_level2_quad_clean.evt |
| Size (bytes) | 462,594,240 | 58,086,720 |
| Size | 441.2 MB | 55.4 MB |
| Events in quadrant A | 2,939,325 | 355,963 |
| Events in quadrant B | 2,980,868 | 360,587 |
| Events in quadrant C | 3,352,321 | 348,350 |
| Events in quadrant D | 4,372,579 | 317,407 |
| Mode M9 | |||
|---|---|---|---|
| Quadrant | BADHDUFLAG | Total packets | Discarded packets |
| A | 0 | 30 | 0 |
| B | 0 | 30 | 0 |
| C | 0 | 30 | 0 |
| D | 0 | 31 | 0 |
| Mode SS | |||
|---|---|---|---|
| Quadrant | BADHDUFLAG | Total packets | Discarded packets |
| A | 0 | 112 | 0 |
| B | 0 | 112 | 0 |
| C | 0 | 112 | 0 |
| D | 0 | 112 | 0 |
| Mode M0 | |||
|---|---|---|---|
| Quadrant | BADHDUFLAG | Total packets | Discarded packets |
| A | 0 | 11765 | 3 |
| B | 0 | 12033 | 2 |
| C | 0 | 13072 | 2 |
| D | 0 | 16444 | 2 |
| Quadrant | Total seconds | Saturated seconds | Saturation percentage |
|---|---|---|---|
| A | 5365 | 8 | 0.149115% |
| B | 5365 | 70 | 1.304753% |
| C | 5365 | 91 | 1.696179% |
| D | 5365 | 453 | 8.443616% |
Noise dominated data is calculated using 1-second bins in cleaned event files. If a bin has >2000 counts, and if more than 50% of those come from <1% of pixels, then it is considered to be noise-dominated and hence unusable.
| Quadrant | # 1 sec bins | Bins with >0 counts | Bins with >2000 counts | High rate bins dominated by noise | Noise dominated (total time) | Noise dominated (detector-on time) | Marked lightcurve |
|---|---|---|---|---|---|---|---|
| A | 7307 | 5366 | 3 | 3 | 0.04% | 0.06% | 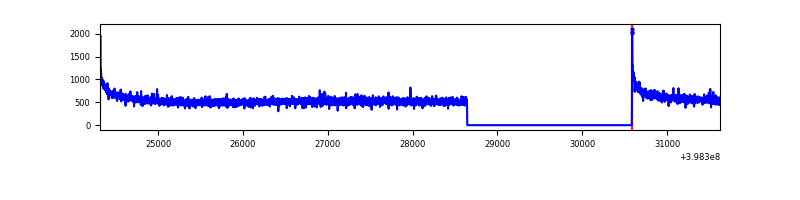 |
| B | 7307 | 5366 | 27 | 27 | 0.37% | 0.50% | 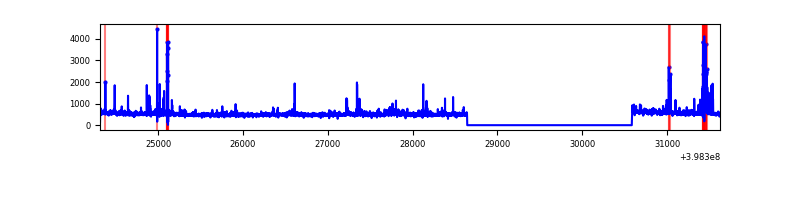 |
| C | 7307 | 5366 | 76 | 76 | 1.04% | 1.42% | 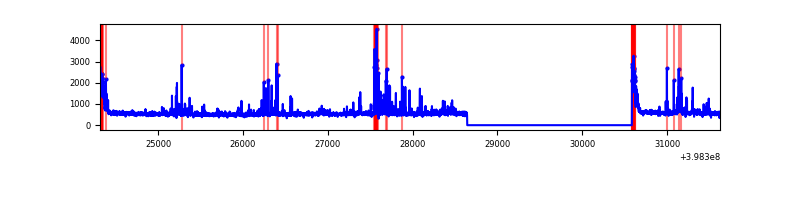 |
| D | 7307 | 5366 | 383 | 383 | 5.24% | 7.14% | 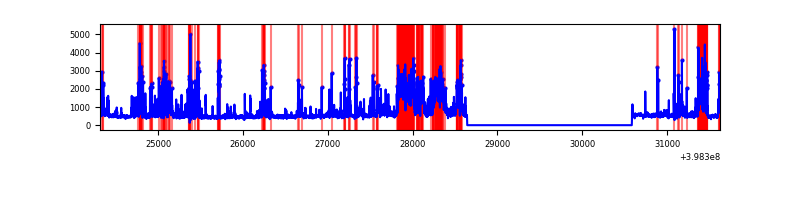 |
Top three noisy pixels from each quadrant. If the there are fewer than three noisy pixels in the level2.evt file, extra rows are filled as -1
| Pixel properties | Quadrant properties | ||||||
|---|---|---|---|---|---|---|---|
| Quadrant | DetID | PixID | Counts | Sigma | Mean | Median | Sigma |
| A | 10 | 83 | 262410 | 1917.86 | 690 | 680 | 136.5 |
| A | 13 | 254 | 7235 | 48.03 | 690 | 680 | 136.5 |
| A | 3 | 137 | 6779 | 44.69 | 690 | 680 | 136.5 |
| B | 5 | 172 | 206094 | 1589.92 | 681 | 664 | 129.2 |
| B | 0 | 213 | 91911 | 706.2 | 681 | 664 | 129.2 |
| B | 12 | 111 | 15879 | 117.76 | 681 | 664 | 129.2 |
| C | 14 | 254 | 348849 | 2289.3 | 657 | 662 | 152.1 |
| C | 15 | 214 | 232853 | 1526.64 | 657 | 662 | 152.1 |
| C | 0 | 10 | 191219 | 1252.9 | 657 | 662 | 152.1 |
| D | 2 | 249 | 1736329 | 11233.67 | 642 | 627 | 154.5 |
| D | 5 | 70 | 39264 | 250.06 | 642 | 627 | 154.5 |
| D | 2 | 153 | 35222 | 223.9 | 642 | 627 | 154.5 |
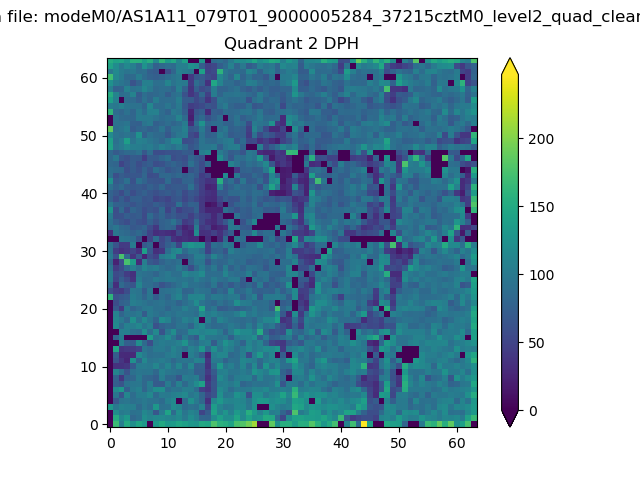
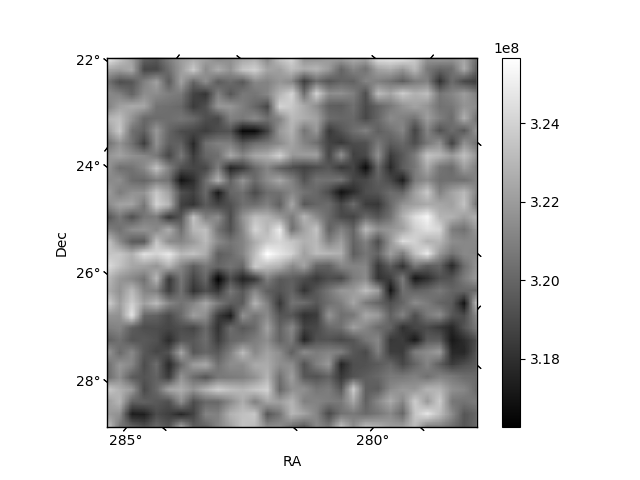
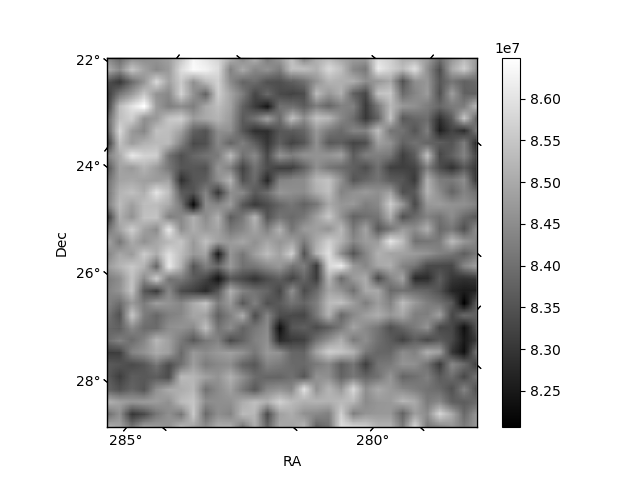
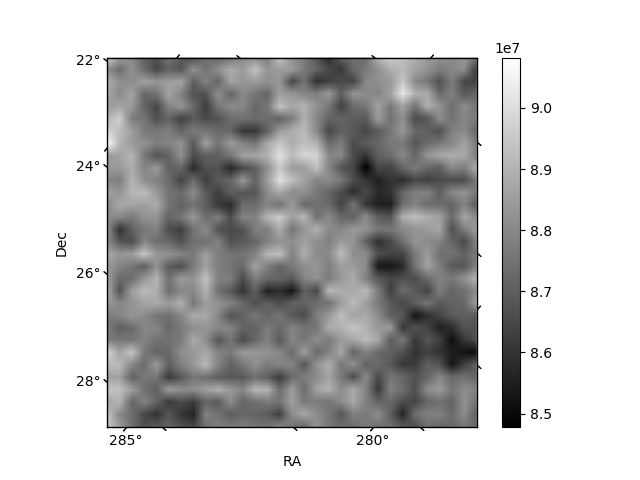
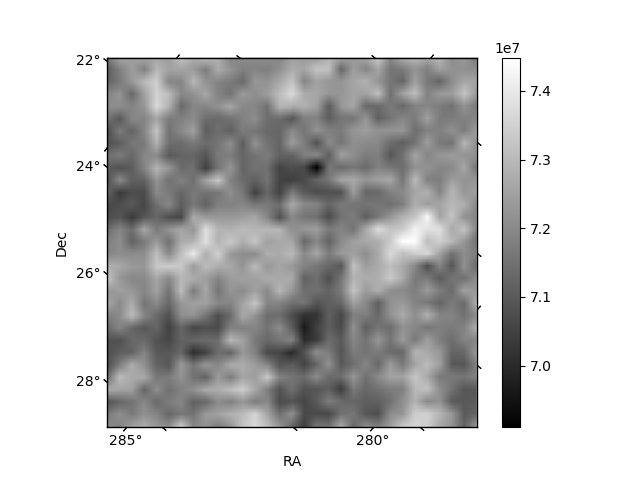
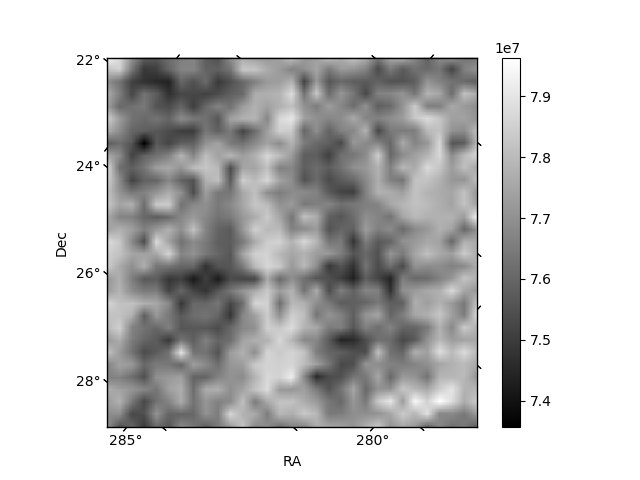
Histogram calculated using DETX and DETY for each event in the final _common_clean file
| Quadrant A | 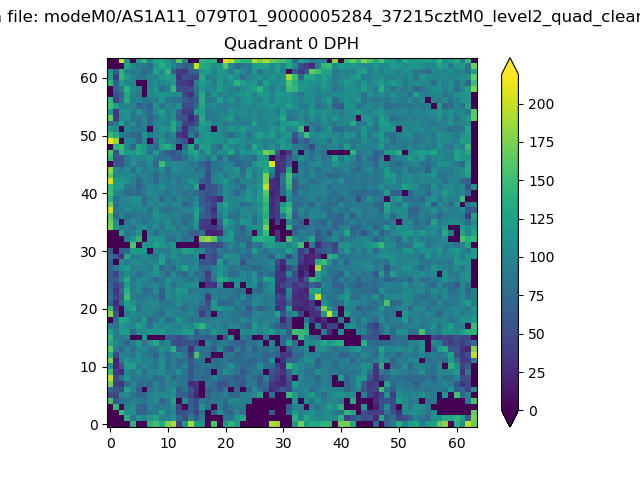 |
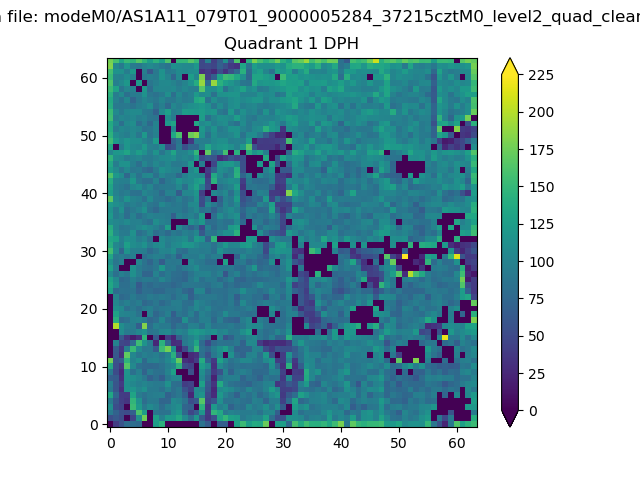 |
Quadrant B |
|---|---|---|---|
| Quadrant D | 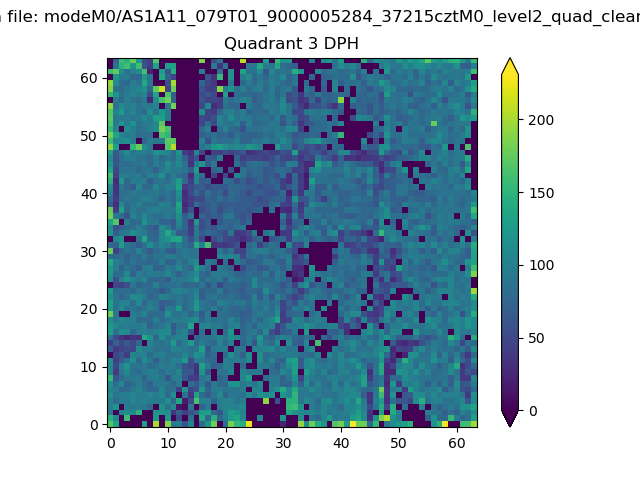 |
 |
Quadrant C |
| Plot type | Count rate plots | Images |
|---|---|---|
| Comparison with Poisson distribution Blue bars denote a histogram of data divided into 1 sec bins. Red curve is a Poisson curve with rate = median count rate of data. |
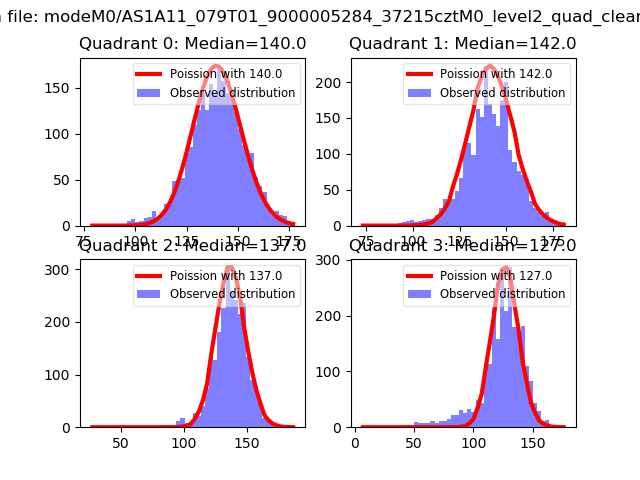 |
 |
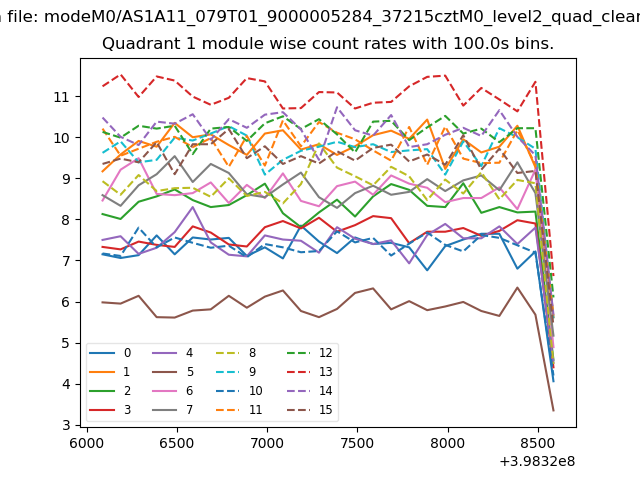
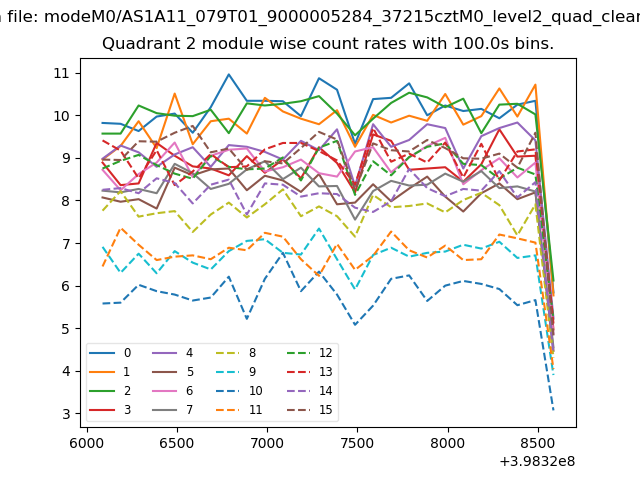
| Quadrant-wise count rates Data is divided into 100 sec bins |
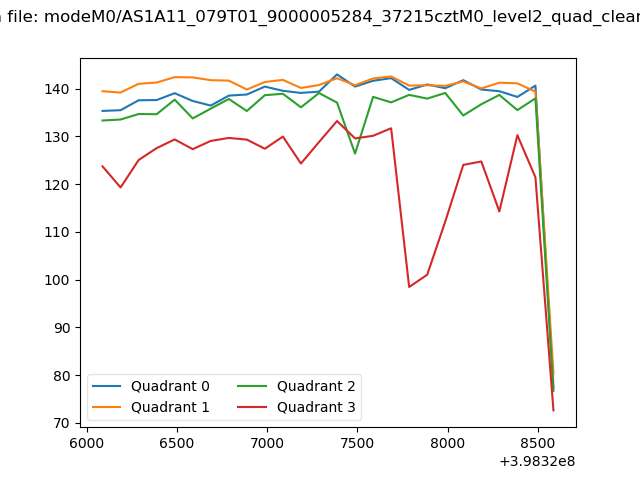 |
|
| Module-wise count rates for Quadrant A Data is divided into 100 sec bins |
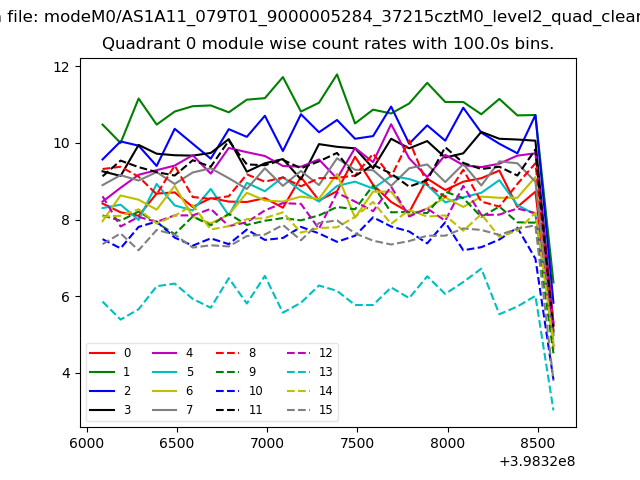 |
 |
| Module-wise count rates for Quadrant B Data is divided into 100 sec bins |
 |
 |
| Module-wise count rates for Quadrant C Data is divided into 100 sec bins |
 |
 |
| Module-wise count rates for Quadrant D Data is divided into 100 sec bins |
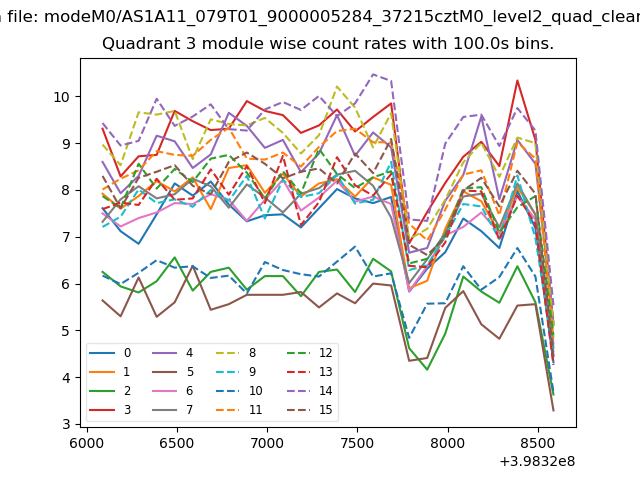 |
 |
| Parameter | Plot |
|---|---|
| CZT HV Monitor | 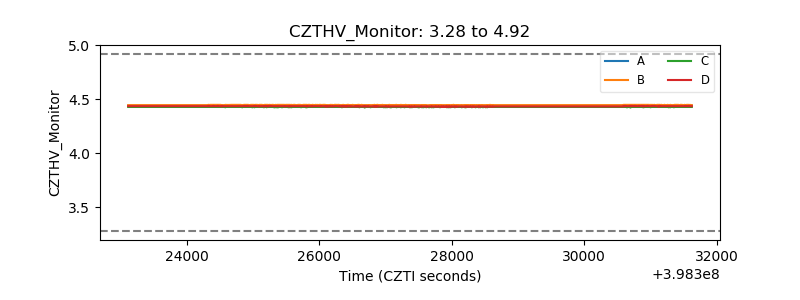 |
| D_VDD | 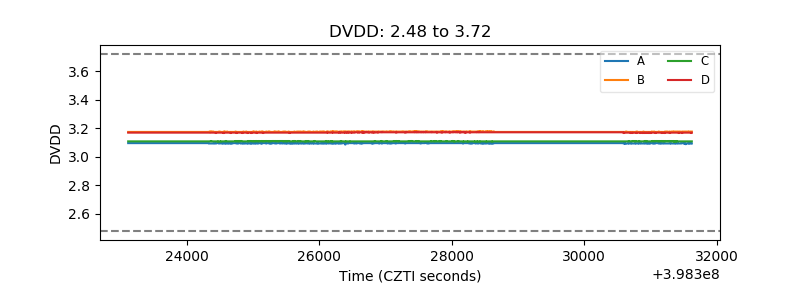 |
| Temperature 1 | 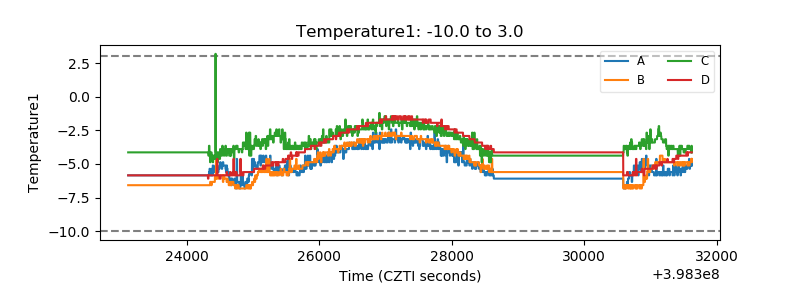 |
| Veto HV Monitor | 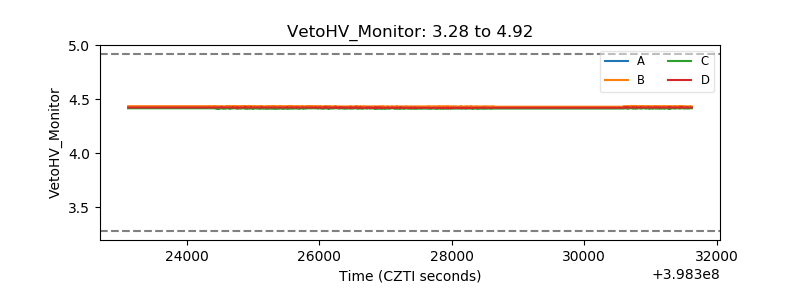 |
| Veto LLD | 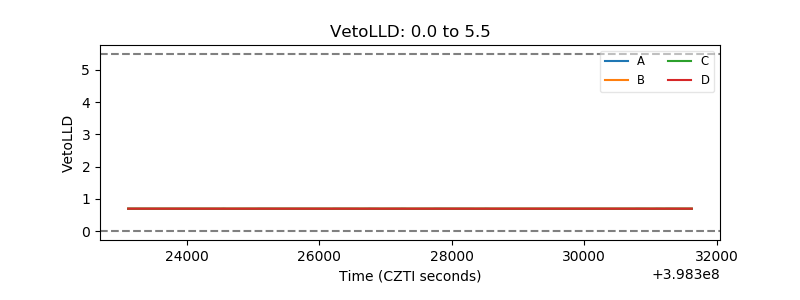 |
| Alpha Counter | 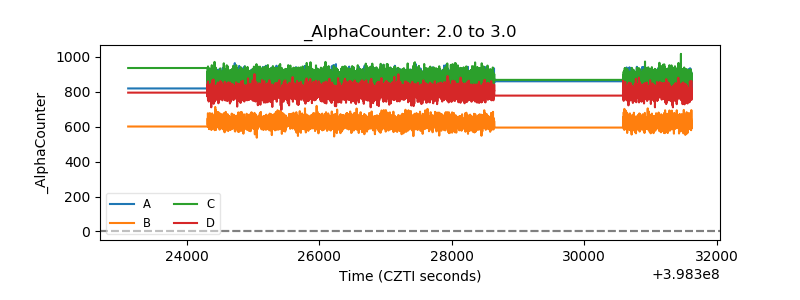 |
| _CPM_Rate | 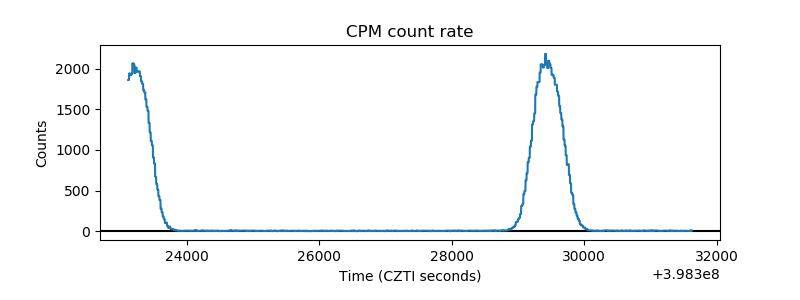 |
| CZT Counter | 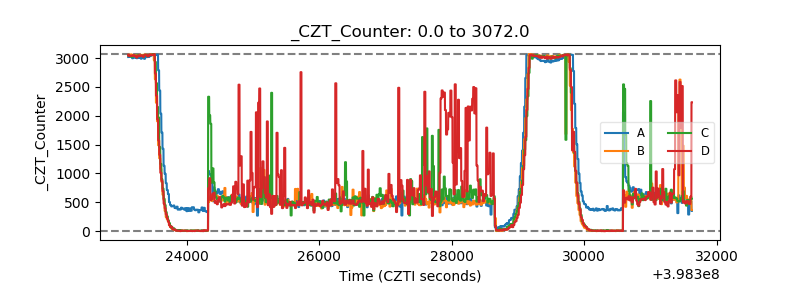 |
| +2.5 Volts monitor | 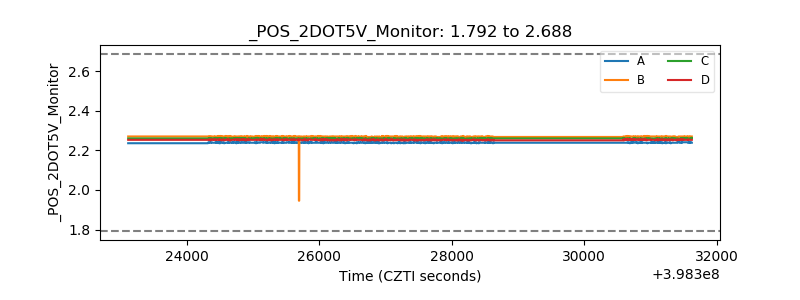 |
| +5 Volts monitor |  |
| _ROLL_ROT | 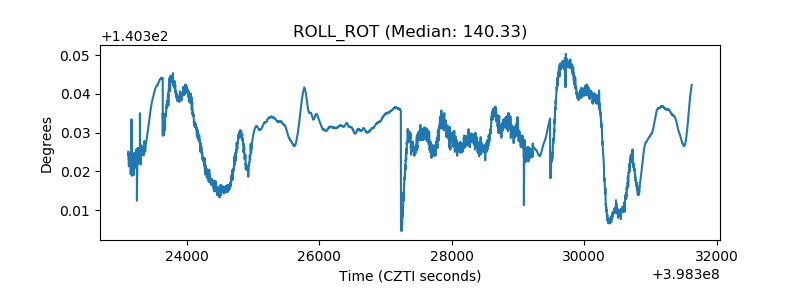 |
| _Roll_DEC | 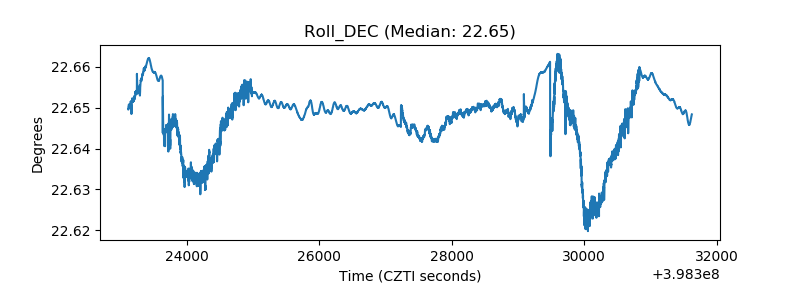 |
| _Roll_RA | 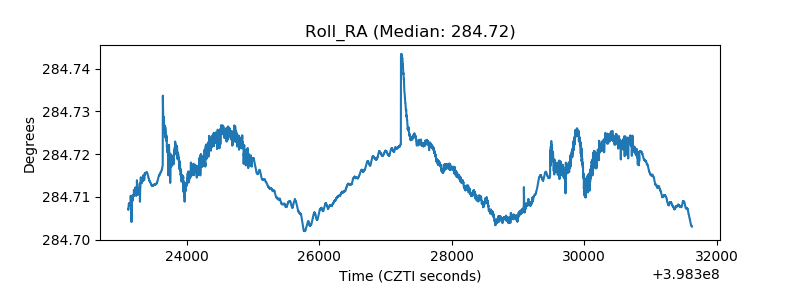 |
| Veto Counter | 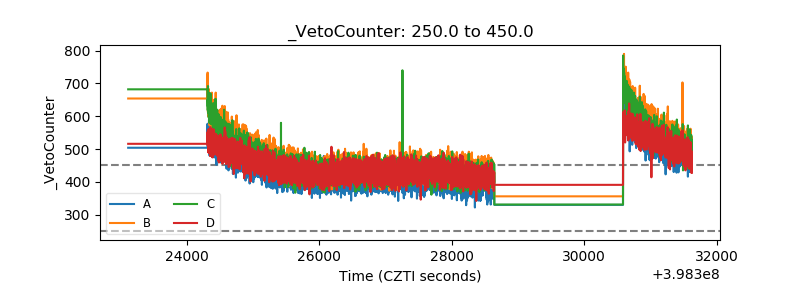 |