| Param | Original file | Final file |
|---|---|---|
| Filename | modeM0/AS1A11_079T01_9000005284_37216cztM0_level2.evt | modeM0/AS1A11_079T01_9000005284_37216cztM0_level2_quad_clean.evt |
| Size (bytes) | 443,545,920 | 64,537,920 |
| Size | 423.0 MB | 61.5 MB |
| Events in quadrant A | 2,830,175 | 415,559 |
| Events in quadrant B | 3,245,946 | 412,479 |
| Events in quadrant C | 3,181,212 | 405,375 |
| Events in quadrant D | 3,838,343 | 372,381 |
| Mode M9 | |||
|---|---|---|---|
| Quadrant | BADHDUFLAG | Total packets | Discarded packets |
| A | 0 | 32 | 0 |
| B | 0 | 32 | 0 |
| C | 0 | 32 | 0 |
| D | 0 | 33 | 0 |
| Mode SS | |||
|---|---|---|---|
| Quadrant | BADHDUFLAG | Total packets | Discarded packets |
| A | 0 | 100 | 0 |
| B | 0 | 100 | 0 |
| C | 0 | 100 | 0 |
| D | 0 | 100 | 0 |
| Mode M0 | |||
|---|---|---|---|
| Quadrant | BADHDUFLAG | Total packets | Discarded packets |
| A | 0 | 11246 | 3 |
| B | 0 | 12619 | 2 |
| C | 0 | 12411 | 2 |
| D | 0 | 14464 | 2 |
| Quadrant | Total seconds | Saturated seconds | Saturation percentage |
|---|---|---|---|
| A | 4970 | 24 | 0.482897% |
| B | 4970 | 221 | 4.446680% |
| C | 4970 | 81 | 1.629779% |
| D | 4970 | 337 | 6.780684% |
Noise dominated data is calculated using 1-second bins in cleaned event files. If a bin has >2000 counts, and if more than 50% of those come from <1% of pixels, then it is considered to be noise-dominated and hence unusable.
| Quadrant | # 1 sec bins | Bins with >0 counts | Bins with >2000 counts | High rate bins dominated by noise | Noise dominated (total time) | Noise dominated (detector-on time) | Marked lightcurve |
|---|---|---|---|---|---|---|---|
| A | 7033 | 4971 | 7 | 7 | 0.10% | 0.14% | 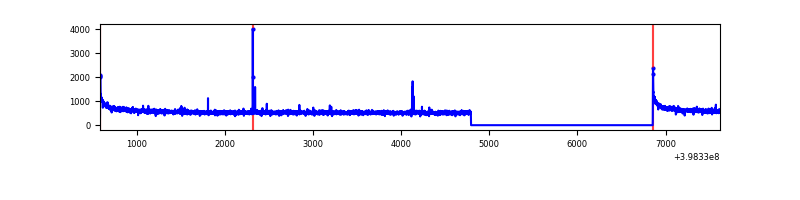 |
| B | 7033 | 4971 | 136 | 136 | 1.93% | 2.74% | 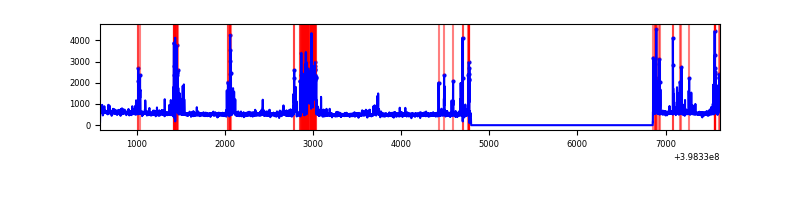 |
| C | 7033 | 4971 | 68 | 68 | 0.97% | 1.37% | 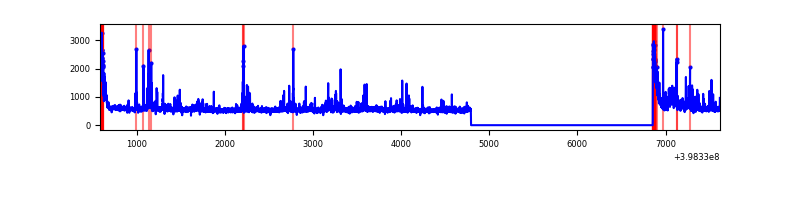 |
| D | 7033 | 4971 | 268 | 268 | 3.81% | 5.39% | 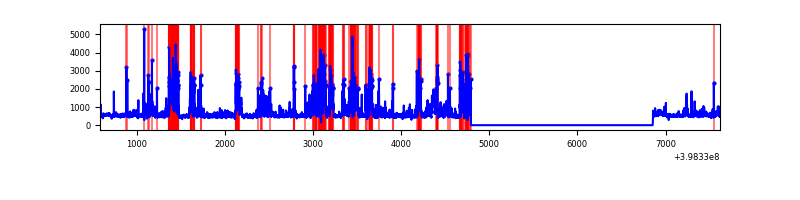 |
Top three noisy pixels from each quadrant. If the there are fewer than three noisy pixels in the level2.evt file, extra rows are filled as -1
| Pixel properties | Quadrant properties | ||||||
|---|---|---|---|---|---|---|---|
| Quadrant | DetID | PixID | Counts | Sigma | Mean | Median | Sigma |
| A | 10 | 83 | 247084 | 1881.52 | 660 | 650 | 131.0 |
| A | 15 | 222 | 24065 | 178.77 | 660 | 650 | 131.0 |
| A | 13 | 254 | 6806 | 47.0 | 660 | 650 | 131.0 |
| B | 0 | 213 | 365774 | 3023.18 | 641 | 627 | 120.8 |
| B | 5 | 172 | 343434 | 2838.22 | 641 | 627 | 120.8 |
| B | 12 | 111 | 14720 | 116.68 | 641 | 627 | 120.8 |
| C | 14 | 254 | 274600 | 1891.02 | 625 | 631 | 144.9 |
| C | 15 | 214 | 216879 | 1492.61 | 625 | 631 | 144.9 |
| C | 0 | 10 | 197962 | 1362.04 | 625 | 631 | 144.9 |
| D | 2 | 249 | 1162733 | 7753.09 | 619 | 602 | 149.9 |
| D | 13 | 249 | 98241 | 651.39 | 619 | 602 | 149.9 |
| D | 12 | 233 | 79248 | 524.68 | 619 | 602 | 149.9 |
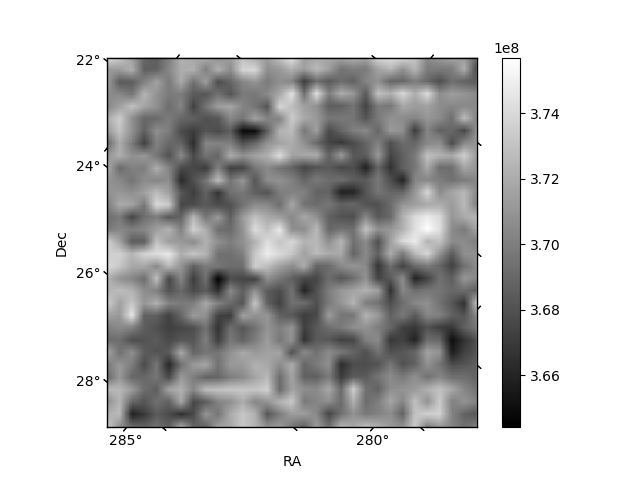
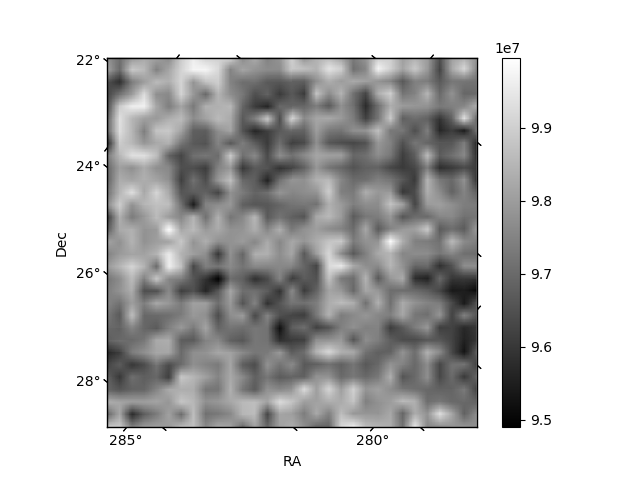
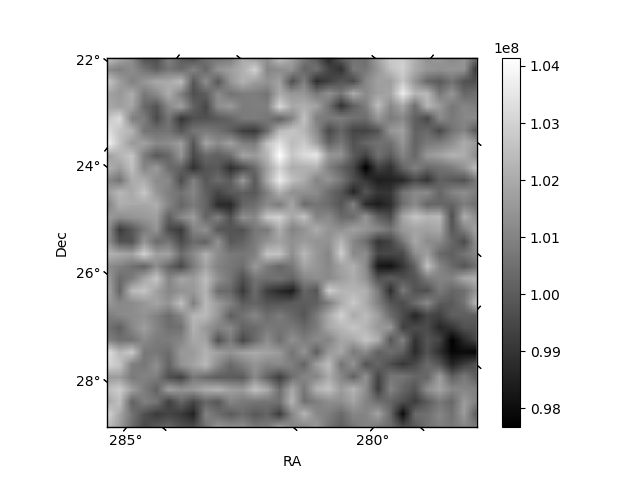
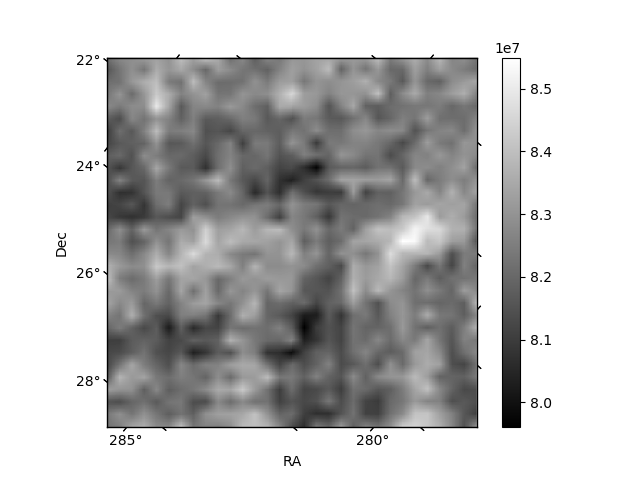
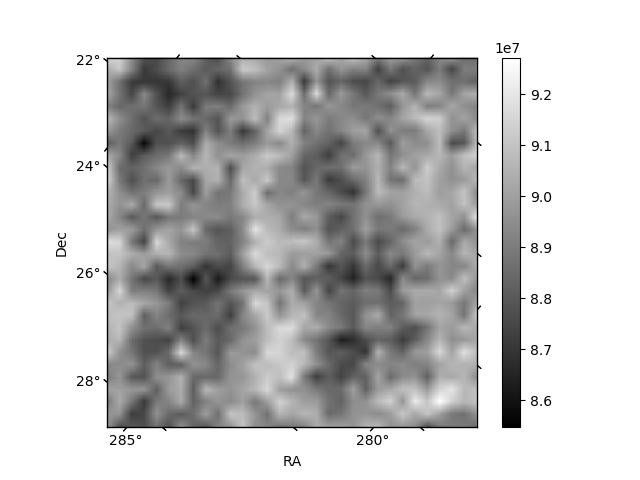
Histogram calculated using DETX and DETY for each event in the final _common_clean file
| Quadrant A | 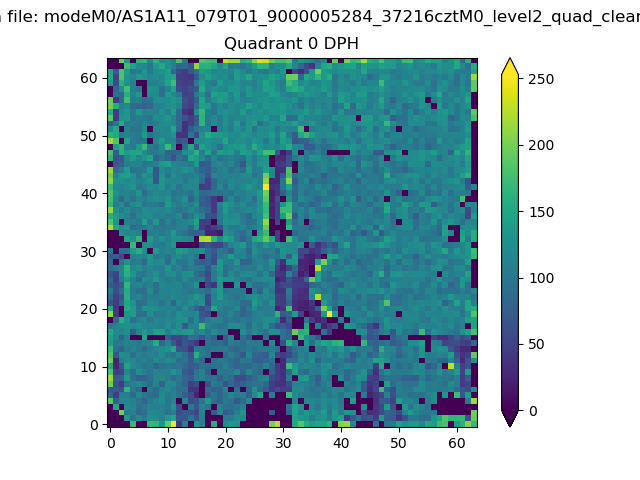 |
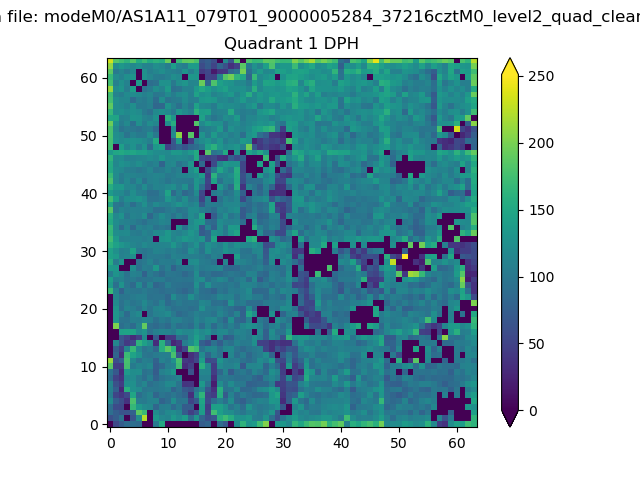 |
Quadrant B |
|---|---|---|---|
| Quadrant D | 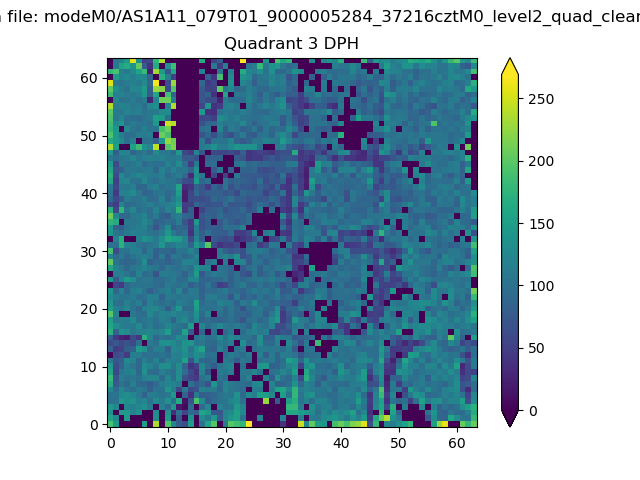 |
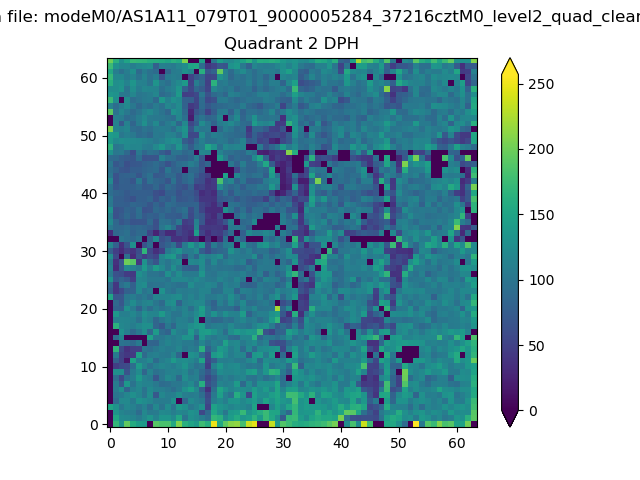 |
Quadrant C |
| Plot type | Count rate plots | Images |
|---|---|---|
| Comparison with Poisson distribution Blue bars denote a histogram of data divided into 1 sec bins. Red curve is a Poisson curve with rate = median count rate of data. |
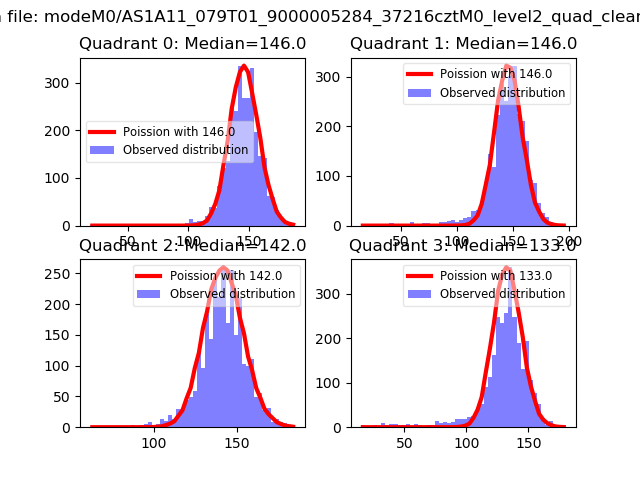 |
 |
| Quadrant-wise count rates Data is divided into 100 sec bins |
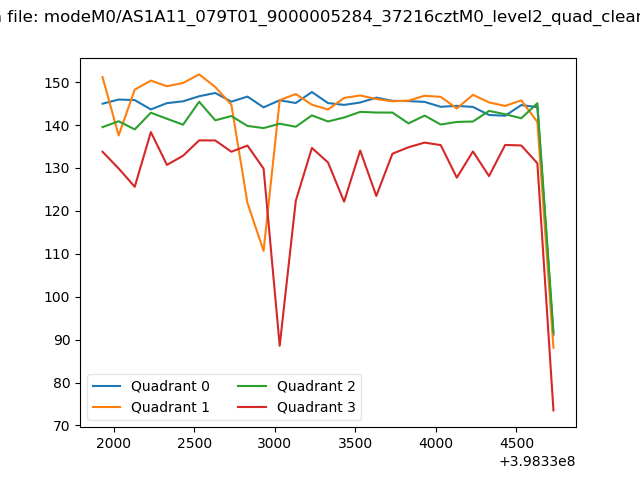 |
|
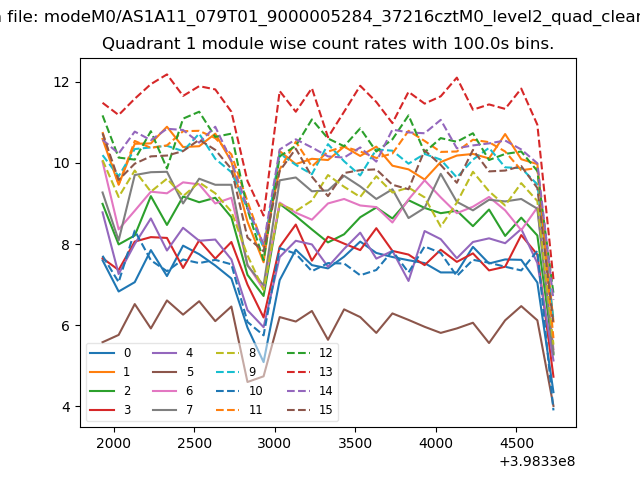
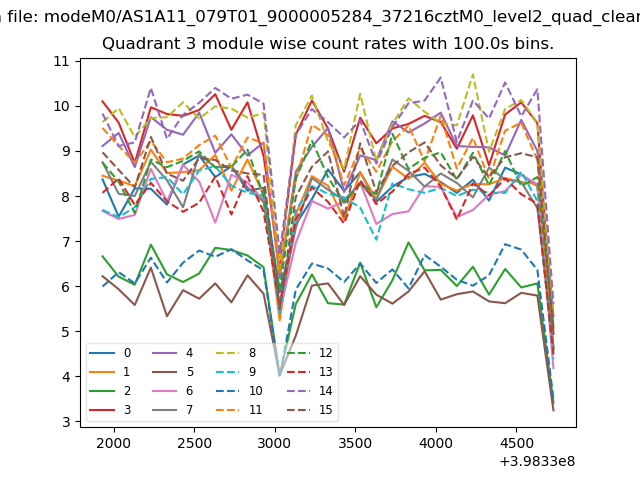
| Module-wise count rates for Quadrant A Data is divided into 100 sec bins |
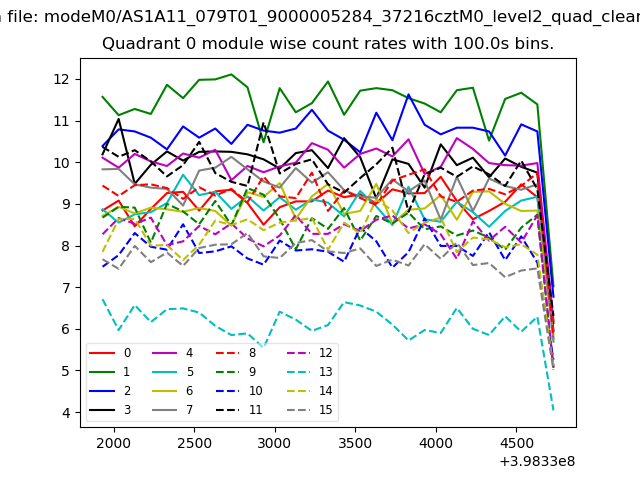 |
 |
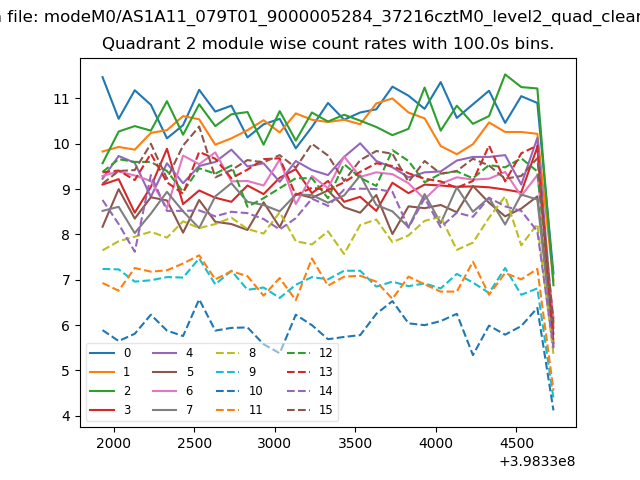
| Module-wise count rates for Quadrant B Data is divided into 100 sec bins |
 |
 |
| Module-wise count rates for Quadrant C Data is divided into 100 sec bins |
 |
 |
| Module-wise count rates for Quadrant D Data is divided into 100 sec bins |
 |
 |
| Parameter | Plot |
|---|---|
| CZT HV Monitor | 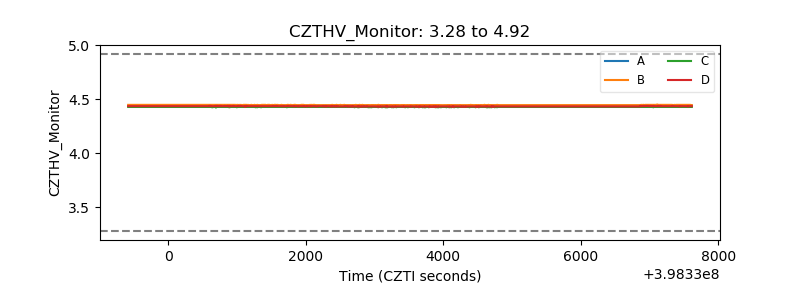 |
| D_VDD | 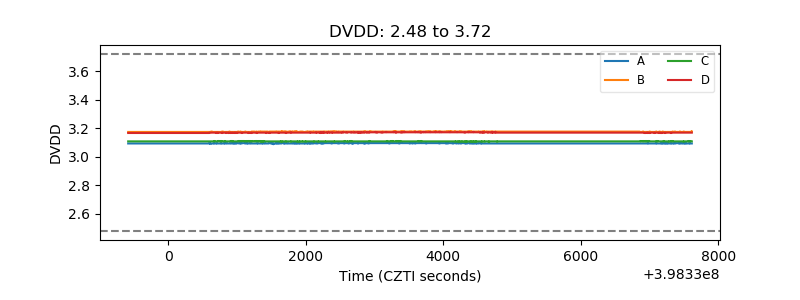 |
| Temperature 1 | 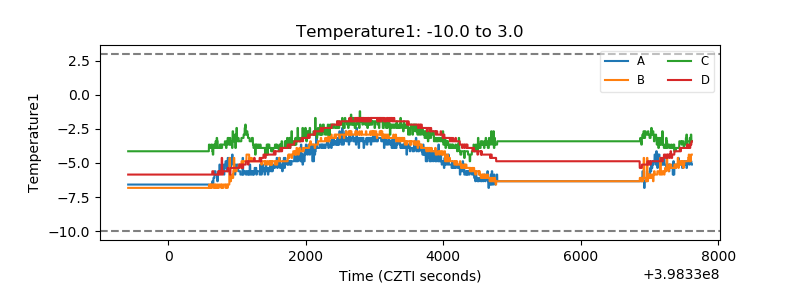 |
| Veto HV Monitor | 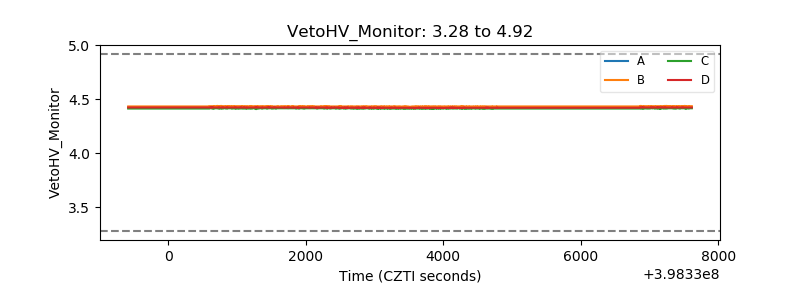 |
| Veto LLD | 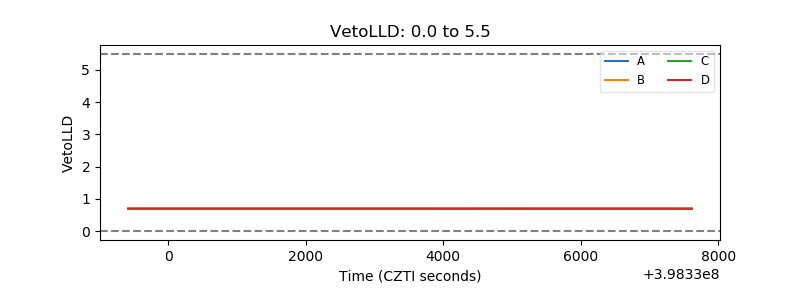 |
| Alpha Counter | 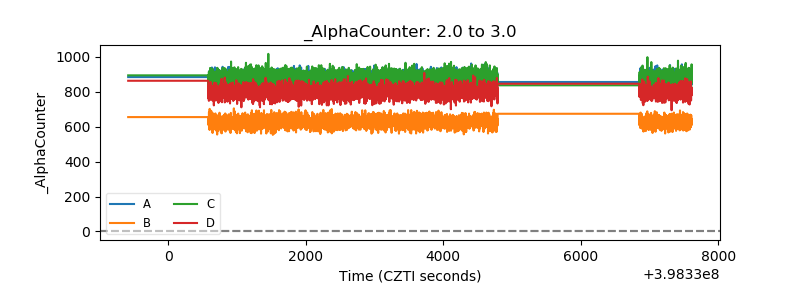 |
| _CPM_Rate | 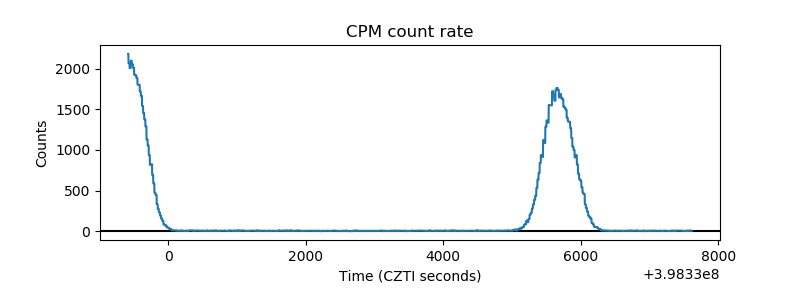 |
| CZT Counter | 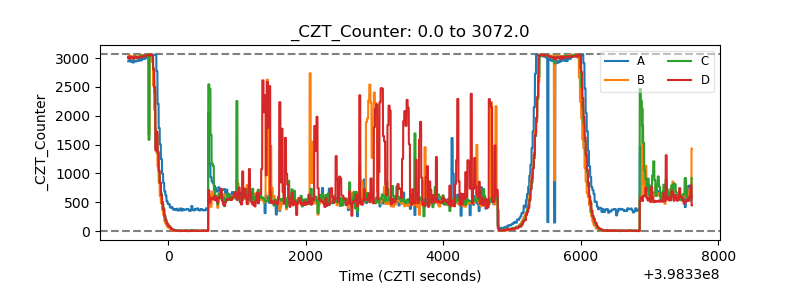 |
| +2.5 Volts monitor | 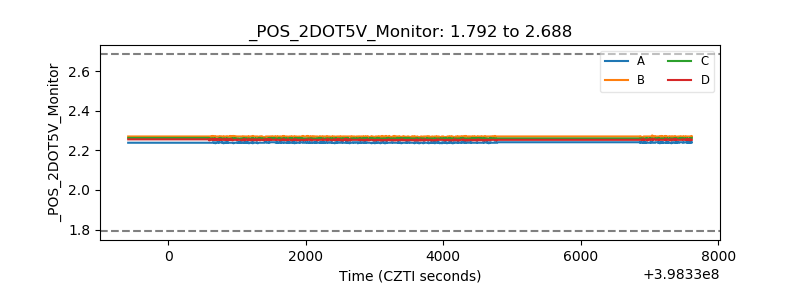 |
| +5 Volts monitor | 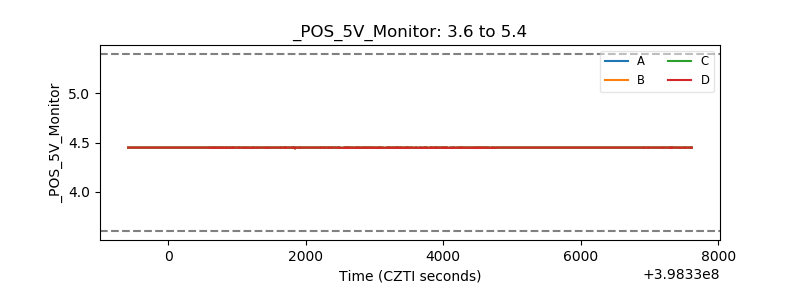 |
| _ROLL_ROT | 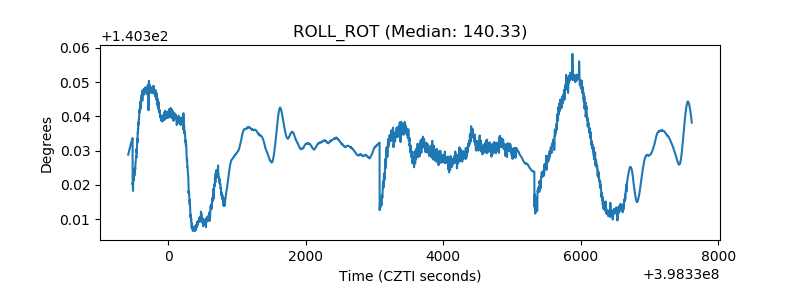 |
| _Roll_DEC | 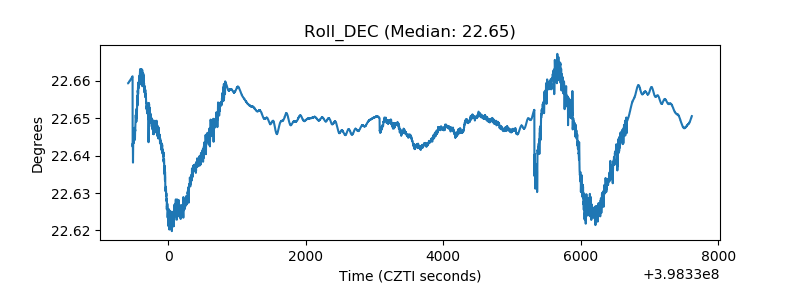 |
| _Roll_RA | 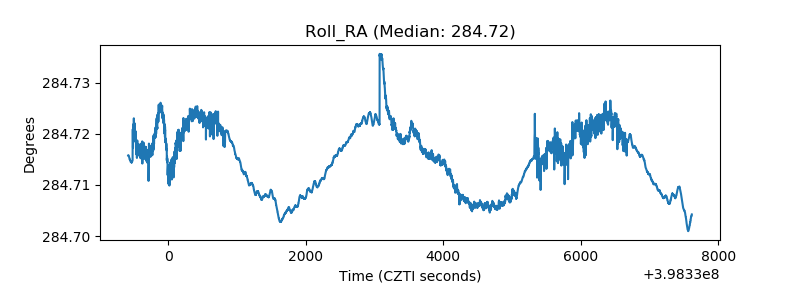 |
| Veto Counter | 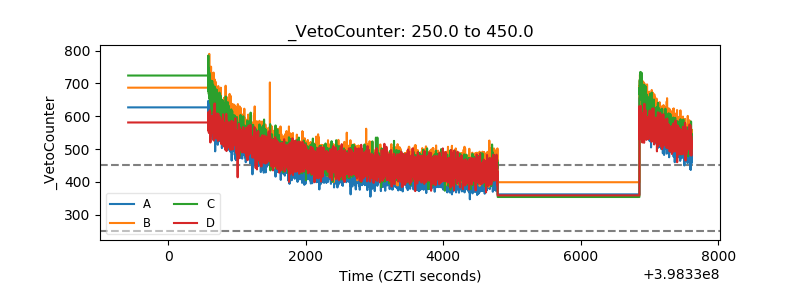 |