| Param | Original file | Final file |
|---|---|---|
| Filename | modeM0/AS1A11_079T01_9000005284_37217cztM0_level2.evt | modeM0/AS1A11_079T01_9000005284_37217cztM0_level2_quad_clean.evt |
| Size (bytes) | 424,756,800 | 77,287,680 |
| Size | 405.1 MB | 73.7 MB |
| Events in quadrant A | 2,768,732 | 515,280 |
| Events in quadrant B | 3,187,120 | 509,399 |
| Events in quadrant C | 3,162,171 | 500,986 |
| Events in quadrant D | 3,412,480 | 470,611 |
| Mode M9 | |||
|---|---|---|---|
| Quadrant | BADHDUFLAG | Total packets | Discarded packets |
| A | 0 | 32 | 0 |
| B | 0 | 32 | 0 |
| C | 0 | 32 | 0 |
| D | 0 | 33 | 0 |
| Mode SS | |||
|---|---|---|---|
| Quadrant | BADHDUFLAG | Total packets | Discarded packets |
| A | 0 | 98 | 0 |
| B | 0 | 98 | 0 |
| C | 0 | 98 | 0 |
| D | 0 | 98 | 0 |
| Mode M0 | |||
|---|---|---|---|
| Quadrant | BADHDUFLAG | Total packets | Discarded packets |
| A | 0 | 11094 | 3 |
| B | 0 | 12424 | 2 |
| C | 0 | 12168 | 2 |
| D | 0 | 13206 | 2 |
| Quadrant | Total seconds | Saturated seconds | Saturation percentage |
|---|---|---|---|
| A | 4911 | 16 | 0.325799% |
| B | 4911 | 234 | 4.764814% |
| C | 4911 | 142 | 2.891468% |
| D | 4911 | 192 | 3.909591% |
Noise dominated data is calculated using 1-second bins in cleaned event files. If a bin has >2000 counts, and if more than 50% of those come from <1% of pixels, then it is considered to be noise-dominated and hence unusable.
| Quadrant | # 1 sec bins | Bins with >0 counts | Bins with >2000 counts | High rate bins dominated by noise | Noise dominated (total time) | Noise dominated (detector-on time) | Marked lightcurve |
|---|---|---|---|---|---|---|---|
| A | 7034 | 4912 | 3 | 3 | 0.04% | 0.06% | 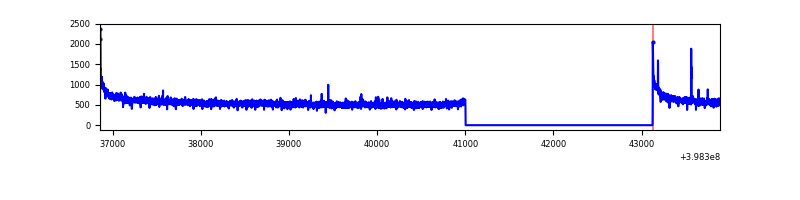 |
| B | 7034 | 4912 | 134 | 134 | 1.91% | 2.73% | 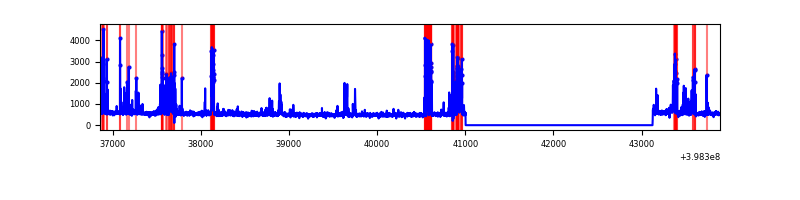 |
| C | 7034 | 4912 | 118 | 118 | 1.68% | 2.40% | 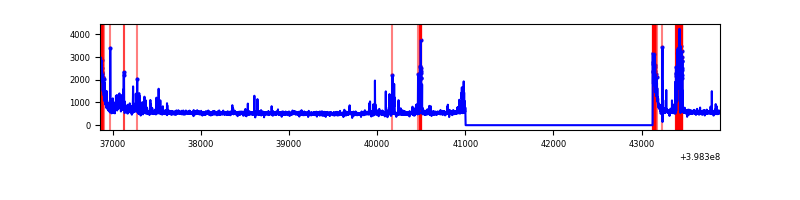 |
| D | 7034 | 4912 | 182 | 182 | 2.59% | 3.71% | 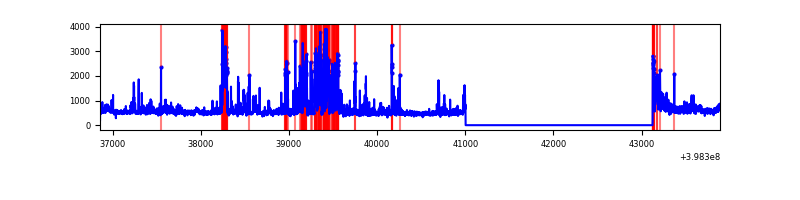 |
Top three noisy pixels from each quadrant. If the there are fewer than three noisy pixels in the level2.evt file, extra rows are filled as -1
| Pixel properties | Quadrant properties | ||||||
|---|---|---|---|---|---|---|---|
| Quadrant | DetID | PixID | Counts | Sigma | Mean | Median | Sigma |
| A | 10 | 83 | 249448 | 1931.42 | 647 | 636 | 128.8 |
| A | 13 | 254 | 7426 | 52.71 | 647 | 636 | 128.8 |
| A | 3 | 137 | 6244 | 43.53 | 647 | 636 | 128.8 |
| B | 5 | 172 | 661949 | 5615.36 | 623 | 610 | 117.8 |
| B | 0 | 213 | 42020 | 351.61 | 623 | 610 | 117.8 |
| B | 5 | 184 | 19007 | 156.21 | 623 | 610 | 117.8 |
| C | 14 | 254 | 326645 | 2311.09 | 610 | 613 | 141.1 |
| C | 15 | 214 | 213346 | 1507.96 | 610 | 613 | 141.1 |
| C | 0 | 10 | 192916 | 1363.15 | 610 | 613 | 141.1 |
| D | 2 | 249 | 555747 | 3738.77 | 616 | 601 | 148.5 |
| D | 13 | 200 | 163711 | 1098.5 | 616 | 601 | 148.5 |
| D | 1 | 52 | 136780 | 917.13 | 616 | 601 | 148.5 |
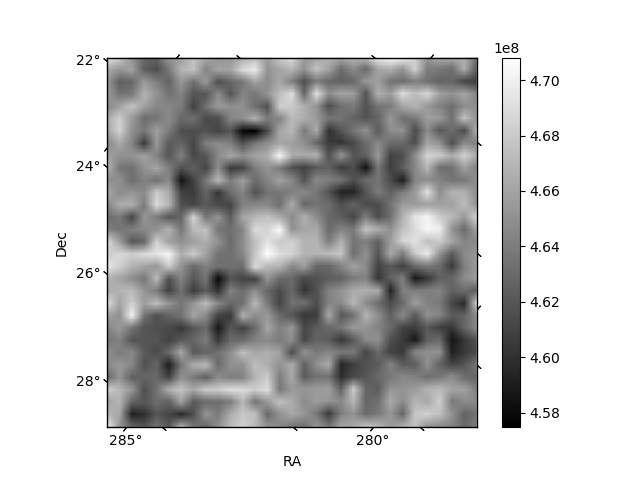
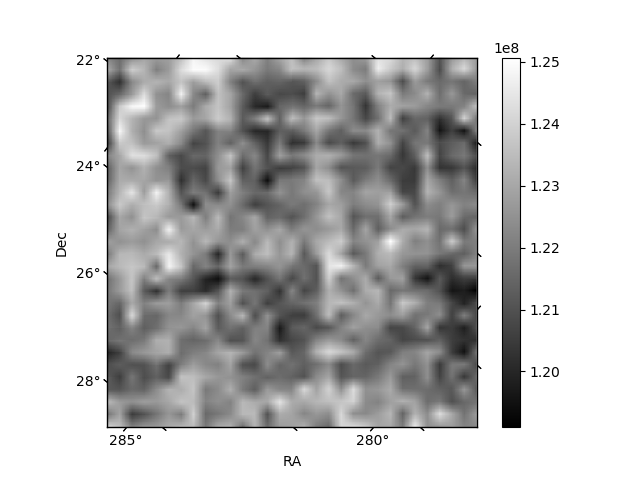
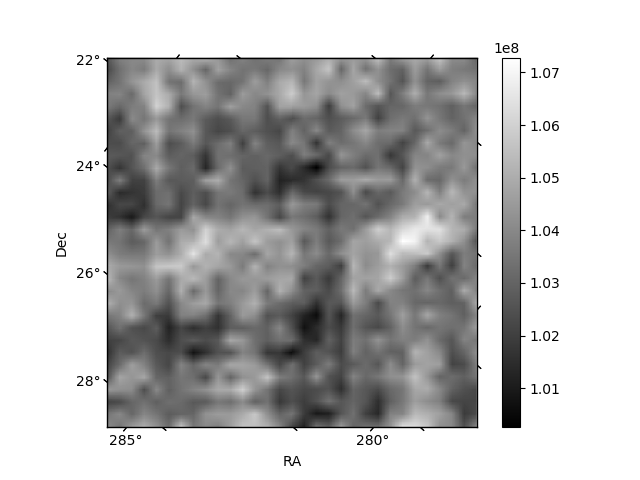
Histogram calculated using DETX and DETY for each event in the final _common_clean file
| Quadrant A | 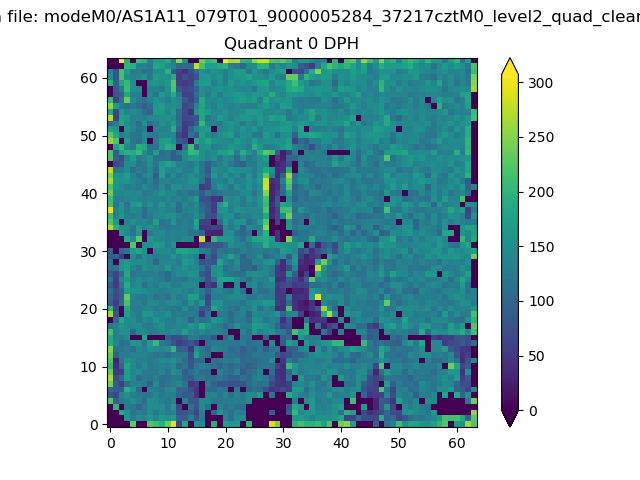 |
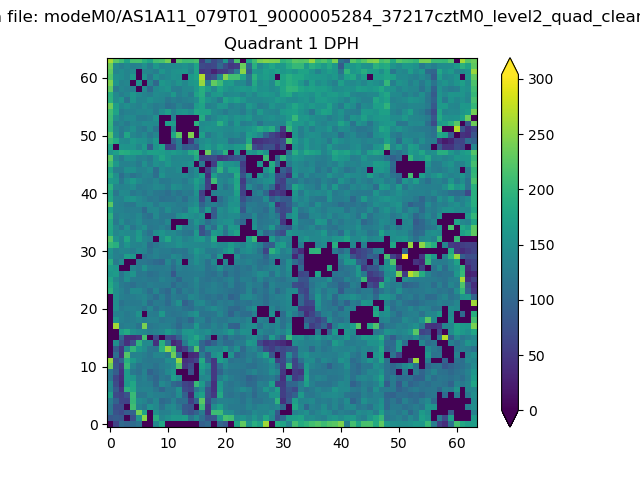 |
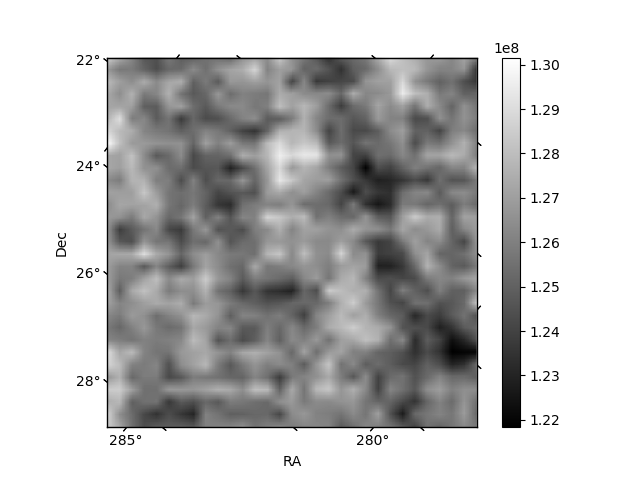
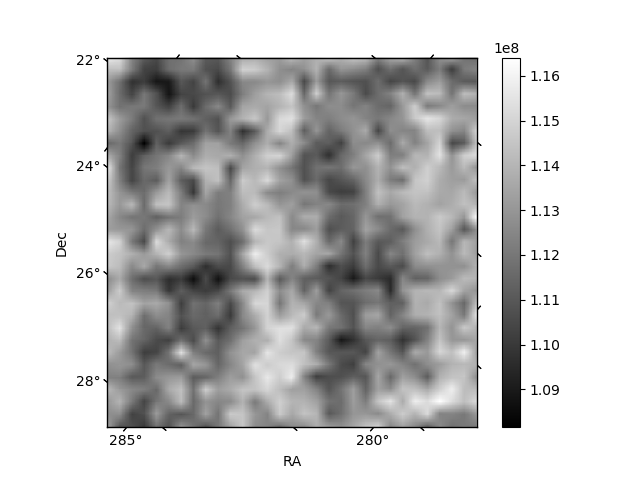
Quadrant B |
|---|---|---|---|
| Quadrant D | 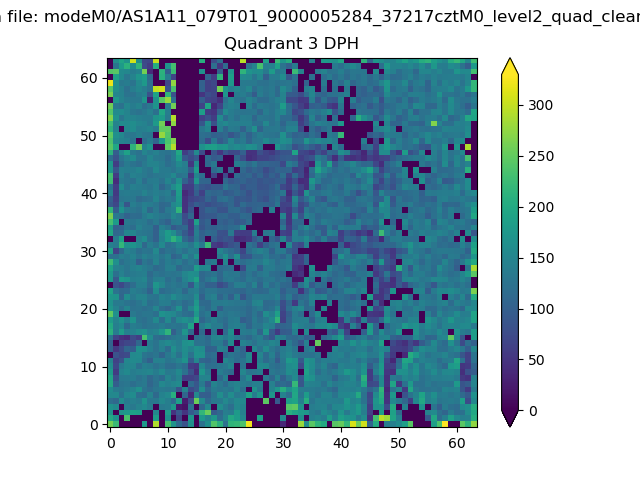 |
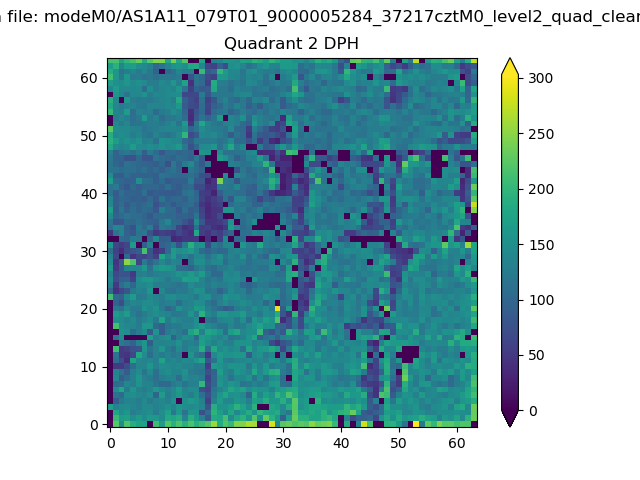 |
Quadrant C |
| Plot type | Count rate plots | Images |
|---|---|---|
| Comparison with Poisson distribution Blue bars denote a histogram of data divided into 1 sec bins. Red curve is a Poisson curve with rate = median count rate of data. |
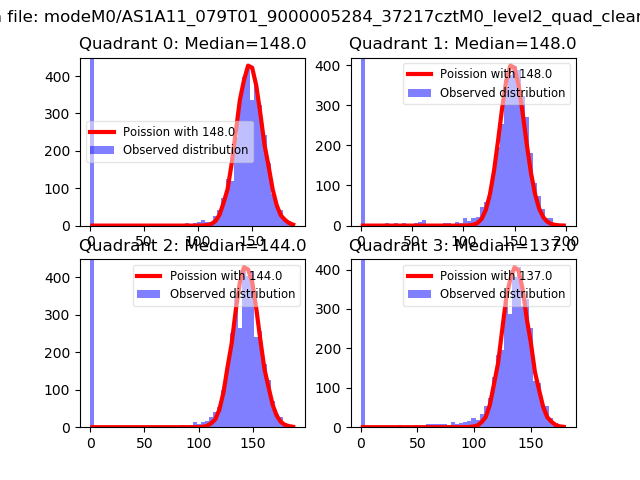 |
 |
| Quadrant-wise count rates Data is divided into 100 sec bins |
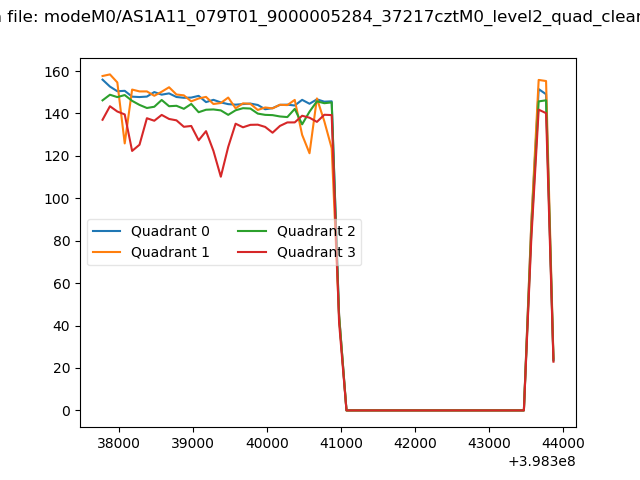 |
|
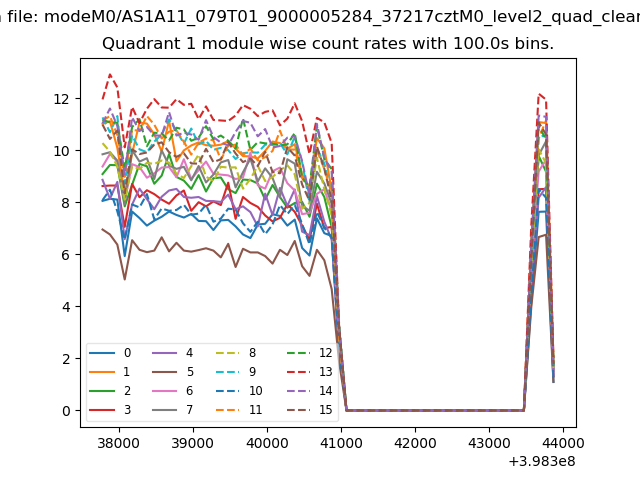
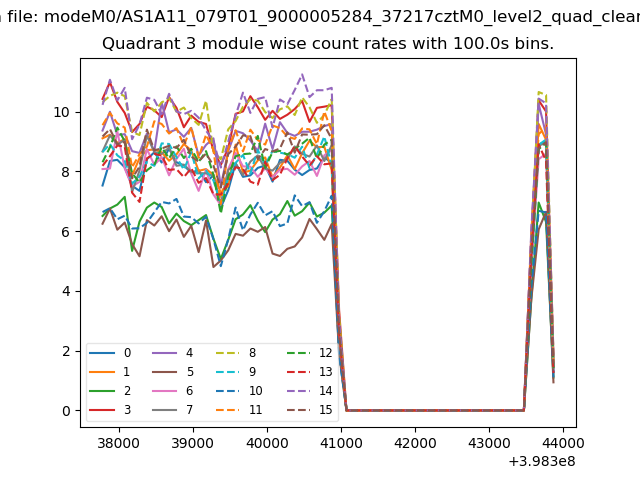
| Module-wise count rates for Quadrant A Data is divided into 100 sec bins |
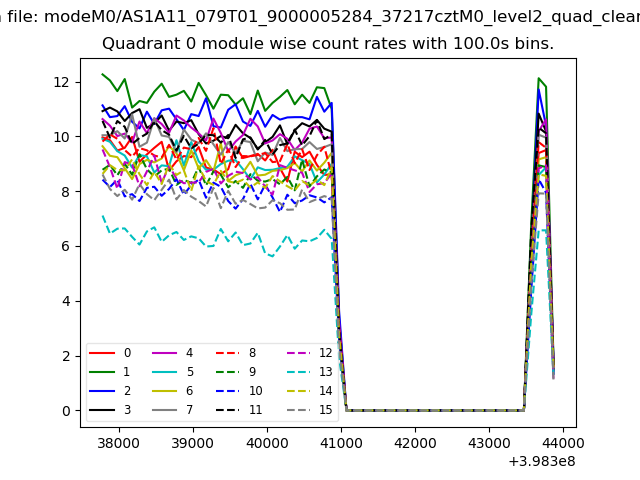 |
 |
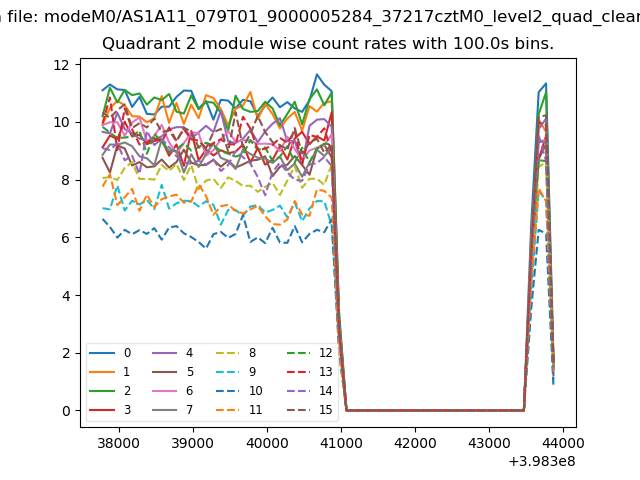
| Module-wise count rates for Quadrant B Data is divided into 100 sec bins |
 |
 |
| Module-wise count rates for Quadrant C Data is divided into 100 sec bins |
 |
 |
| Module-wise count rates for Quadrant D Data is divided into 100 sec bins |
 |
 |
| Parameter | Plot |
|---|---|
| CZT HV Monitor | 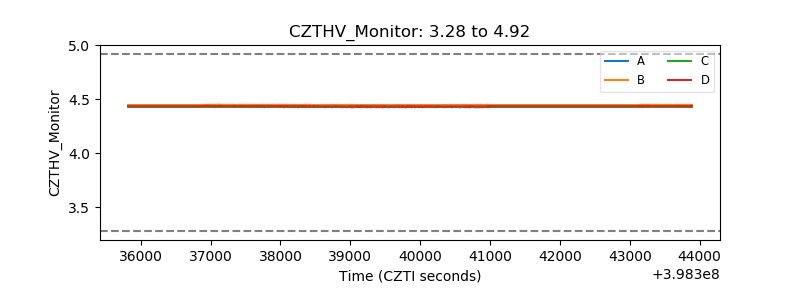 |
| D_VDD | 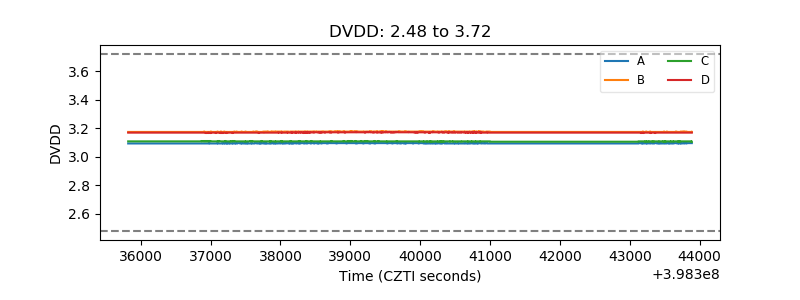 |
| Temperature 1 | 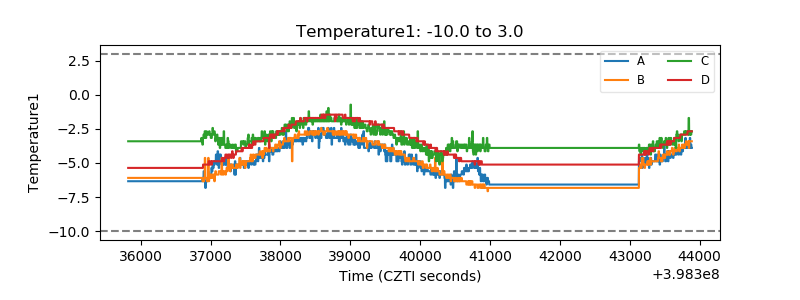 |
| Veto HV Monitor | 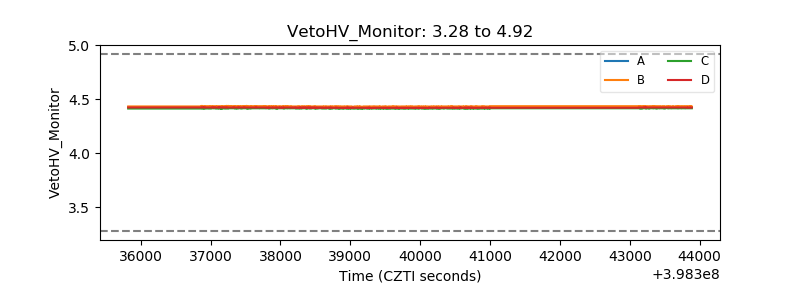 |
| Veto LLD | 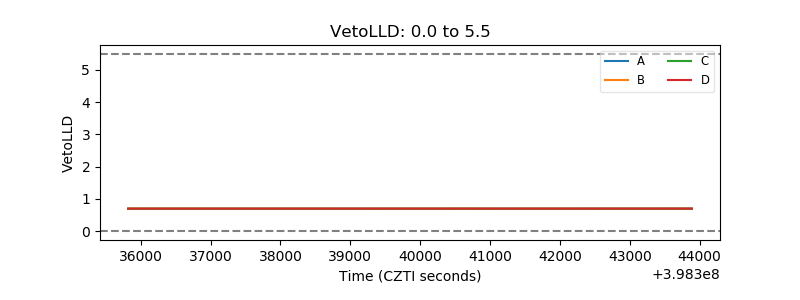 |
| Alpha Counter | 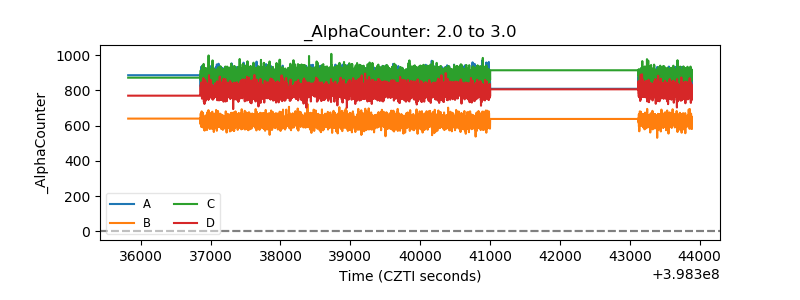 |
| _CPM_Rate | 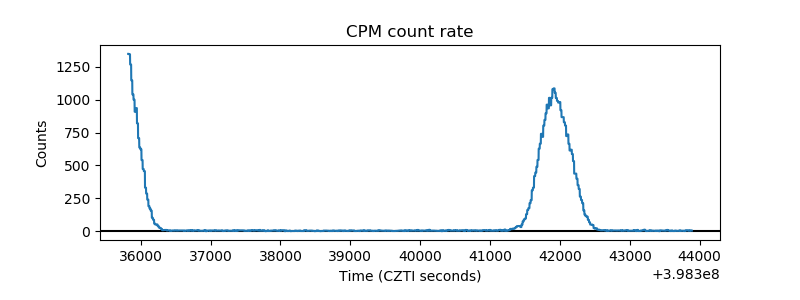 |
| CZT Counter | 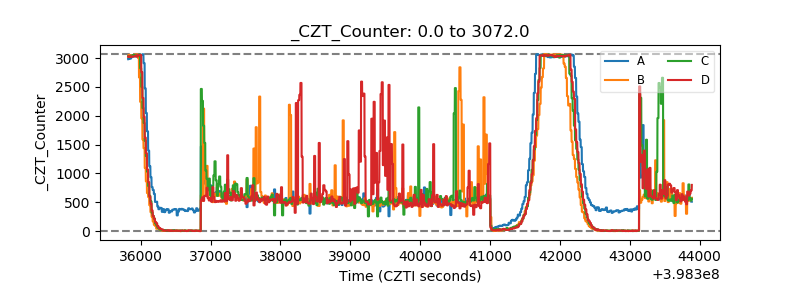 |
| +2.5 Volts monitor | 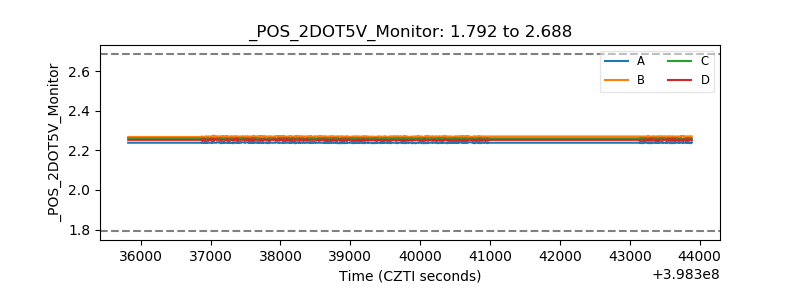 |
| +5 Volts monitor |  |
| _ROLL_ROT | 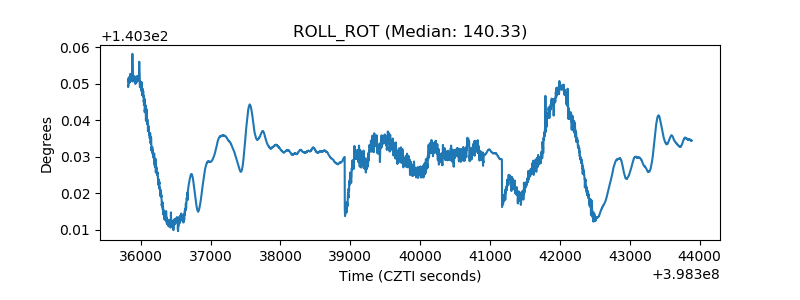 |
| _Roll_DEC | 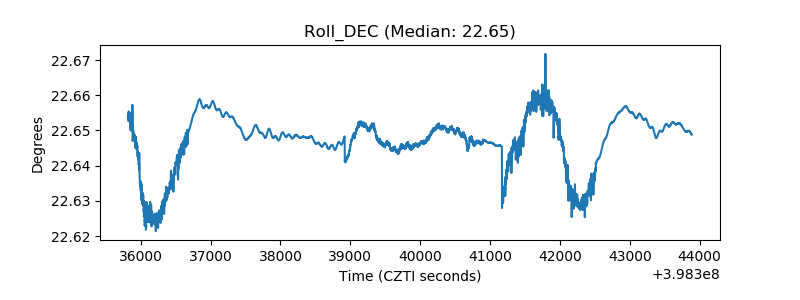 |
| _Roll_RA | 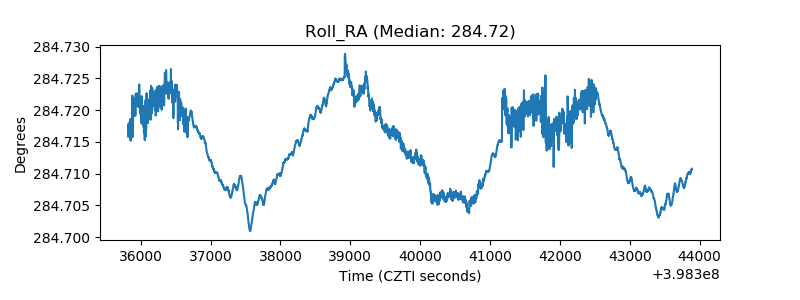 |
| Veto Counter | 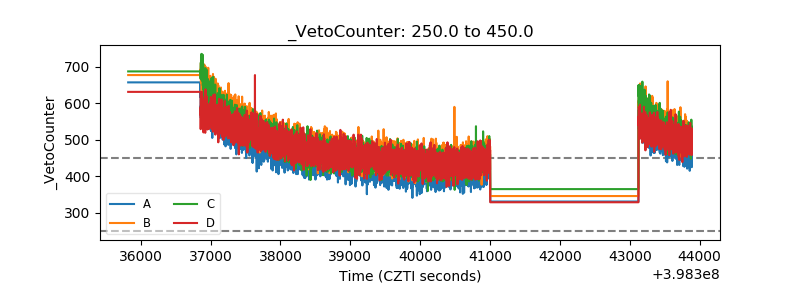 |