| Param | Original file | Final file |
|---|---|---|
| Filename | modeM0/AS1A11_079T01_9000005284_37218cztM0_level2.evt | modeM0/AS1A11_079T01_9000005284_37218cztM0_level2_quad_clean.evt |
| Size (bytes) | 460,546,560 | 96,102,720 |
| Size | 439.2 MB | 91.7 MB |
| Events in quadrant A | 3,164,522 | 652,138 |
| Events in quadrant B | 3,055,988 | 658,103 |
| Events in quadrant C | 3,383,484 | 640,721 |
| Events in quadrant D | 3,988,306 | 592,715 |
| Mode M9 | |||
|---|---|---|---|
| Quadrant | BADHDUFLAG | Total packets | Discarded packets |
| A | 0 | 41 | 0 |
| B | 0 | 41 | 0 |
| C | 0 | 41 | 0 |
| D | 0 | 42 | 0 |
| Mode SS | |||
|---|---|---|---|
| Quadrant | BADHDUFLAG | Total packets | Discarded packets |
| A | 0 | 106 | 0 |
| B | 0 | 106 | 0 |
| C | 0 | 106 | 0 |
| D | 0 | 106 | 0 |
| Mode M0 | |||
|---|---|---|---|
| Quadrant | BADHDUFLAG | Total packets | Discarded packets |
| A | 0 | 12495 | 3 |
| B | 0 | 12250 | 2 |
| C | 0 | 13108 | 2 |
| D | 0 | 15194 | 2 |
| Quadrant | Total seconds | Saturated seconds | Saturation percentage |
|---|---|---|---|
| A | 5239 | 95 | 1.813323% |
| B | 5239 | 119 | 2.271426% |
| C | 5239 | 146 | 2.786791% |
| D | 5239 | 327 | 6.241649% |
Noise dominated data is calculated using 1-second bins in cleaned event files. If a bin has >2000 counts, and if more than 50% of those come from <1% of pixels, then it is considered to be noise-dominated and hence unusable.
| Quadrant | # 1 sec bins | Bins with >0 counts | Bins with >2000 counts | High rate bins dominated by noise | Noise dominated (total time) | Noise dominated (detector-on time) | Marked lightcurve |
|---|---|---|---|---|---|---|---|
| A | 7361 | 5240 | 80 | 80 | 1.09% | 1.53% | 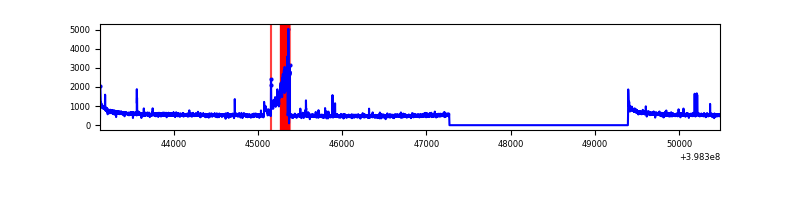 |
| B | 7361 | 5240 | 65 | 65 | 0.88% | 1.24% | 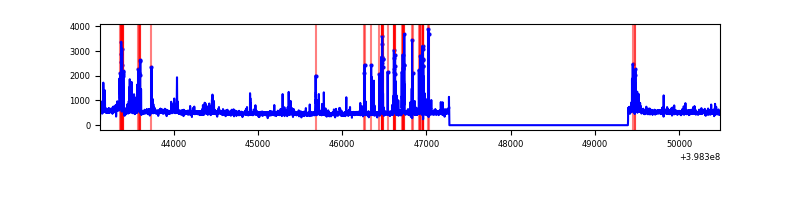 |
| C | 7361 | 5240 | 112 | 112 | 1.52% | 2.14% | 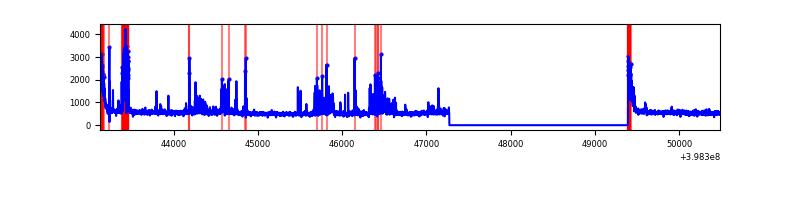 |
| D | 7361 | 5240 | 262 | 262 | 3.56% | 5.00% | 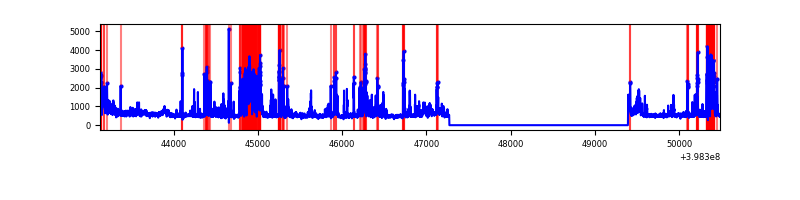 |
Top three noisy pixels from each quadrant. If the there are fewer than three noisy pixels in the level2.evt file, extra rows are filled as -1
| Pixel properties | Quadrant properties | ||||||
|---|---|---|---|---|---|---|---|
| Quadrant | DetID | PixID | Counts | Sigma | Mean | Median | Sigma |
| A | 15 | 237 | 313128 | 2356.98 | 661 | 649 | 132.6 |
| A | 10 | 83 | 261392 | 1966.74 | 661 | 649 | 132.6 |
| A | 9 | 143 | 11260 | 80.04 | 661 | 649 | 132.6 |
| B | 5 | 172 | 403691 | 3288.13 | 646 | 630 | 122.6 |
| B | 0 | 213 | 79208 | 641.03 | 646 | 630 | 122.6 |
| B | 12 | 111 | 14860 | 116.09 | 646 | 630 | 122.6 |
| C | 14 | 254 | 492900 | 3370.36 | 631 | 636 | 146.1 |
| C | 15 | 214 | 226080 | 1543.54 | 631 | 636 | 146.1 |
| C | 0 | 10 | 186139 | 1270.07 | 631 | 636 | 146.1 |
| D | 2 | 249 | 1026081 | 6777.36 | 627 | 614 | 151.3 |
| D | 1 | 52 | 237016 | 1562.39 | 627 | 614 | 151.3 |
| D | 13 | 249 | 102764 | 675.11 | 627 | 614 | 151.3 |
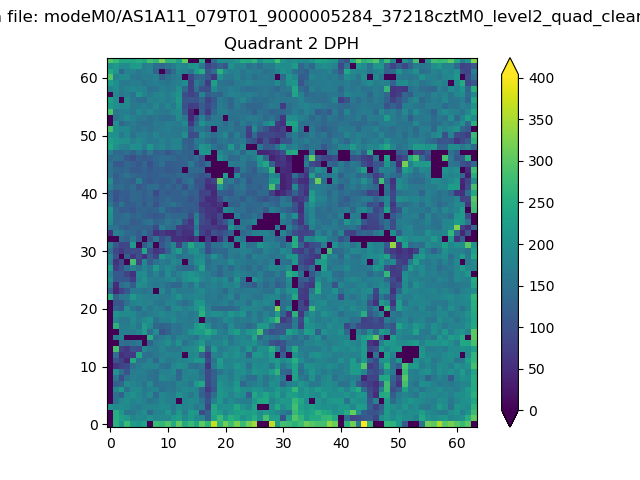
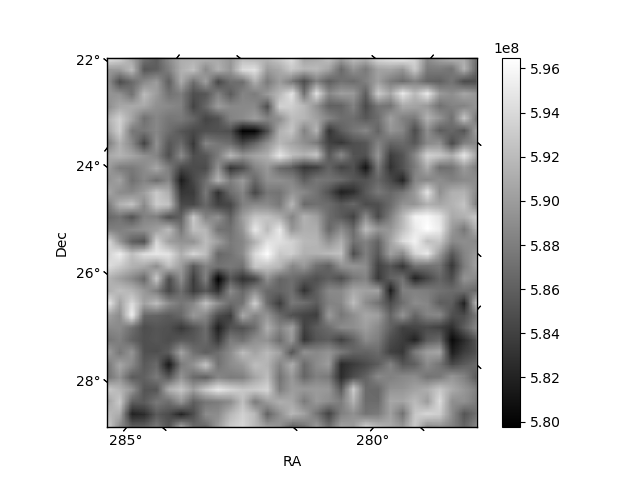
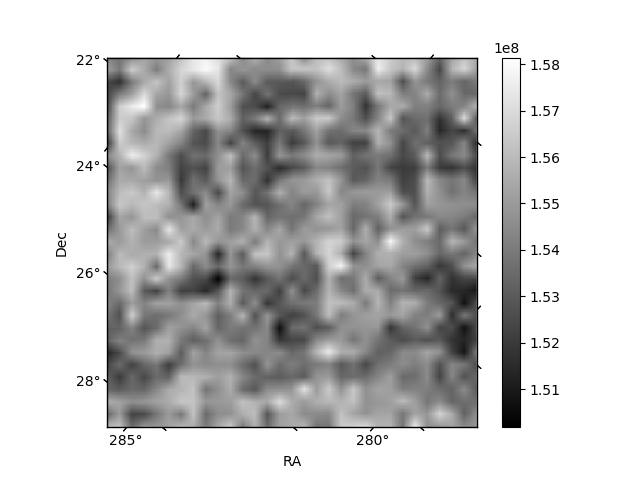
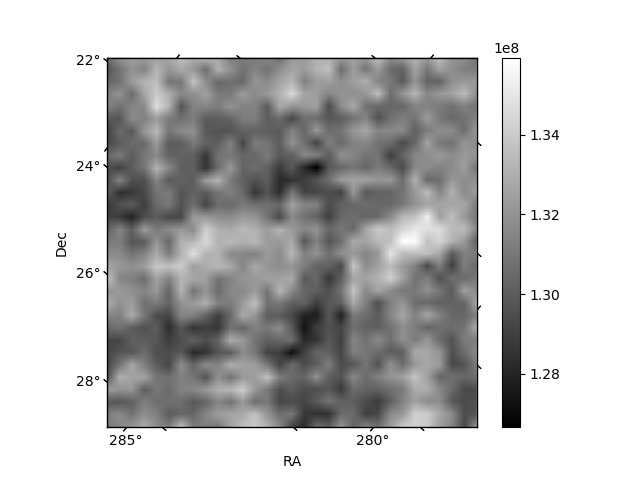
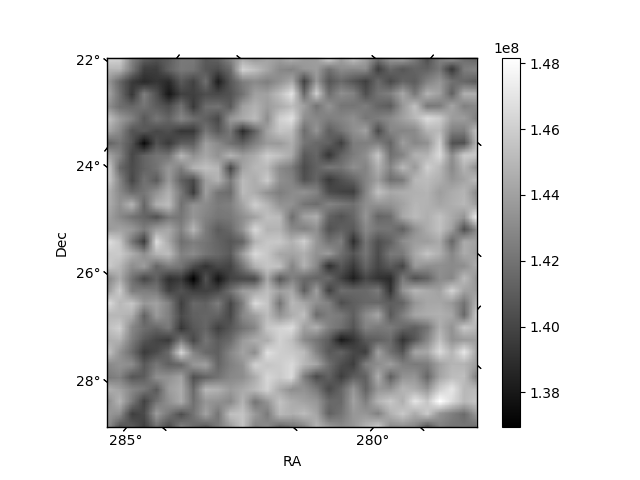
Histogram calculated using DETX and DETY for each event in the final _common_clean file
| Quadrant A | 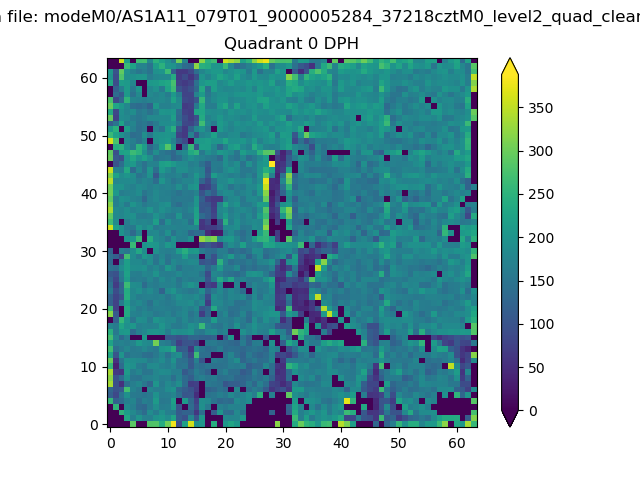 |
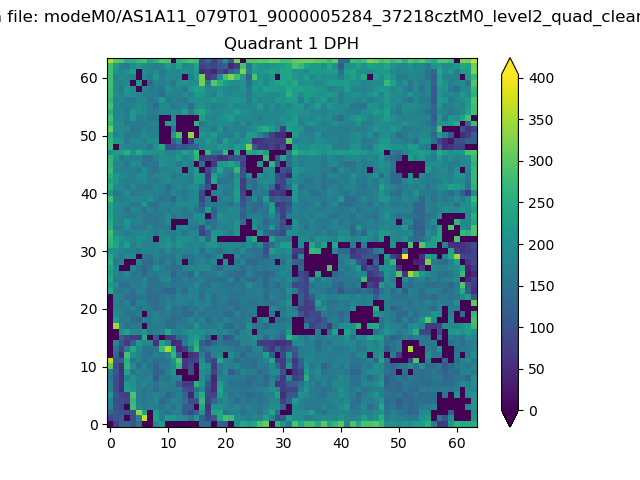 |
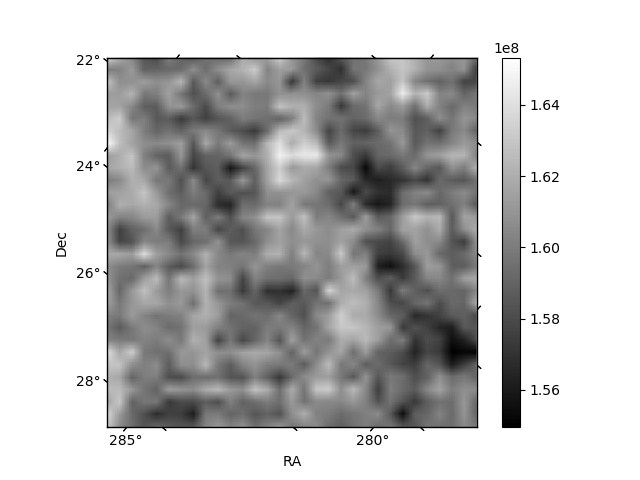
Quadrant B |
|---|---|---|---|
| Quadrant D | 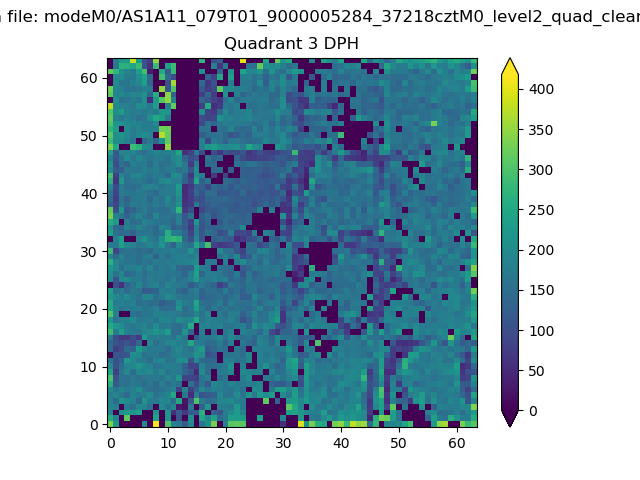 |
 |
Quadrant C |
| Plot type | Count rate plots | Images |
|---|---|---|
| Comparison with Poisson distribution Blue bars denote a histogram of data divided into 1 sec bins. Red curve is a Poisson curve with rate = median count rate of data. |
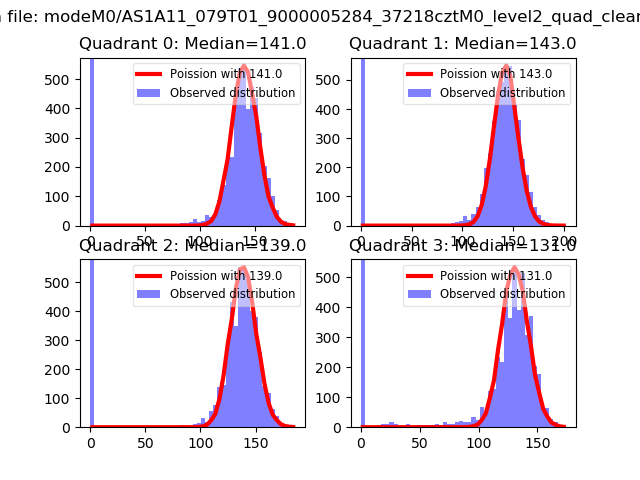 |
 |
| Quadrant-wise count rates Data is divided into 100 sec bins |
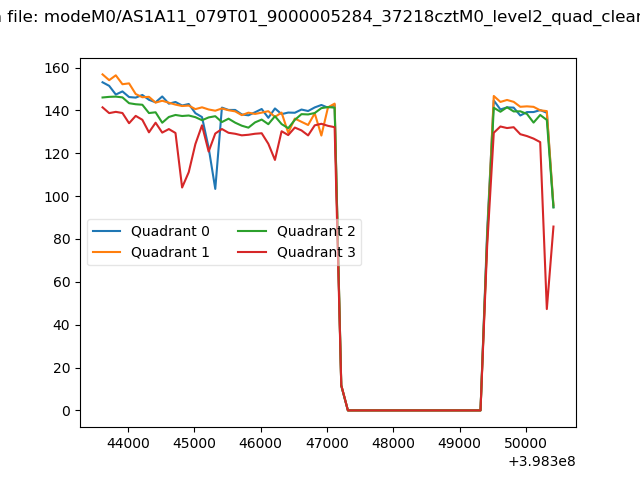 |
|
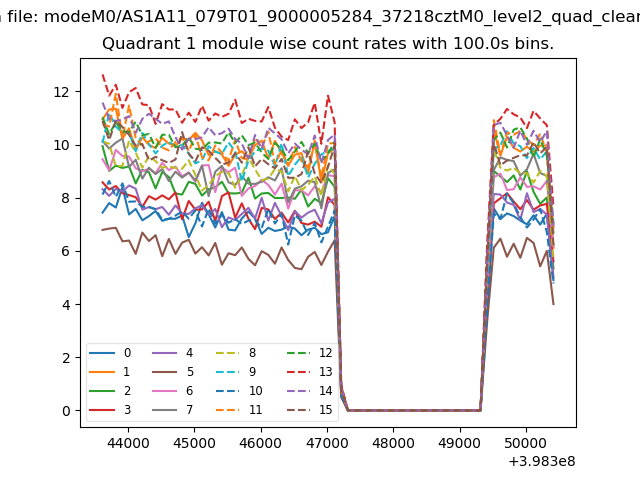
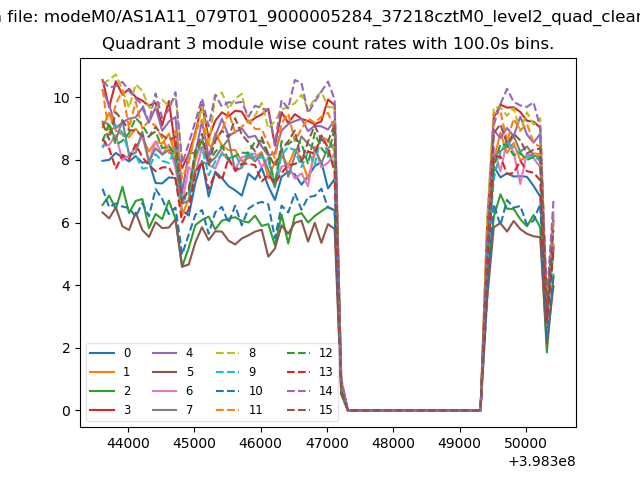
| Module-wise count rates for Quadrant A Data is divided into 100 sec bins |
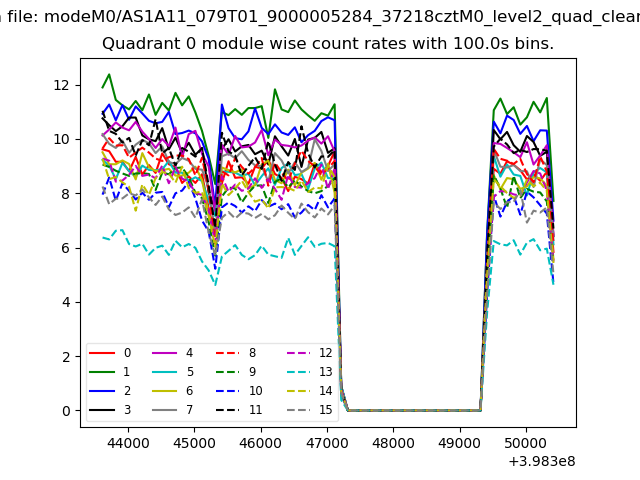 |
 |
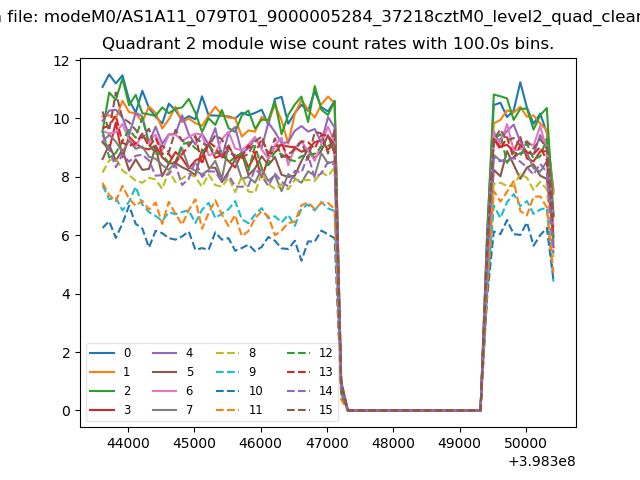
| Module-wise count rates for Quadrant B Data is divided into 100 sec bins |
 |
 |
| Module-wise count rates for Quadrant C Data is divided into 100 sec bins |
 |
 |
| Module-wise count rates for Quadrant D Data is divided into 100 sec bins |
 |
 |
| Parameter | Plot |
|---|---|
| CZT HV Monitor | 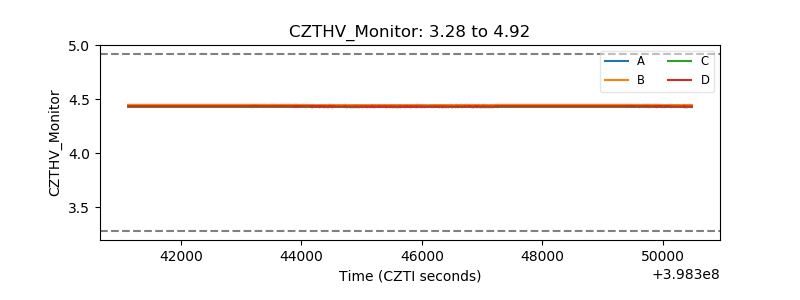 |
| D_VDD | 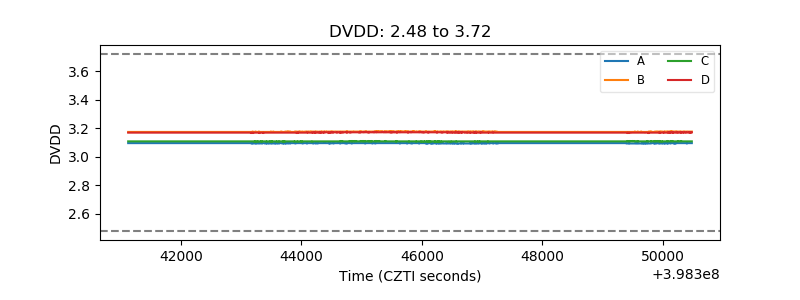 |
| Temperature 1 | 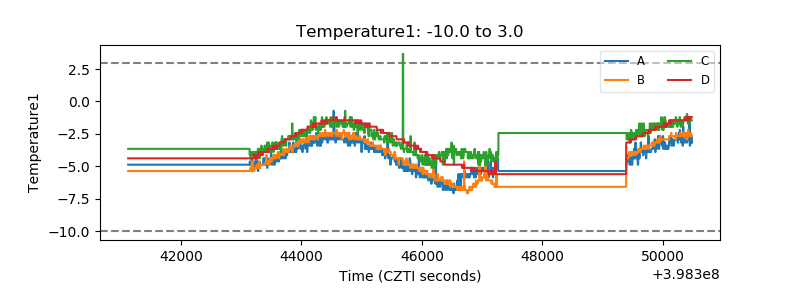 |
| Veto HV Monitor | 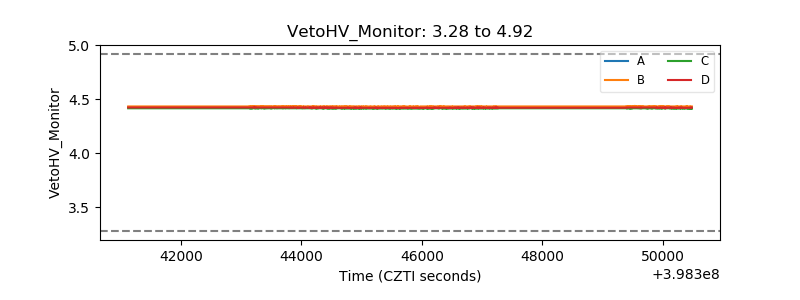 |
| Veto LLD | 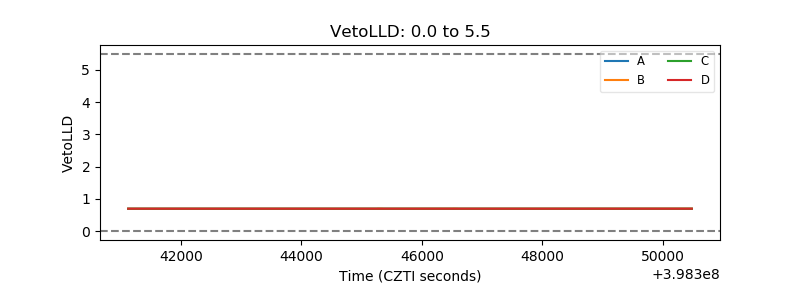 |
| Alpha Counter | 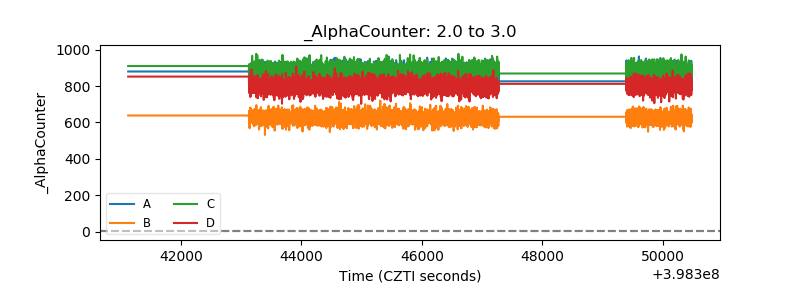 |
| _CPM_Rate | 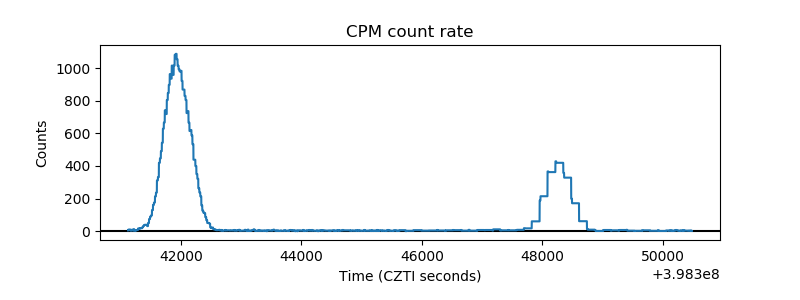 |
| CZT Counter | 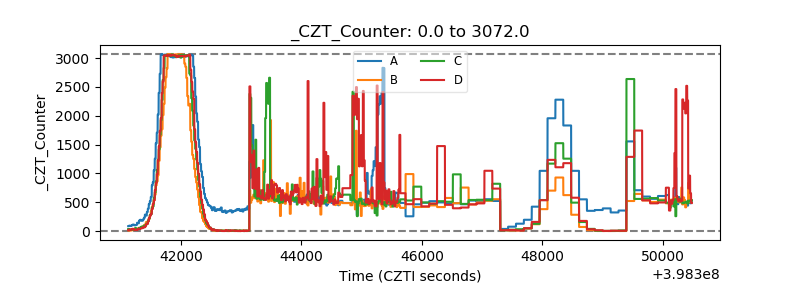 |
| +2.5 Volts monitor | 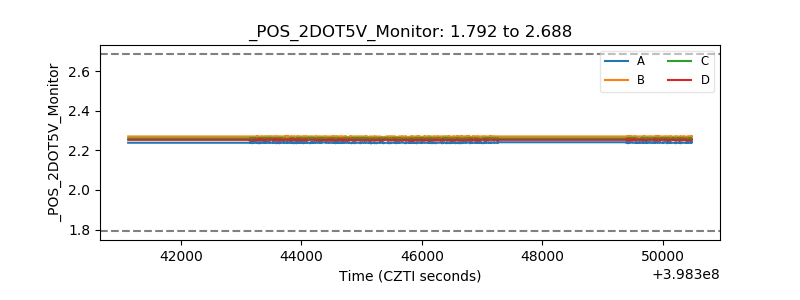 |
| +5 Volts monitor | 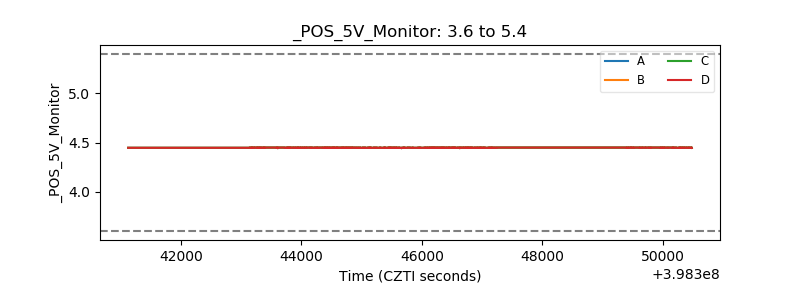 |
| _ROLL_ROT | 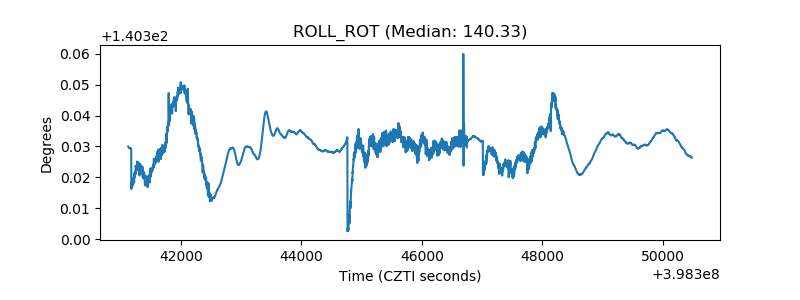 |
| _Roll_DEC | 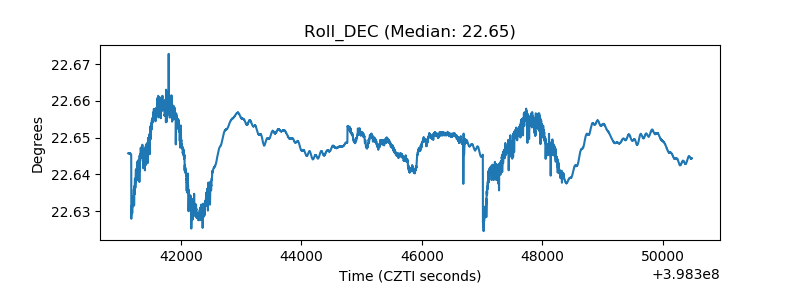 |
| _Roll_RA | 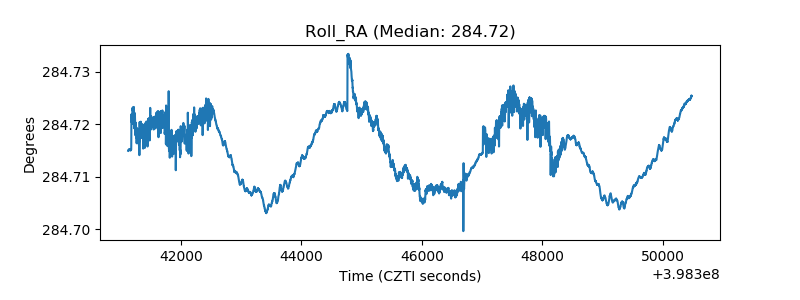 |
| Veto Counter | 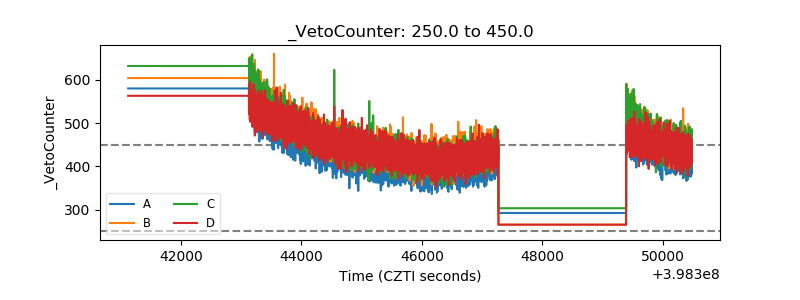 |