| Param | Original file | Final file |
|---|---|---|
| Filename | modeM0/AS1A11_079T01_9000005284_37219cztM0_level2.evt | modeM0/AS1A11_079T01_9000005284_37219cztM0_level2_quad_clean.evt |
| Size (bytes) | 475,865,280 | 89,003,520 |
| Size | 453.8 MB | 84.9 MB |
| Events in quadrant A | 2,726,914 | 611,778 |
| Events in quadrant B | 2,775,523 | 612,625 |
| Events in quadrant C | 3,120,259 | 597,460 |
| Events in quadrant D | 5,436,423 | 509,292 |
| Mode M9 | |||
|---|---|---|---|
| Quadrant | BADHDUFLAG | Total packets | Discarded packets |
| A | 0 | 26 | 0 |
| B | 0 | 26 | 0 |
| C | 0 | 26 | 0 |
| D | 0 | 27 | 0 |
| Mode SS | |||
|---|---|---|---|
| Quadrant | BADHDUFLAG | Total packets | Discarded packets |
| A | 0 | 106 | 0 |
| B | 0 | 106 | 0 |
| C | 0 | 106 | 0 |
| D | 0 | 106 | 0 |
| Mode M0 | |||
|---|---|---|---|
| Quadrant | BADHDUFLAG | Total packets | Discarded packets |
| A | 0 | 11254 | 3 |
| B | 0 | 11448 | 2 |
| C | 0 | 12263 | 2 |
| D | 0 | 19541 | 2 |
| Quadrant | Total seconds | Saturated seconds | Saturation percentage |
|---|---|---|---|
| A | 5194 | 19 | 0.365807% |
| B | 5194 | 50 | 0.962649% |
| C | 5194 | 87 | 1.675010% |
| D | 5194 | 926 | 17.828263% |
Noise dominated data is calculated using 1-second bins in cleaned event files. If a bin has >2000 counts, and if more than 50% of those come from <1% of pixels, then it is considered to be noise-dominated and hence unusable.
| Quadrant | # 1 sec bins | Bins with >0 counts | Bins with >2000 counts | High rate bins dominated by noise | Noise dominated (total time) | Noise dominated (detector-on time) | Marked lightcurve |
|---|---|---|---|---|---|---|---|
| A | 7196 | 5195 | 5 | 5 | 0.07% | 0.10% | 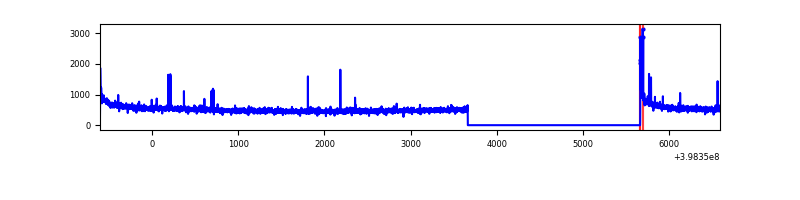 |
| B | 7196 | 5195 | 21 | 21 | 0.29% | 0.40% | 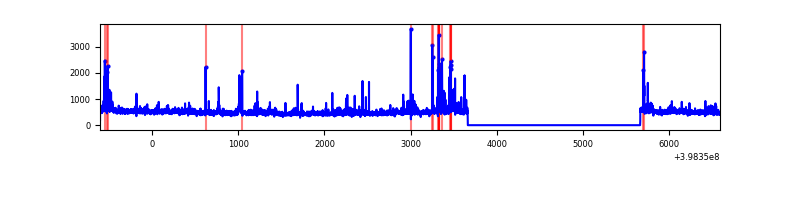 |
| C | 7196 | 5195 | 69 | 69 | 0.96% | 1.33% | 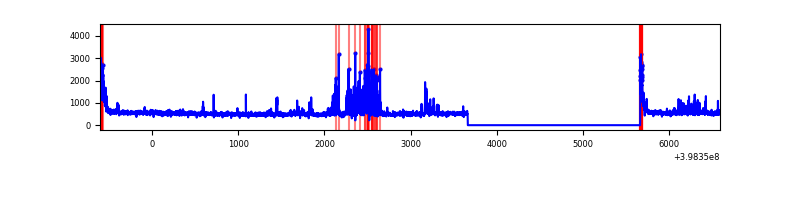 |
| D | 7196 | 5195 | 822 | 822 | 11.42% | 15.82% | 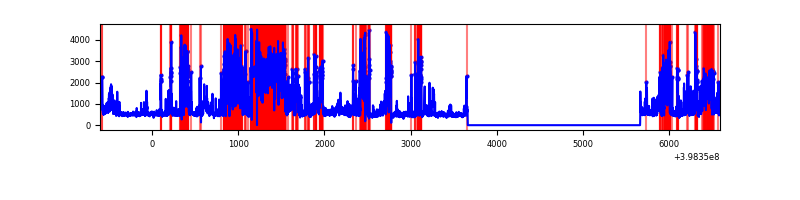 |
Top three noisy pixels from each quadrant. If the there are fewer than three noisy pixels in the level2.evt file, extra rows are filled as -1
| Pixel properties | Quadrant properties | ||||||
|---|---|---|---|---|---|---|---|
| Quadrant | DetID | PixID | Counts | Sigma | Mean | Median | Sigma |
| A | 10 | 83 | 257545 | 2024.85 | 626 | 615 | 126.9 |
| A | 9 | 143 | 32811 | 253.73 | 626 | 615 | 126.9 |
| A | 13 | 254 | 7267 | 52.42 | 626 | 615 | 126.9 |
| B | 5 | 172 | 146247 | 1227.14 | 614 | 599 | 118.7 |
| B | 0 | 213 | 125904 | 1055.74 | 614 | 599 | 118.7 |
| B | 5 | 184 | 32788 | 271.2 | 614 | 599 | 118.7 |
| C | 14 | 254 | 285853 | 2015.29 | 604 | 610 | 141.5 |
| C | 15 | 214 | 223326 | 1573.53 | 604 | 610 | 141.5 |
| C | 0 | 10 | 161903 | 1139.56 | 604 | 610 | 141.5 |
| D | 2 | 249 | 1961175 | 14216.98 | 562 | 547 | 137.9 |
| D | 12 | 233 | 366489 | 2653.53 | 562 | 547 | 137.9 |
| D | 12 | 217 | 308065 | 2229.88 | 562 | 547 | 137.9 |
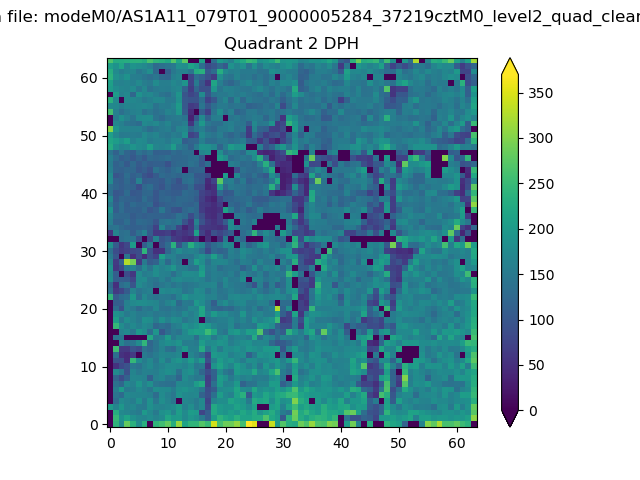
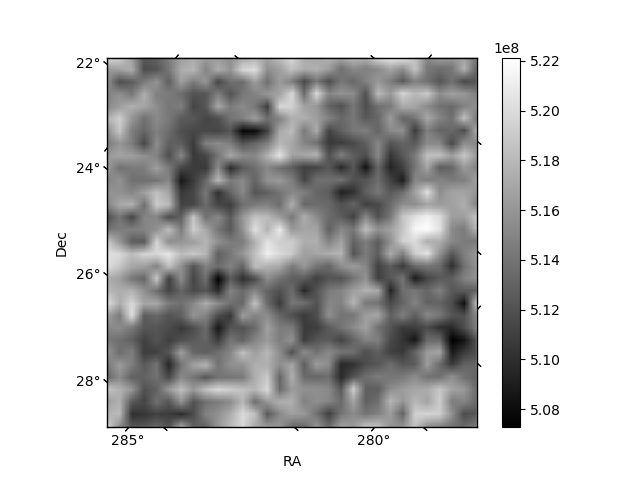
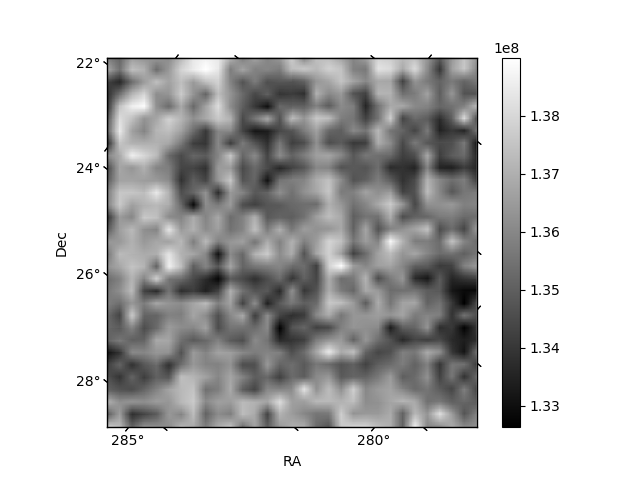
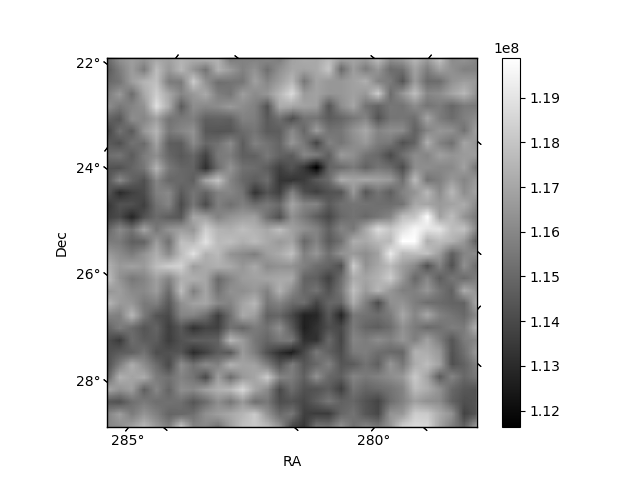
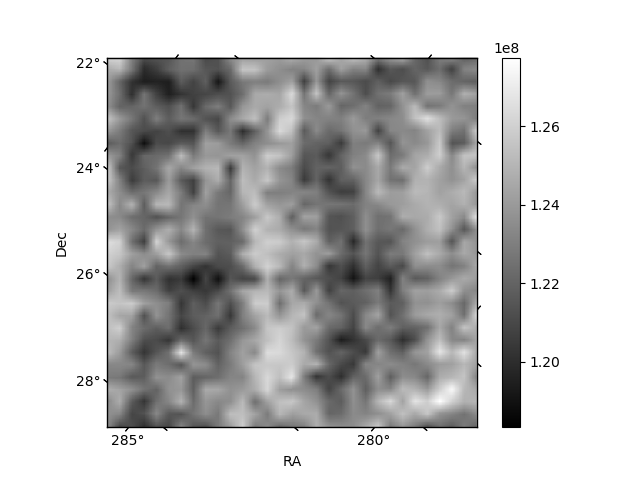
Histogram calculated using DETX and DETY for each event in the final _common_clean file
| Quadrant A | 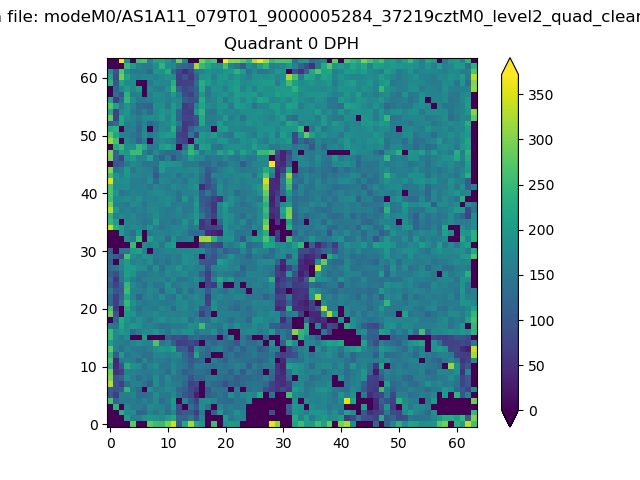 |
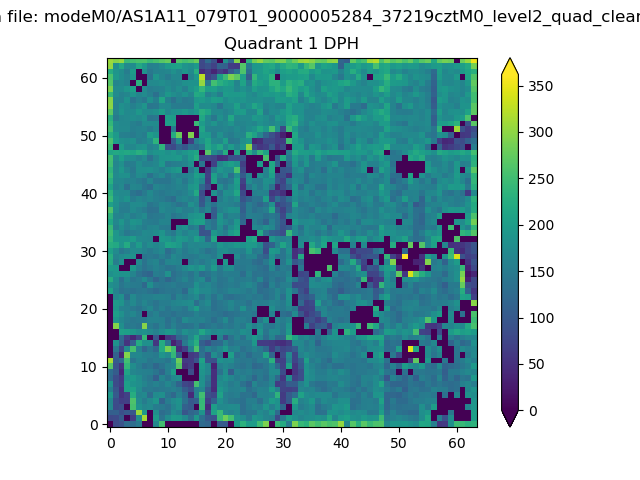 |
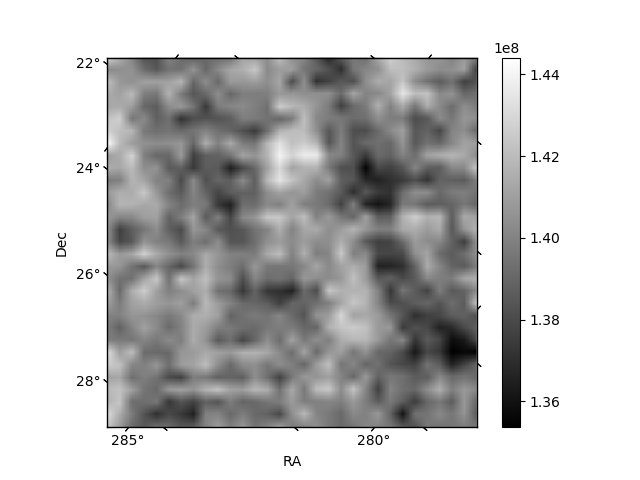
Quadrant B |
|---|---|---|---|
| Quadrant D | 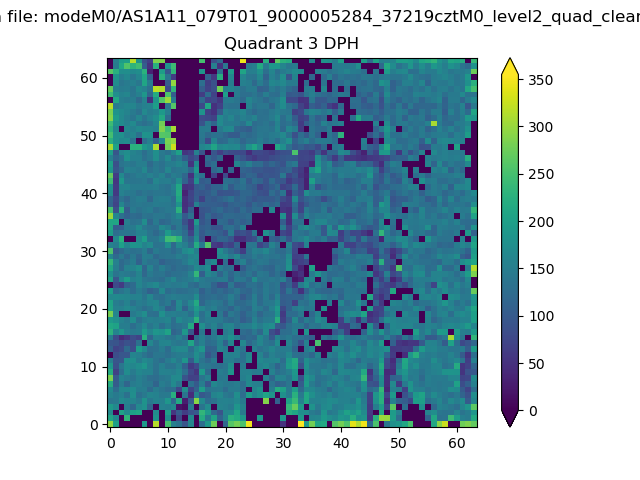 |
 |
Quadrant C |
| Plot type | Count rate plots | Images |
|---|---|---|
| Comparison with Poisson distribution Blue bars denote a histogram of data divided into 1 sec bins. Red curve is a Poisson curve with rate = median count rate of data. |
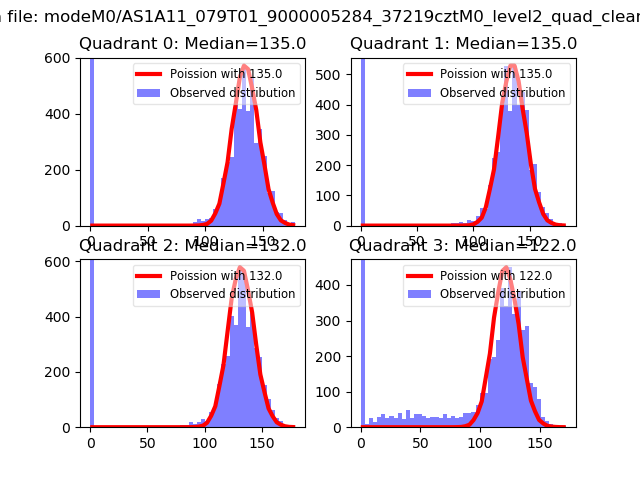 |
 |
| Quadrant-wise count rates Data is divided into 100 sec bins |
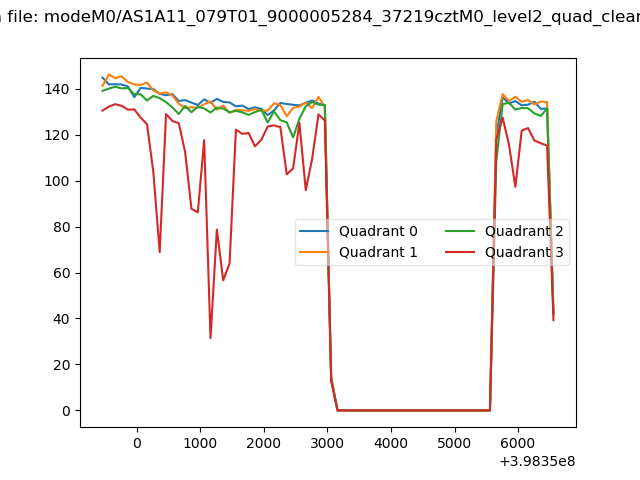 |
|
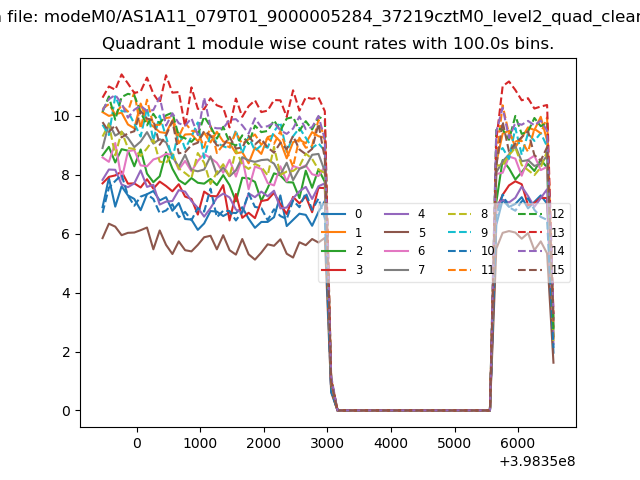
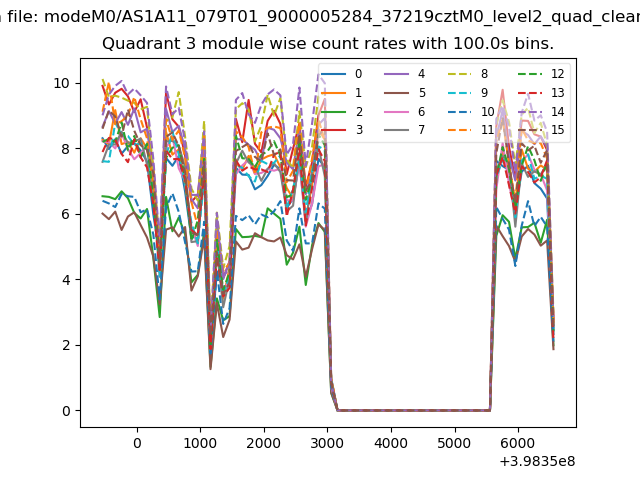
| Module-wise count rates for Quadrant A Data is divided into 100 sec bins |
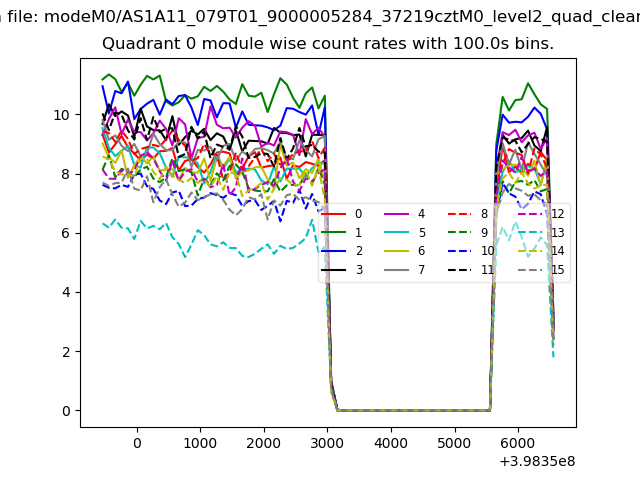 |
 |
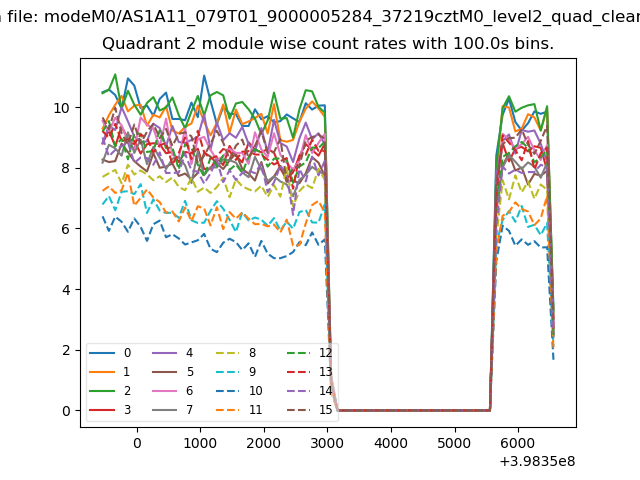
| Module-wise count rates for Quadrant B Data is divided into 100 sec bins |
 |
 |
| Module-wise count rates for Quadrant C Data is divided into 100 sec bins |
 |
 |
| Module-wise count rates for Quadrant D Data is divided into 100 sec bins |
 |
 |
| Parameter | Plot |
|---|---|
| CZT HV Monitor | 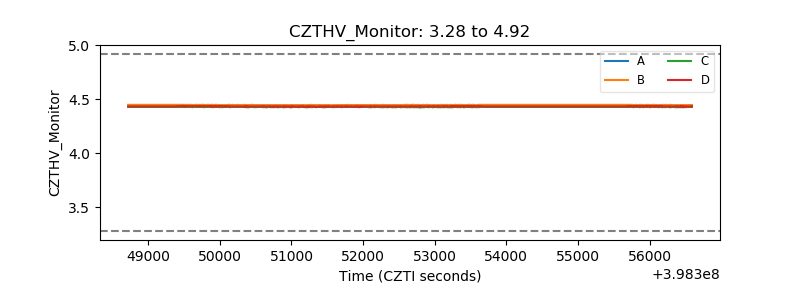 |
| D_VDD | 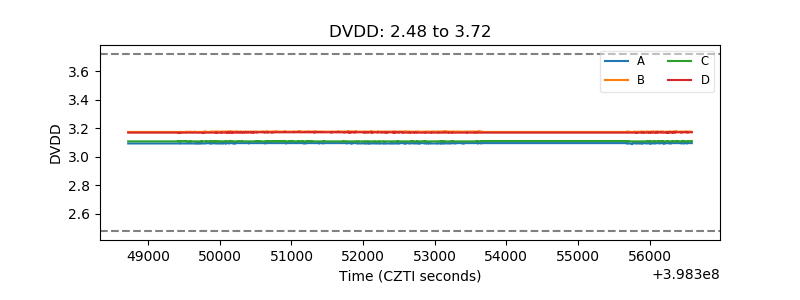 |
| Temperature 1 | 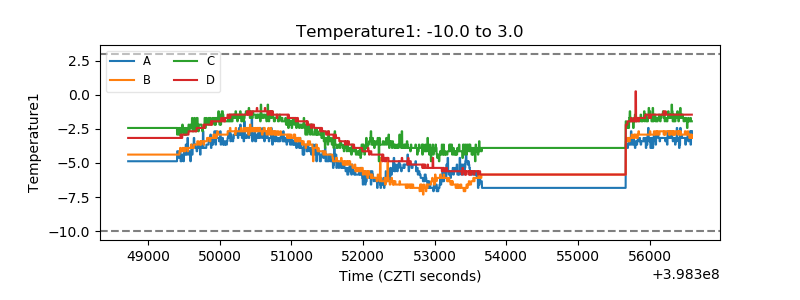 |
| Veto HV Monitor | 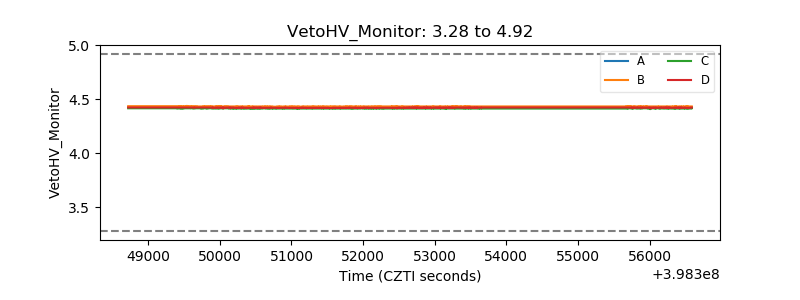 |
| Veto LLD | 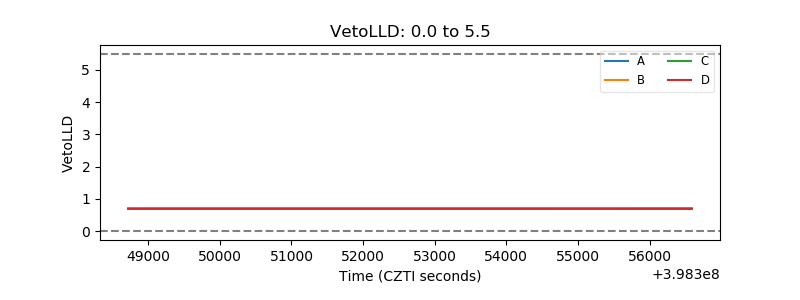 |
| Alpha Counter | 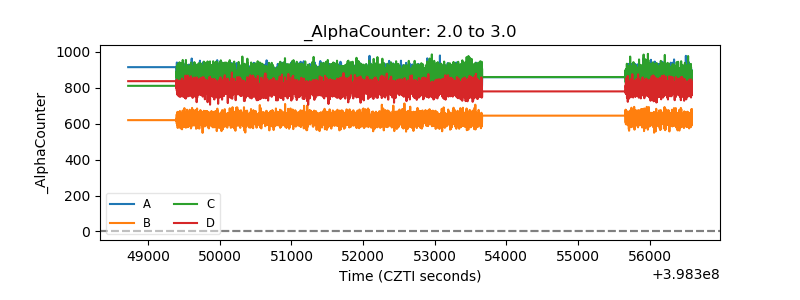 |
| _CPM_Rate | 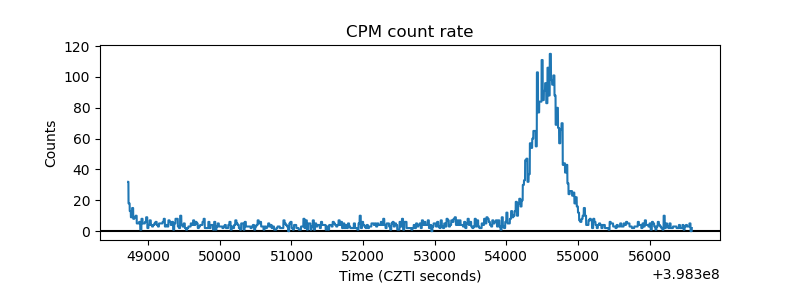 |
| CZT Counter | 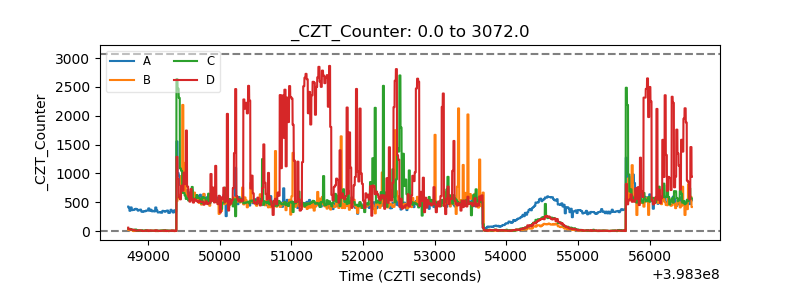 |
| +2.5 Volts monitor | 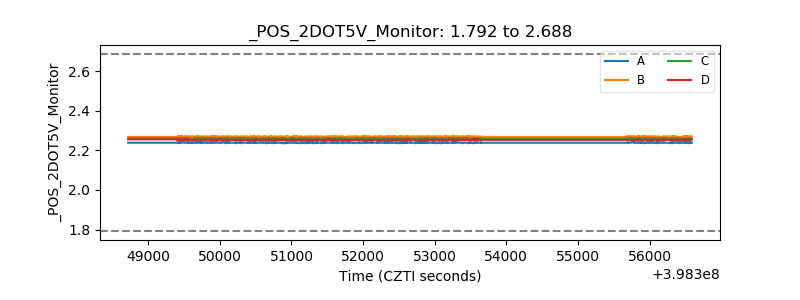 |
| +5 Volts monitor | 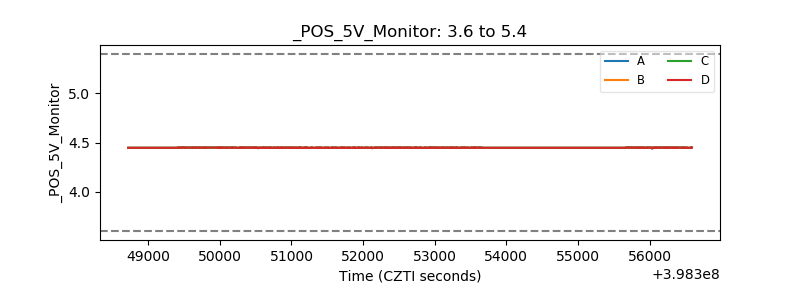 |
| _ROLL_ROT | 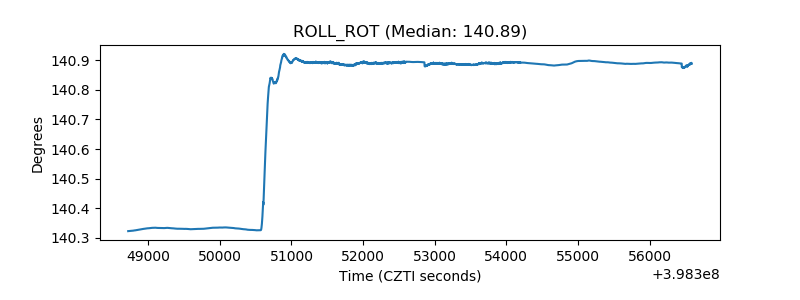 |
| _Roll_DEC | 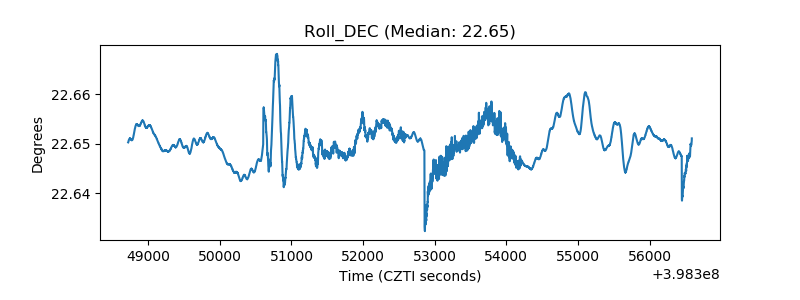 |
| _Roll_RA |  |
| Veto Counter | 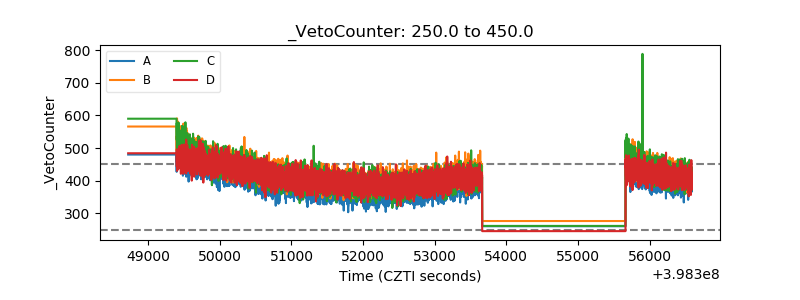 |