| Param | Original file | Final file |
|---|---|---|
| Filename | modeM0/AS1A11_079T01_9000005284_37220cztM0_level2.evt | modeM0/AS1A11_079T01_9000005284_37220cztM0_level2_quad_clean.evt |
| Size (bytes) | 446,307,840 | 80,354,880 |
| Size | 425.6 MB | 76.6 MB |
| Events in quadrant A | 2,739,722 | 527,233 |
| Events in quadrant B | 2,732,698 | 524,748 |
| Events in quadrant C | 3,082,003 | 517,324 |
| Events in quadrant D | 4,592,717 | 483,108 |
| Mode M9 | |||
|---|---|---|---|
| Quadrant | BADHDUFLAG | Total packets | Discarded packets |
| A | 0 | 17 | 0 |
| B | 0 | 17 | 0 |
| C | 0 | 17 | 0 |
| D | 0 | 17 | 0 |
| Mode SS | |||
|---|---|---|---|
| Quadrant | BADHDUFLAG | Total packets | Discarded packets |
| A | 0 | 110 | 0 |
| B | 0 | 110 | 0 |
| C | 0 | 110 | 0 |
| D | 0 | 110 | 0 |
| Mode M0 | |||
|---|---|---|---|
| Quadrant | BADHDUFLAG | Total packets | Discarded packets |
| A | 0 | 11548 | 2 |
| B | 0 | 11642 | 1 |
| C | 0 | 12473 | 1 |
| D | 0 | 17397 | 1 |
| Quadrant | Total seconds | Saturated seconds | Saturation percentage |
|---|---|---|---|
| A | 5442 | 11 | 0.202132% |
| B | 5442 | 37 | 0.679897% |
| C | 5442 | 54 | 0.992282% |
| D | 5442 | 383 | 7.037854% |
Noise dominated data is calculated using 1-second bins in cleaned event files. If a bin has >2000 counts, and if more than 50% of those come from <1% of pixels, then it is considered to be noise-dominated and hence unusable.
| Quadrant | # 1 sec bins | Bins with >0 counts | Bins with >2000 counts | High rate bins dominated by noise | Noise dominated (total time) | Noise dominated (detector-on time) | Marked lightcurve |
|---|---|---|---|---|---|---|---|
| A | 7114 | 5443 | 5 | 5 | 0.07% | 0.09% |  |
| B | 7114 | 5443 | 29 | 29 | 0.41% | 0.53% |  |
| C | 7114 | 5443 | 39 | 39 | 0.55% | 0.72% |  |
| D | 7114 | 5443 | 385 | 385 | 5.41% | 7.07% |  |
Top three noisy pixels from each quadrant. If the there are fewer than three noisy pixels in the level2.evt file, extra rows are filled as -1
| Pixel properties | Quadrant properties | ||||||
|---|---|---|---|---|---|---|---|
| Quadrant | DetID | PixID | Counts | Sigma | Mean | Median | Sigma |
| A | 10 | 83 | 242348 | 1875.96 | 634 | 620 | 128.9 |
| A | 13 | 248 | 24877 | 188.25 | 634 | 620 | 128.9 |
| A | 15 | 222 | 11426 | 83.86 | 634 | 620 | 128.9 |
| B | 5 | 172 | 162789 | 1340.45 | 626 | 612 | 121.0 |
| B | 0 | 213 | 48591 | 396.56 | 626 | 612 | 121.0 |
| B | 0 | 155 | 23995 | 193.27 | 626 | 612 | 121.0 |
| C | 15 | 214 | 233986 | 1608.85 | 615 | 621 | 145.1 |
| C | 10 | 49 | 198980 | 1367.52 | 615 | 621 | 145.1 |
| C | 14 | 254 | 94741 | 648.88 | 615 | 621 | 145.1 |
| D | 2 | 249 | 756605 | 5092.87 | 605 | 589 | 148.4 |
| D | 10 | 253 | 645486 | 4344.32 | 605 | 589 | 148.4 |
| D | 12 | 217 | 478643 | 3220.39 | 605 | 589 | 148.4 |
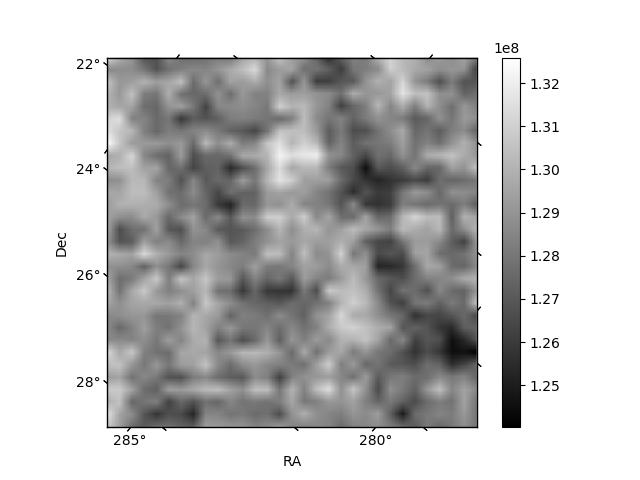
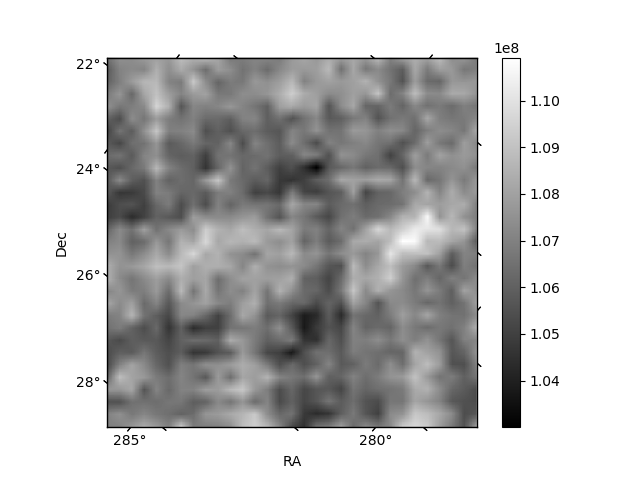
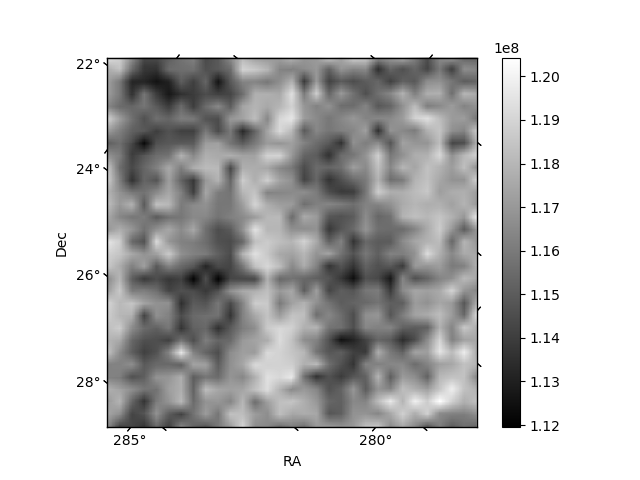
Histogram calculated using DETX and DETY for each event in the final _common_clean file
| Quadrant A | 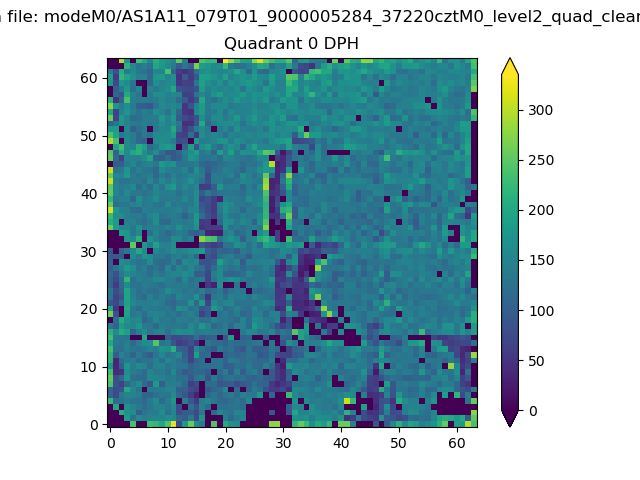 |
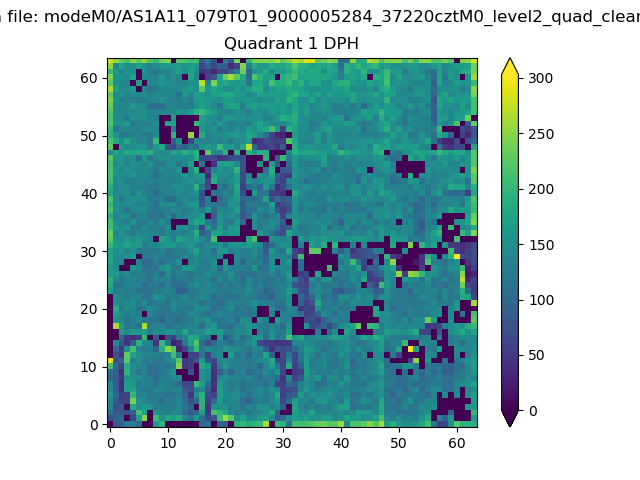 |
Quadrant B |
|---|---|---|---|
| Quadrant D | 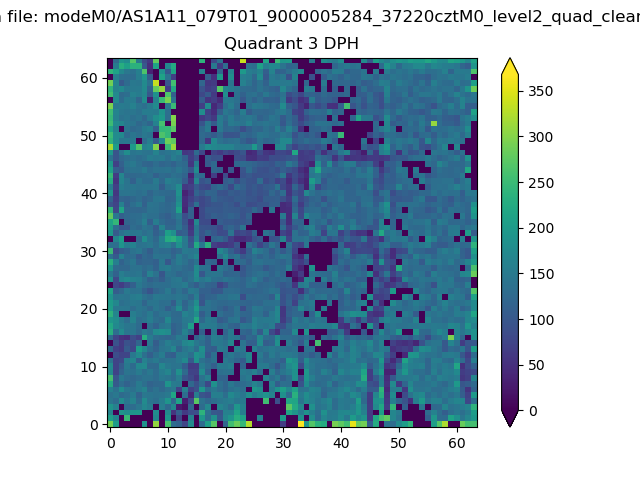 |
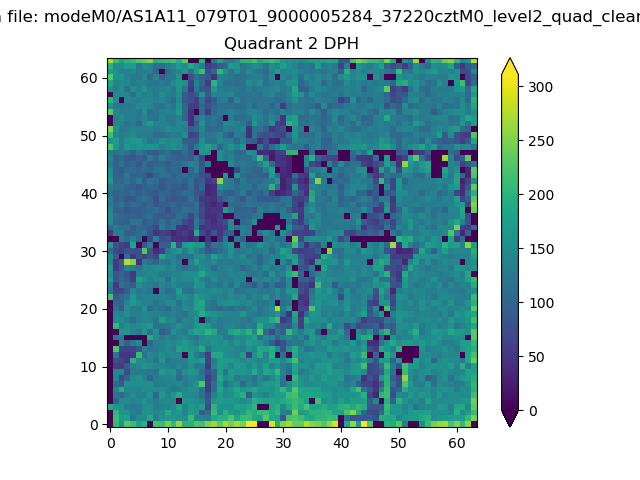 |
Quadrant C |
| Plot type | Count rate plots | Images |
|---|---|---|
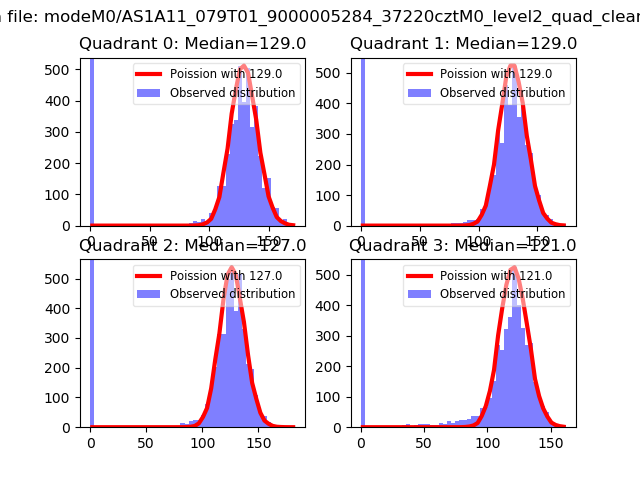
| Comparison with Poisson distribution Blue bars denote a histogram of data divided into 1 sec bins. Red curve is a Poisson curve with rate = median count rate of data. |
 |
 |
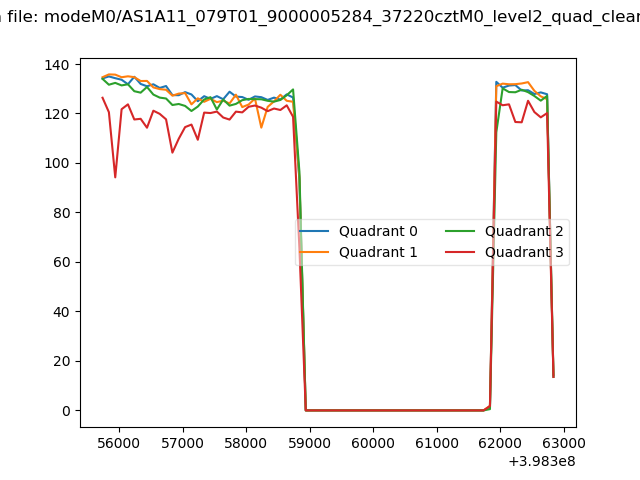
| Quadrant-wise count rates Data is divided into 100 sec bins |
 |
|
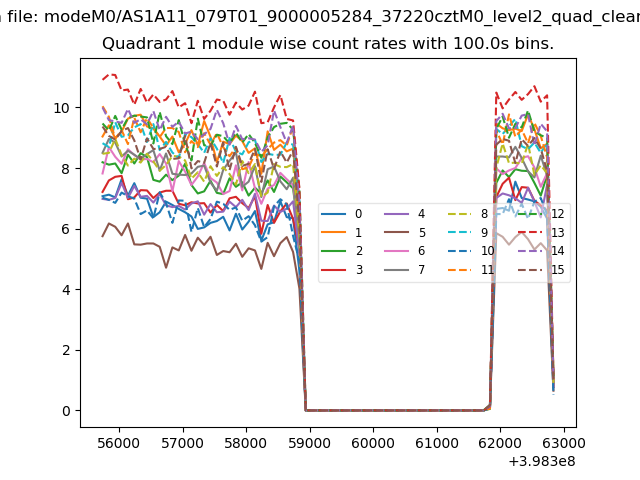
| Module-wise count rates for Quadrant A Data is divided into 100 sec bins |
 |
 |
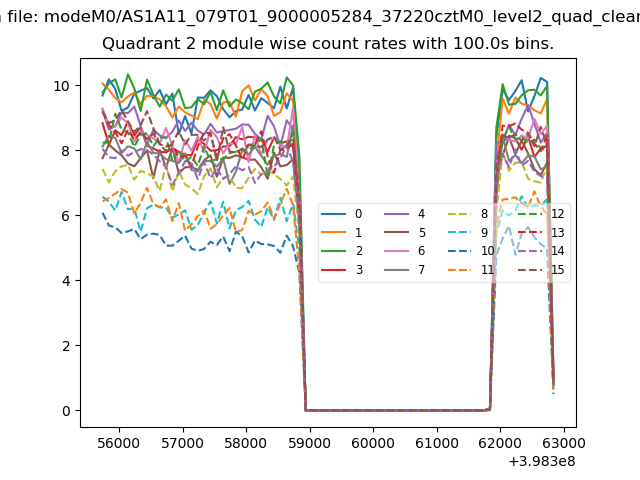
| Module-wise count rates for Quadrant B Data is divided into 100 sec bins |
 |
 |
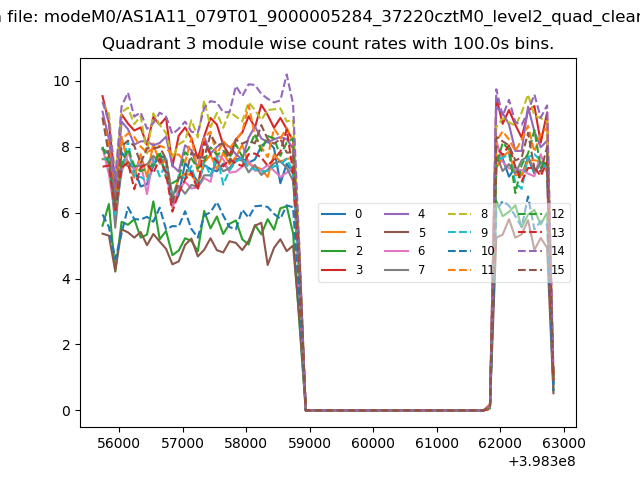
| Module-wise count rates for Quadrant C Data is divided into 100 sec bins |
 |
 |
| Module-wise count rates for Quadrant D Data is divided into 100 sec bins |
 |
 |
| Parameter | Plot |
|---|---|
| CZT HV Monitor |  |
| D_VDD | 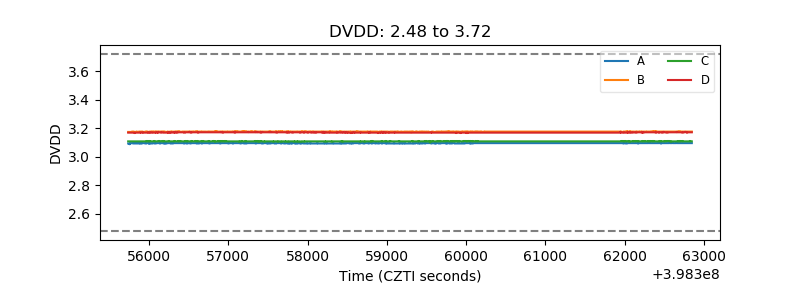 |
| Temperature 1 | 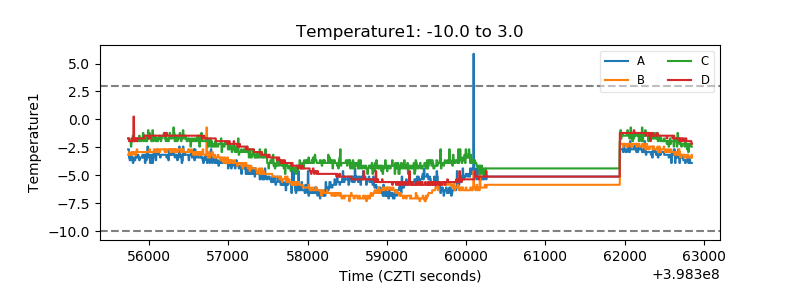 |
| Veto HV Monitor | 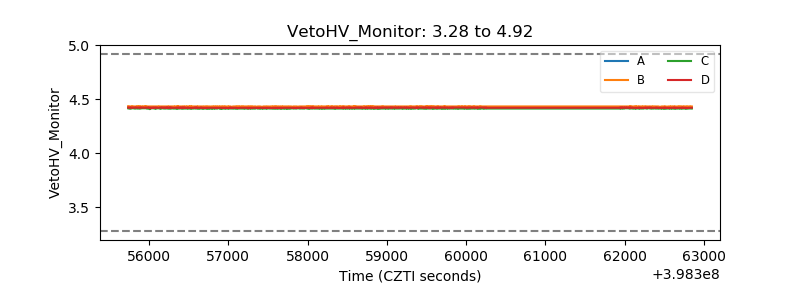 |
| Veto LLD | 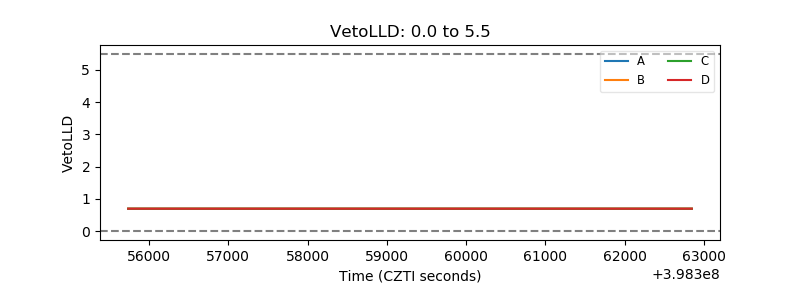 |
| Alpha Counter | 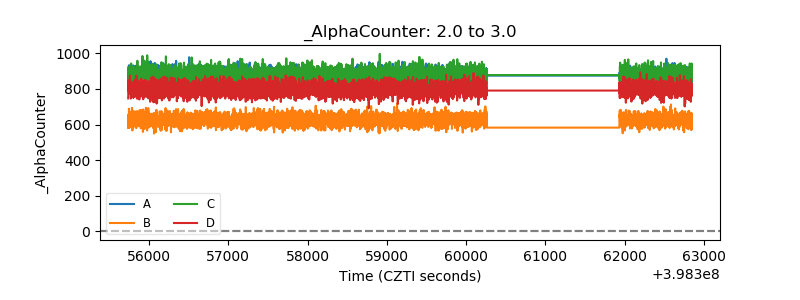 |
| _CPM_Rate | 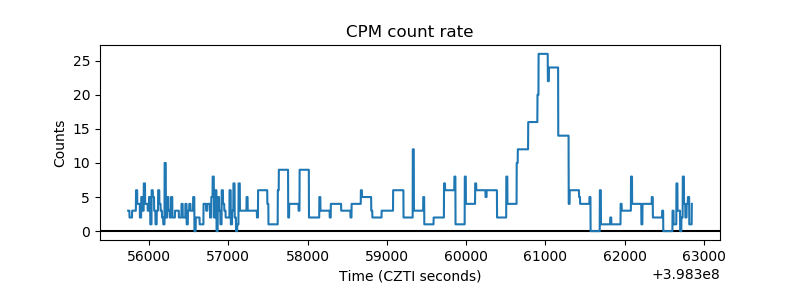 |
| CZT Counter | 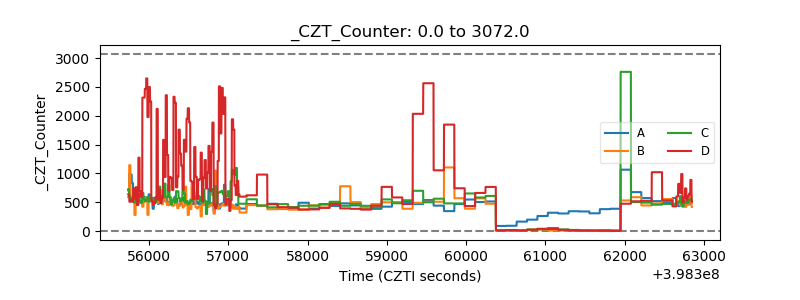 |
| +2.5 Volts monitor | 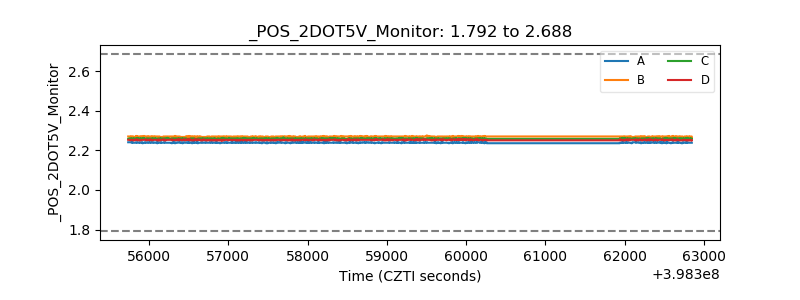 |
| +5 Volts monitor | 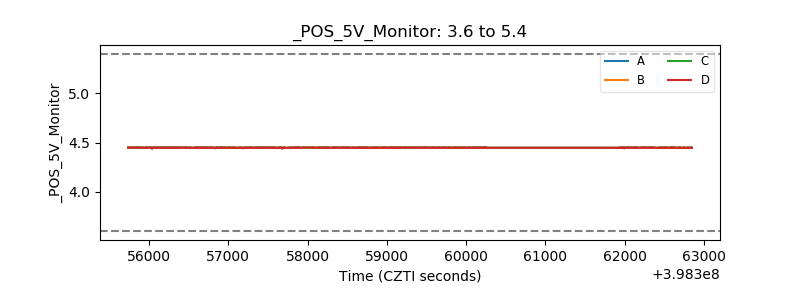 |
| _ROLL_ROT | 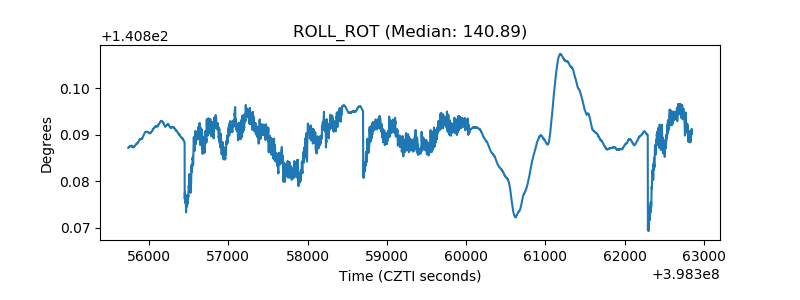 |
| _Roll_DEC | 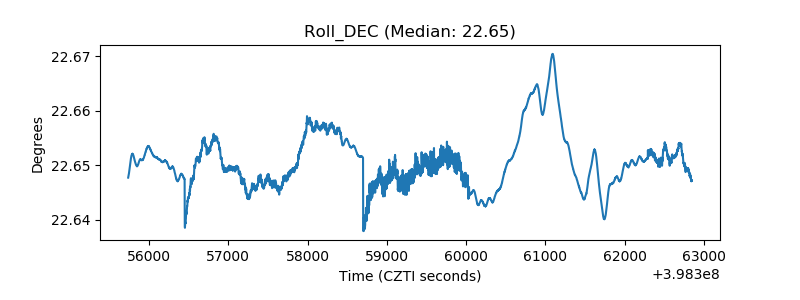 |
| _Roll_RA | 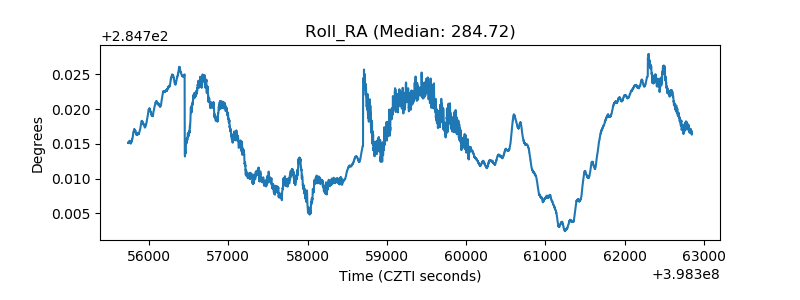 |
| Veto Counter | 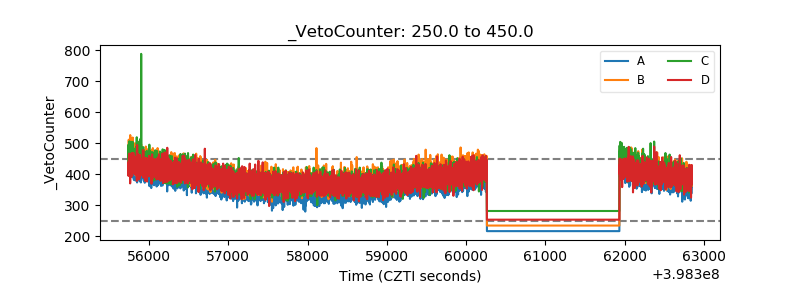 |