| Param | Original file | Final file |
|---|---|---|
| Filename | modeM0/AS1A11_079T01_9000005284_37222cztM0_level2.evt | modeM0/AS1A11_079T01_9000005284_37222cztM0_level2_quad_clean.evt |
| Size (bytes) | 488,278,080 | 71,418,240 |
| Size | 465.7 MB | 68.1 MB |
| Events in quadrant A | 3,192,648 | 441,668 |
| Events in quadrant B | 2,913,917 | 449,628 |
| Events in quadrant C | 4,260,514 | 437,835 |
| Events in quadrant D | 4,023,002 | 423,949 |
| Mode M9 | |||
|---|---|---|---|
| Quadrant | BADHDUFLAG | Total packets | Discarded packets |
| A | 0 | 18 | 0 |
| B | 0 | 18 | 0 |
| C | 0 | 18 | 0 |
| D | 0 | 19 | 0 |
| Mode SS | |||
|---|---|---|---|
| Quadrant | BADHDUFLAG | Total packets | Discarded packets |
| A | 0 | 120 | 0 |
| B | 0 | 120 | 0 |
| C | 0 | 120 | 0 |
| D | 0 | 120 | 0 |
| Mode M0 | |||
|---|---|---|---|
| Quadrant | BADHDUFLAG | Total packets | Discarded packets |
| A | 0 | 13267 | 3 |
| B | 0 | 12573 | 2 |
| C | 0 | 16427 | 2 |
| D | 0 | 15876 | 2 |
| Quadrant | Total seconds | Saturated seconds | Saturation percentage |
|---|---|---|---|
| A | 5856 | 124 | 2.117486% |
| B | 5856 | 38 | 0.648907% |
| C | 5856 | 253 | 4.320355% |
| D | 5856 | 164 | 2.800546% |
Noise dominated data is calculated using 1-second bins in cleaned event files. If a bin has >2000 counts, and if more than 50% of those come from <1% of pixels, then it is considered to be noise-dominated and hence unusable.
| Quadrant | # 1 sec bins | Bins with >0 counts | Bins with >2000 counts | High rate bins dominated by noise | Noise dominated (total time) | Noise dominated (detector-on time) | Marked lightcurve |
|---|---|---|---|---|---|---|---|
| A | 7169 | 5857 | 106 | 106 | 1.48% | 1.81% | 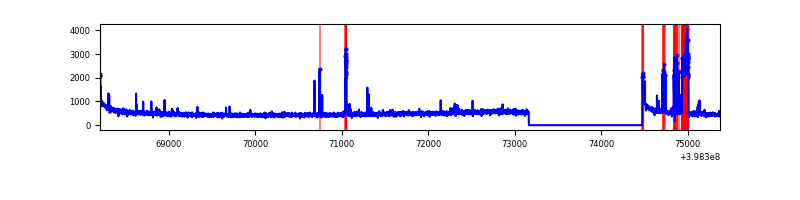 |
| B | 7169 | 5857 | 26 | 26 | 0.36% | 0.44% | 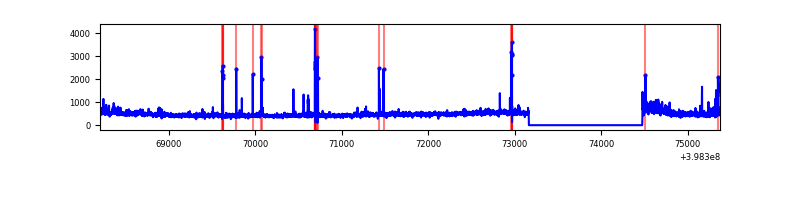 |
| C | 7169 | 5857 | 176 | 176 | 2.46% | 3.00% | 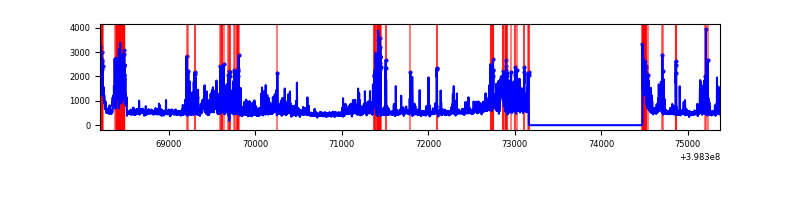 |
| D | 7169 | 5857 | 133 | 133 | 1.86% | 2.27% | 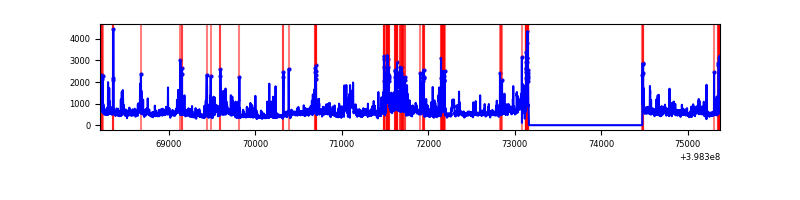 |
Top three noisy pixels from each quadrant. If the there are fewer than three noisy pixels in the level2.evt file, extra rows are filled as -1
| Pixel properties | Quadrant properties | ||||||
|---|---|---|---|---|---|---|---|
| Quadrant | DetID | PixID | Counts | Sigma | Mean | Median | Sigma |
| A | 10 | 83 | 276859 | 2067.74 | 663 | 650 | 133.6 |
| A | 15 | 237 | 242074 | 1807.33 | 663 | 650 | 133.6 |
| A | 9 | 143 | 51305 | 379.21 | 663 | 650 | 133.6 |
| B | 5 | 172 | 91982 | 709.33 | 661 | 642 | 128.8 |
| B | 0 | 190 | 78104 | 601.55 | 661 | 642 | 128.8 |
| B | 0 | 213 | 59956 | 460.62 | 661 | 642 | 128.8 |
| C | 14 | 254 | 777831 | 5161.96 | 647 | 655 | 150.6 |
| C | 15 | 159 | 469142 | 3111.66 | 647 | 655 | 150.6 |
| C | 15 | 214 | 246583 | 1633.44 | 647 | 655 | 150.6 |
| D | 1 | 52 | 431865 | 2703.5 | 648 | 631 | 159.5 |
| D | 2 | 249 | 293848 | 1838.24 | 648 | 631 | 159.5 |
| D | 13 | 249 | 250820 | 1568.49 | 648 | 631 | 159.5 |
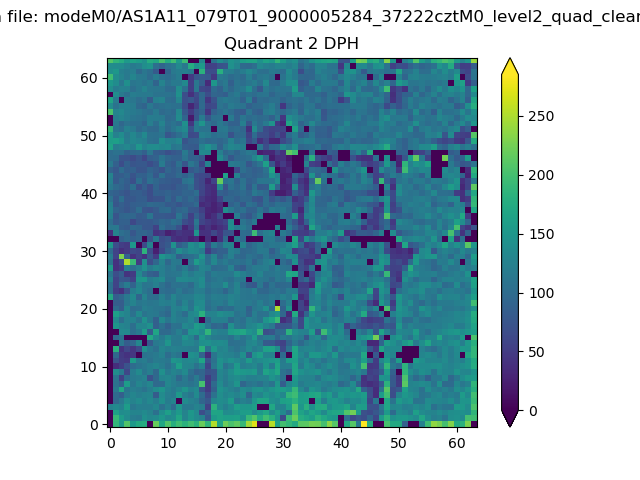
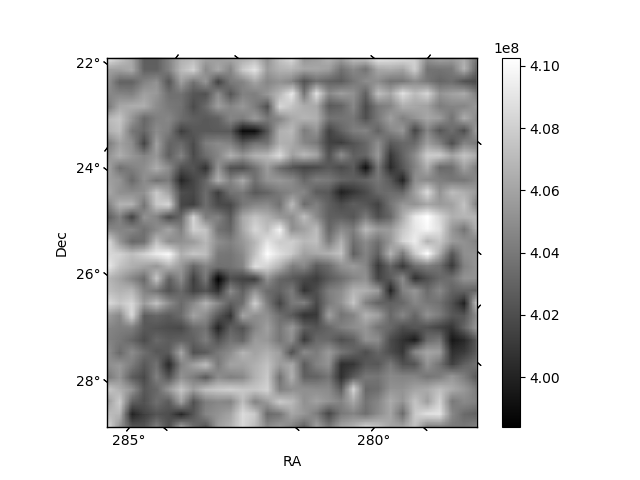
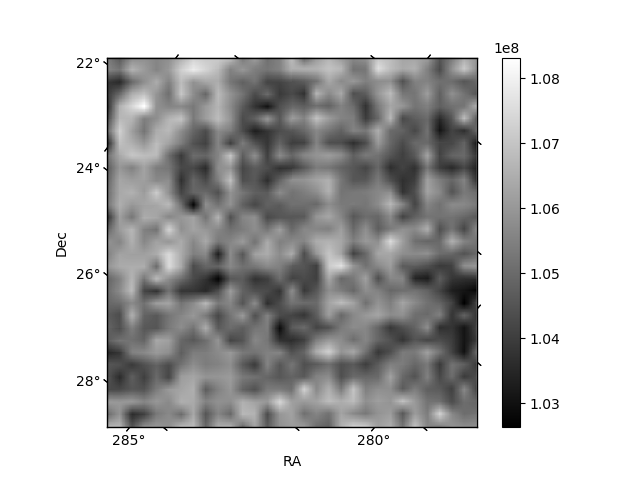
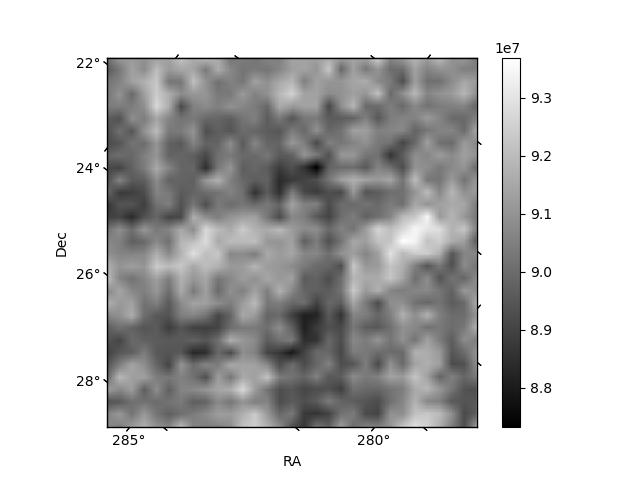
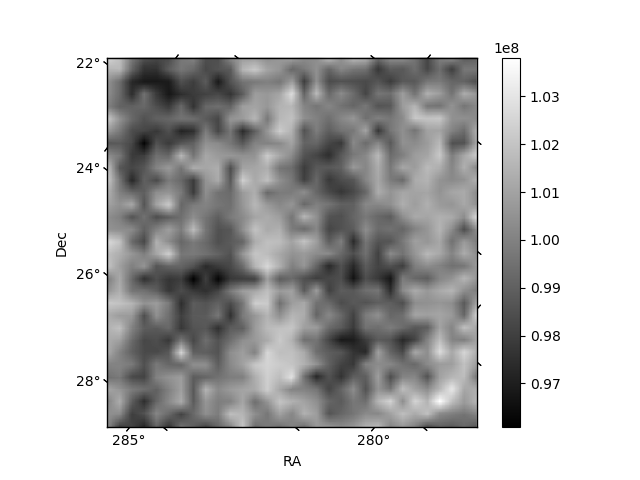
Histogram calculated using DETX and DETY for each event in the final _common_clean file
| Quadrant A | 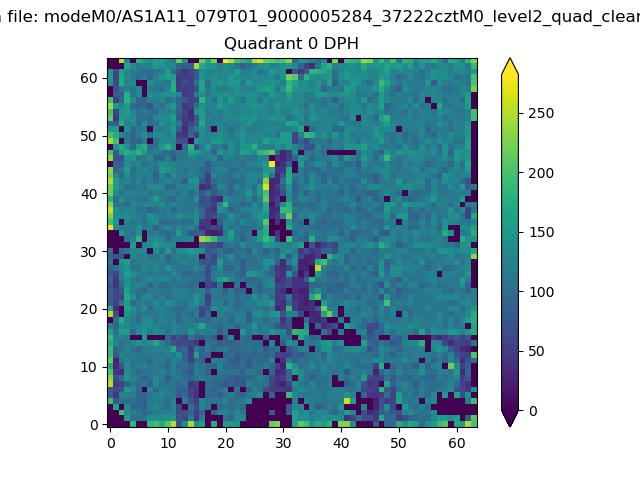 |
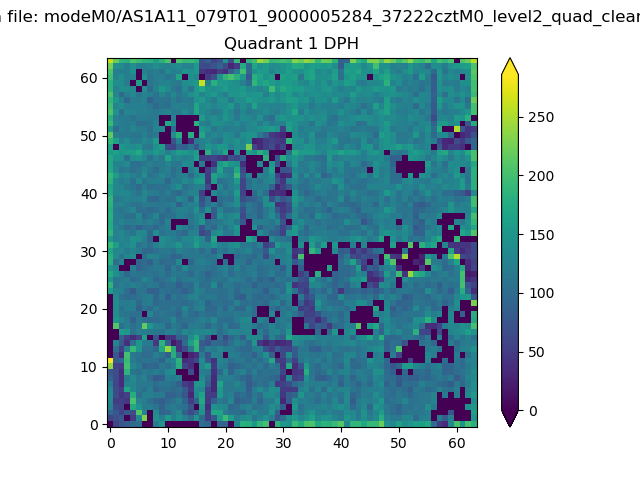 |
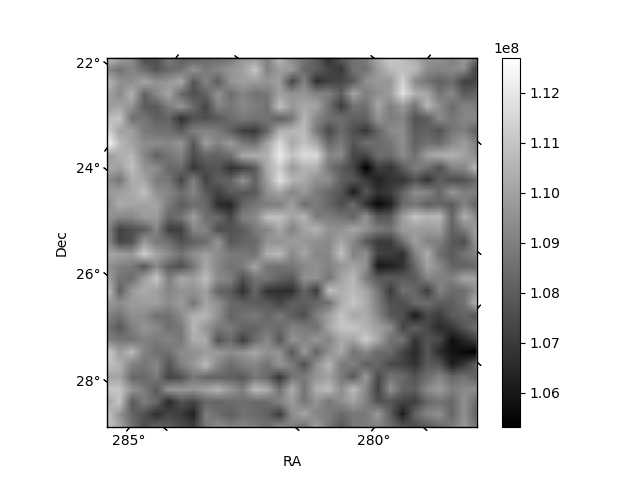
Quadrant B |
|---|---|---|---|
| Quadrant D | 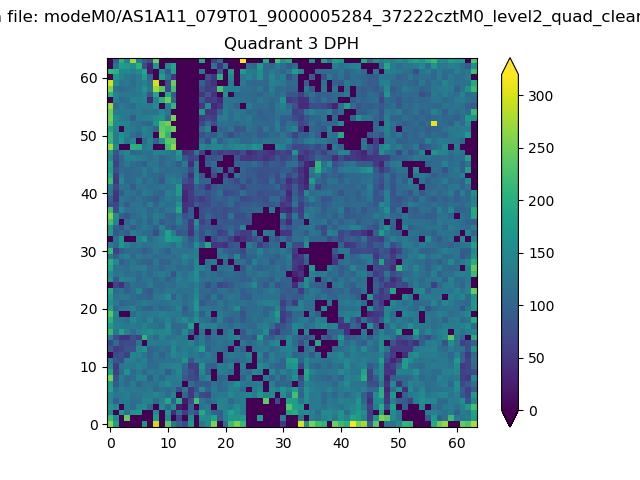 |
 |
Quadrant C |
| Plot type | Count rate plots | Images |
|---|---|---|
| Comparison with Poisson distribution Blue bars denote a histogram of data divided into 1 sec bins. Red curve is a Poisson curve with rate = median count rate of data. |
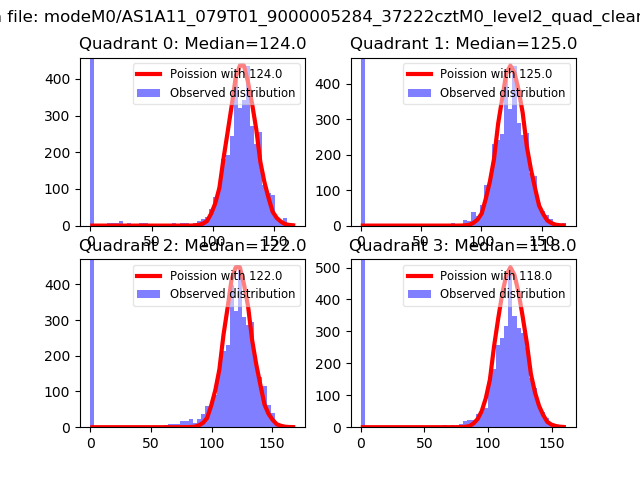 |
 |
| Quadrant-wise count rates Data is divided into 100 sec bins |
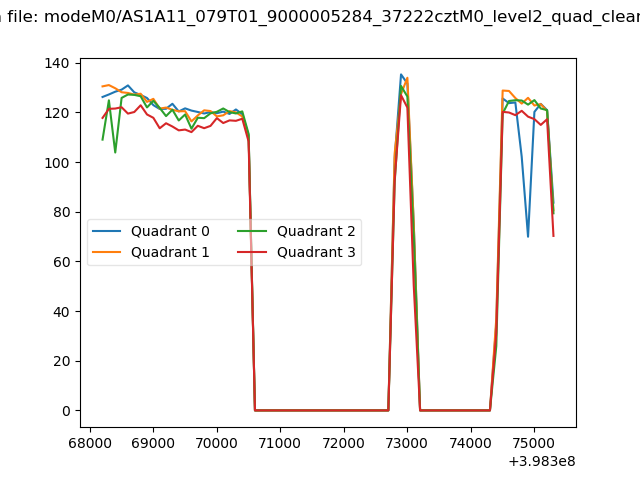 |
|
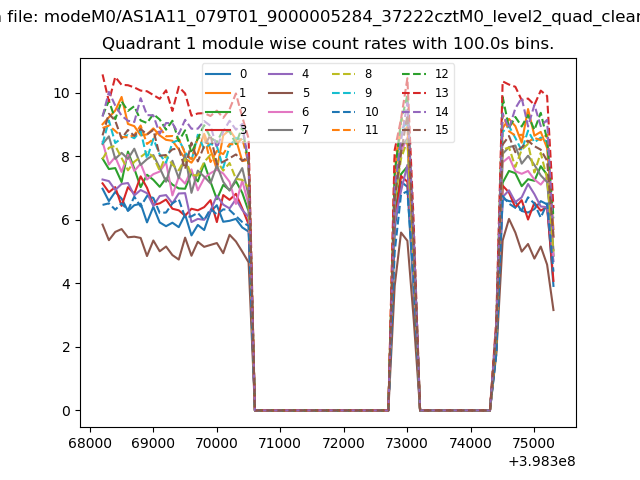
| Module-wise count rates for Quadrant A Data is divided into 100 sec bins |
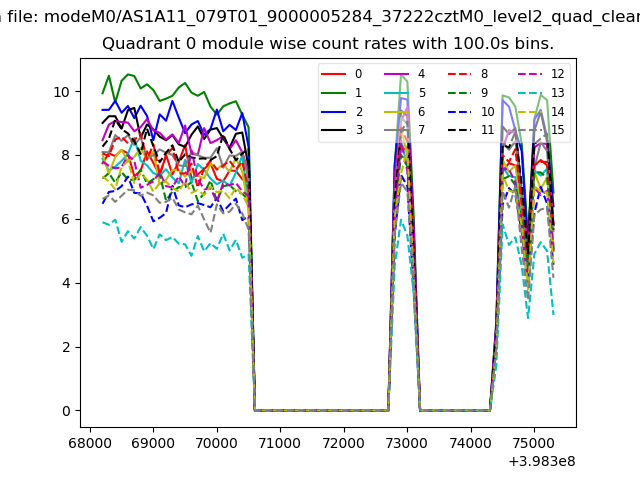 |
 |
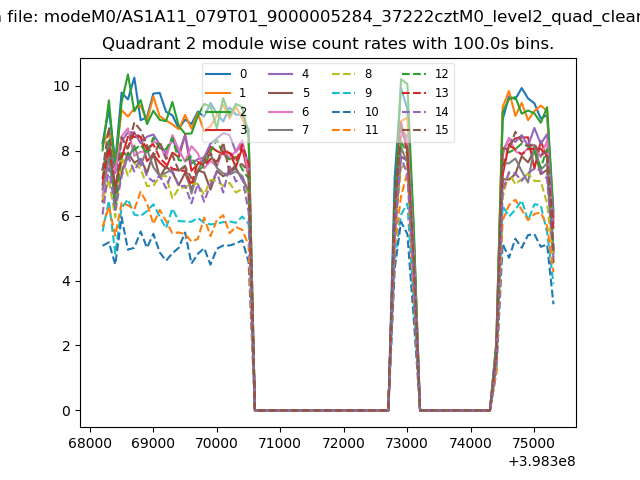
| Module-wise count rates for Quadrant B Data is divided into 100 sec bins |
 |
 |
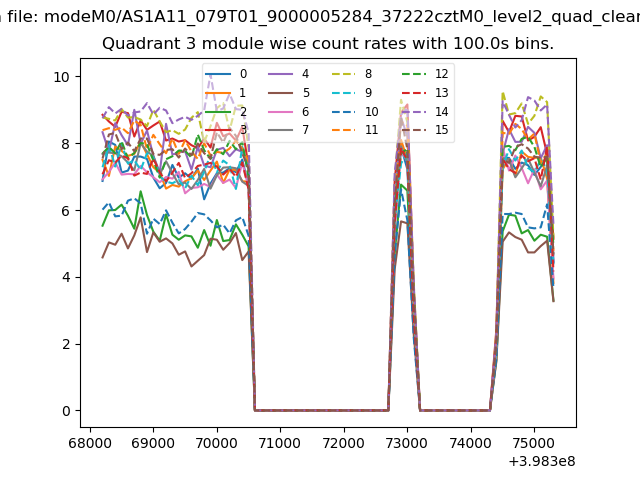
| Module-wise count rates for Quadrant C Data is divided into 100 sec bins |
 |
 |
| Module-wise count rates for Quadrant D Data is divided into 100 sec bins |
 |
 |
| Parameter | Plot |
|---|---|
| CZT HV Monitor | 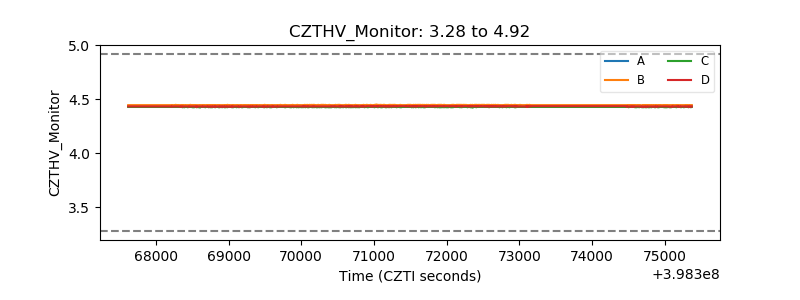 |
| D_VDD | 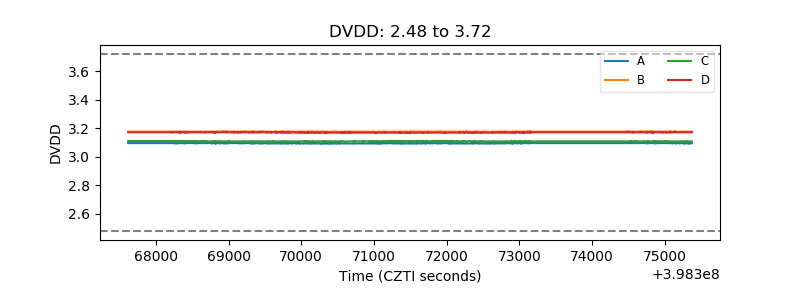 |
| Temperature 1 | 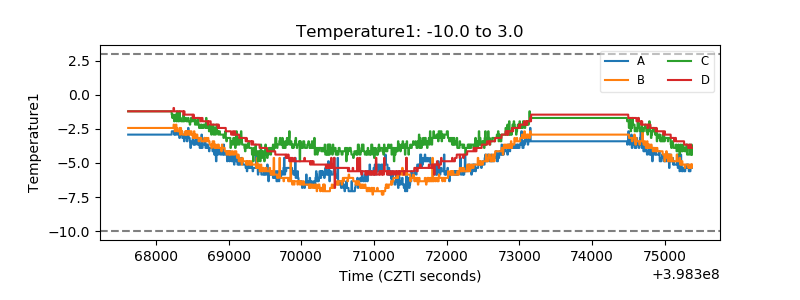 |
| Veto HV Monitor |  |
| Veto LLD | 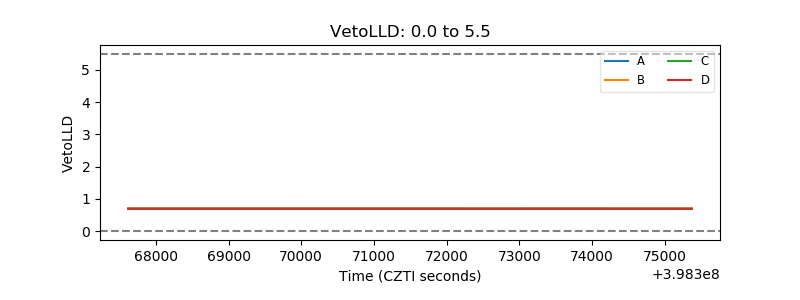 |
| Alpha Counter | 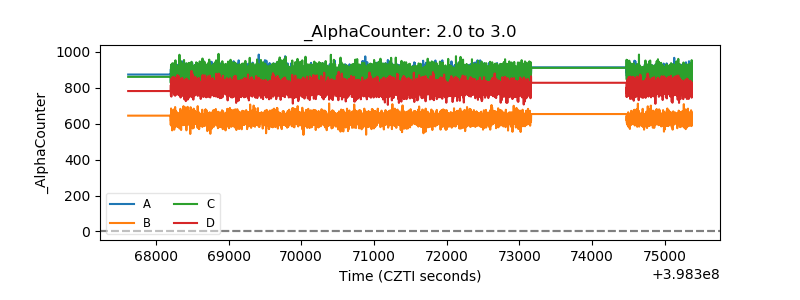 |
| _CPM_Rate | 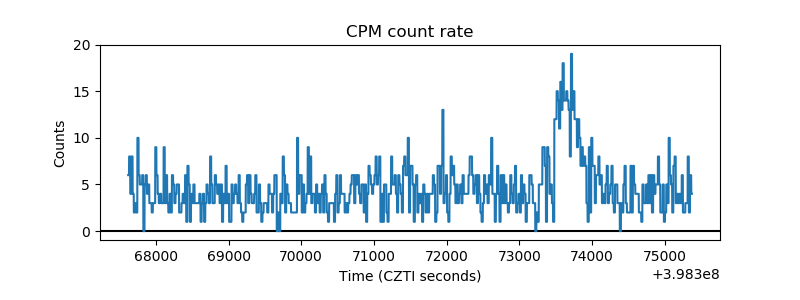 |
| CZT Counter | 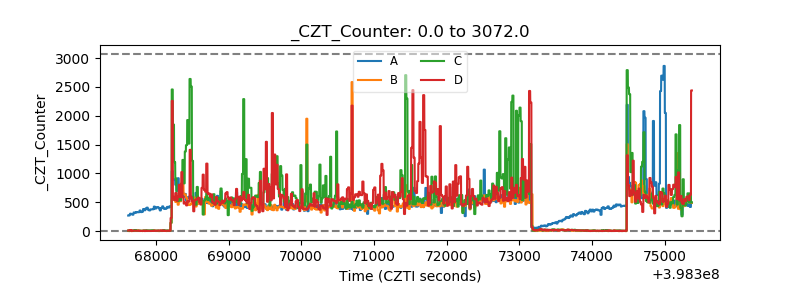 |
| +2.5 Volts monitor | 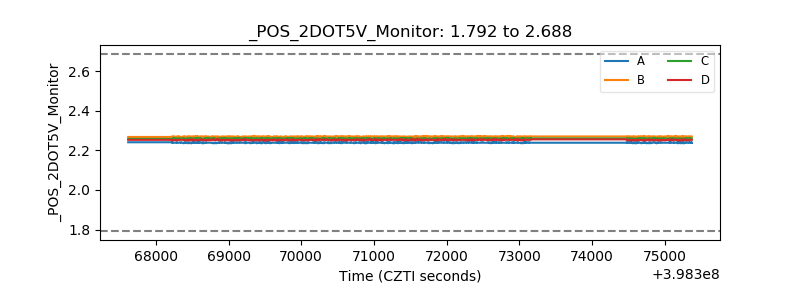 |
| +5 Volts monitor | 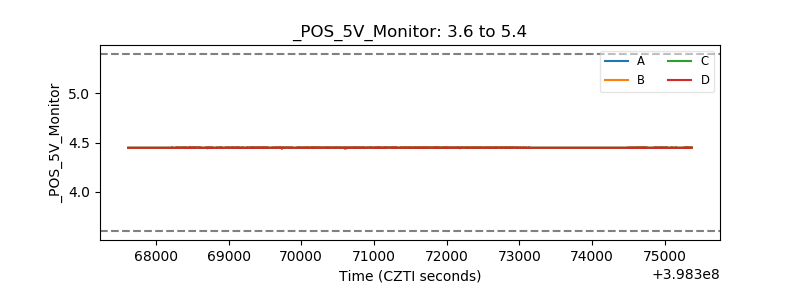 |
| _ROLL_ROT | 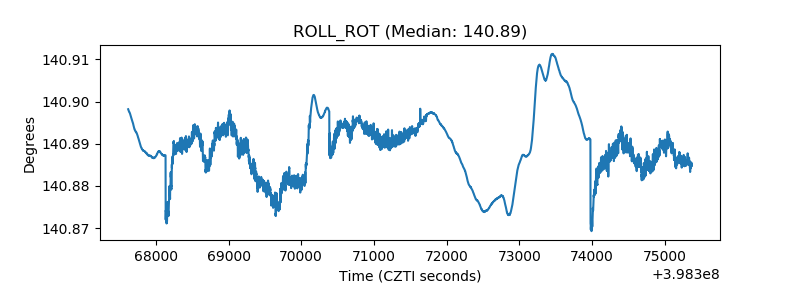 |
| _Roll_DEC | 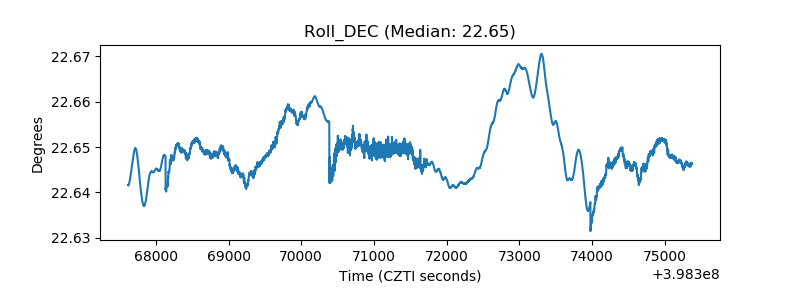 |
| _Roll_RA | 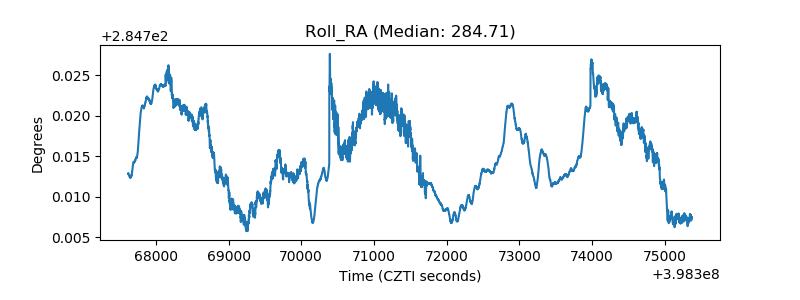 |
| Veto Counter | 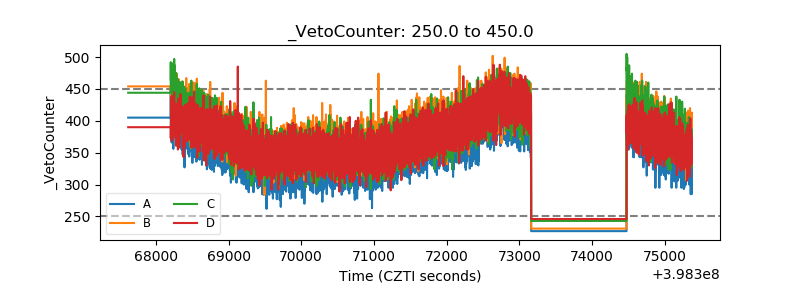 |