| Param | Original file | Final file |
|---|---|---|
| Filename | modeM0/AS1A11_079T01_9000005284_37225cztM0_level2.evt | modeM0/AS1A11_079T01_9000005284_37225cztM0_level2_quad_clean.evt |
| Size (bytes) | 1,261,627,200 | 178,200,000 |
| Size | 1.2 GB | 169.9 MB |
| Events in quadrant A | 8,179,263 | 1,102,526 |
| Events in quadrant B | 8,261,339 | 1,112,643 |
| Events in quadrant C | 9,222,776 | 1,097,478 |
| Events in quadrant D | 11,484,330 | 999,429 |
| Mode M9 | |||
|---|---|---|---|
| Quadrant | BADHDUFLAG | Total packets | Discarded packets |
| A | 0 | 56 | 0 |
| B | 0 | 56 | 0 |
| C | 0 | 56 | 0 |
| D | 0 | 56 | 0 |
| Mode SS | |||
|---|---|---|---|
| Quadrant | BADHDUFLAG | Total packets | Discarded packets |
| A | 0 | 322 | 0 |
| B | 0 | 322 | 0 |
| C | 0 | 322 | 0 |
| D | 0 | 322 | 0 |
| Mode M0 | |||
|---|---|---|---|
| Quadrant | BADHDUFLAG | Total packets | Discarded packets |
| A | 0 | 34471 | 5 |
| B | 0 | 35197 | 4 |
| C | 0 | 37372 | 4 |
| D | 0 | 45072 | 4 |
| Quadrant | Total seconds | Saturated seconds | Saturation percentage |
|---|---|---|---|
| A | 15718 | 154 | 0.979768% |
| B | 15718 | 83 | 0.528057% |
| C | 15718 | 239 | 1.520550% |
| D | 15718 | 1032 | 6.565721% |
Noise dominated data is calculated using 1-second bins in cleaned event files. If a bin has >2000 counts, and if more than 50% of those come from <1% of pixels, then it is considered to be noise-dominated and hence unusable.
| Quadrant | # 1 sec bins | Bins with >0 counts | Bins with >2000 counts | High rate bins dominated by noise | Noise dominated (total time) | Noise dominated (detector-on time) | Marked lightcurve |
|---|---|---|---|---|---|---|---|
| A | 21297 | 15722 | 106 | 106 | 0.50% | 0.67% | 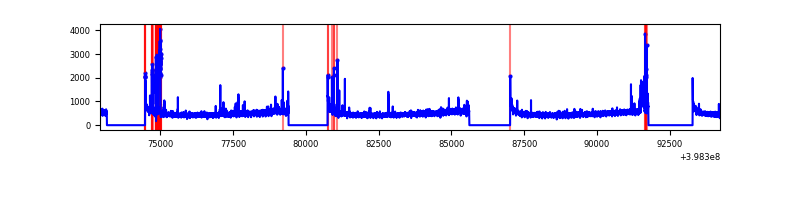 |
| B | 21297 | 15722 | 33 | 33 | 0.15% | 0.21% | 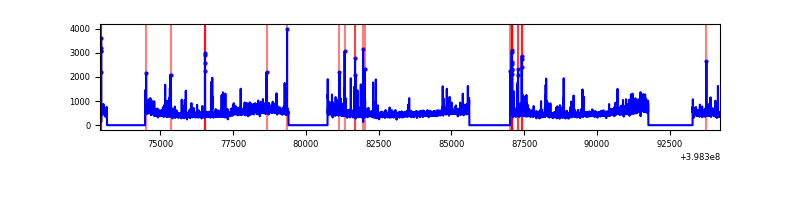 |
| C | 21297 | 15722 | 156 | 156 | 0.73% | 0.99% | 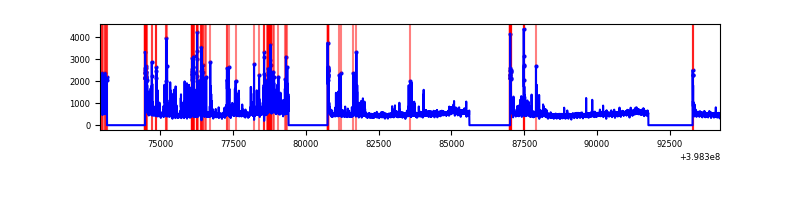 |
| D | 21297 | 15722 | 831 | 831 | 3.90% | 5.29% | 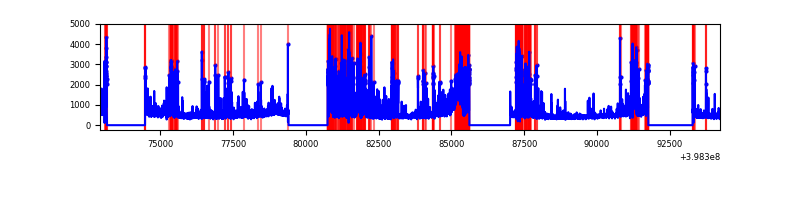 |
Top three noisy pixels from each quadrant. If the there are fewer than three noisy pixels in the level2.evt file, extra rows are filled as -1
| Pixel properties | Quadrant properties | ||||||
|---|---|---|---|---|---|---|---|
| Quadrant | DetID | PixID | Counts | Sigma | Mean | Median | Sigma |
| A | 10 | 83 | 648793 | 1779.42 | 1806 | 1769 | 363.6 |
| A | 15 | 237 | 408116 | 1117.52 | 1806 | 1769 | 363.6 |
| A | 13 | 248 | 53610 | 142.57 | 1806 | 1769 | 363.6 |
| B | 0 | 213 | 279792 | 798.35 | 1798 | 1748 | 348.3 |
| B | 0 | 190 | 255224 | 727.81 | 1798 | 1748 | 348.3 |
| B | 5 | 172 | 247185 | 704.73 | 1798 | 1748 | 348.3 |
| C | 14 | 254 | 1153384 | 2796.68 | 1763 | 1776 | 411.8 |
| C | 15 | 214 | 656568 | 1590.16 | 1763 | 1776 | 411.8 |
| C | 15 | 159 | 248178 | 598.39 | 1763 | 1776 | 411.8 |
| D | 2 | 249 | 1270534 | 3040.92 | 1718 | 1673 | 417.3 |
| D | 10 | 253 | 1152386 | 2757.77 | 1718 | 1673 | 417.3 |
| D | 13 | 249 | 907546 | 2170.99 | 1718 | 1673 | 417.3 |
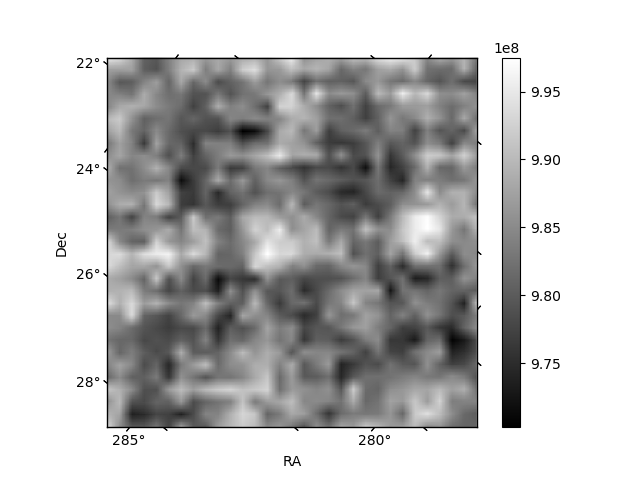
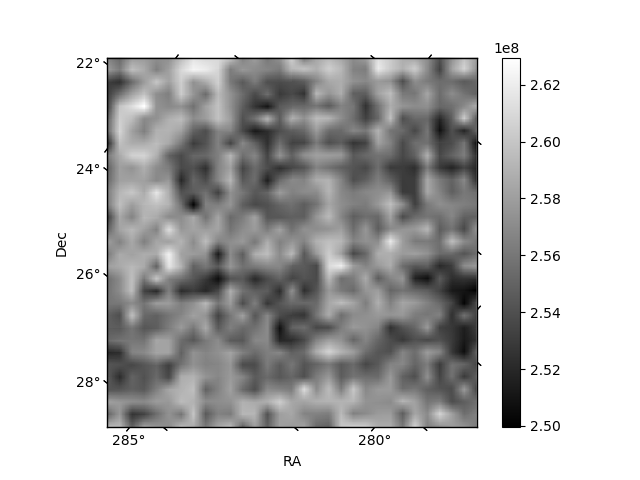
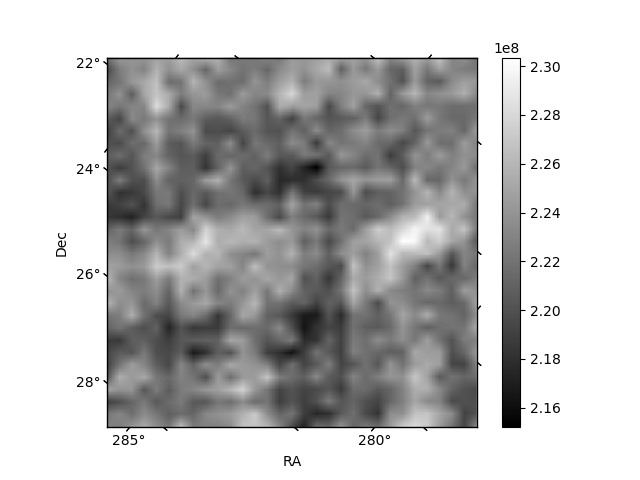
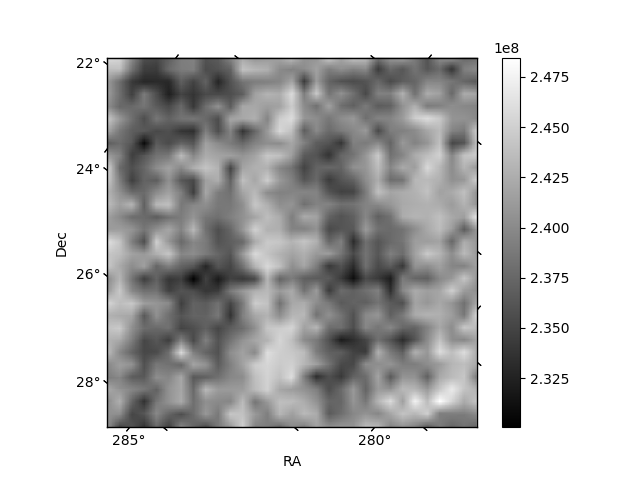
Histogram calculated using DETX and DETY for each event in the final _common_clean file
| Quadrant A | 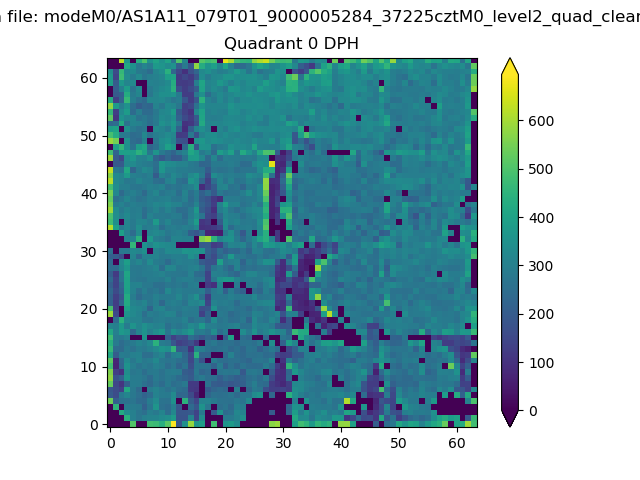 |
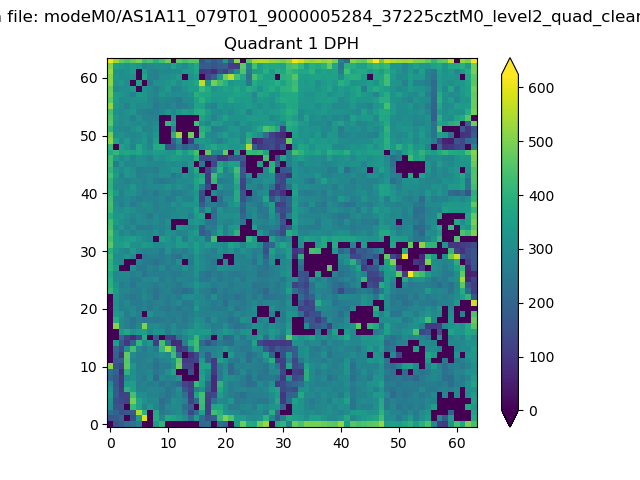 |
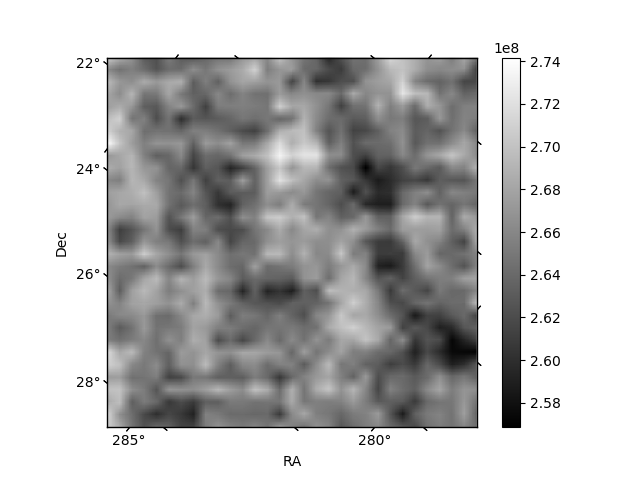
Quadrant B |
|---|---|---|---|
| Quadrant D | 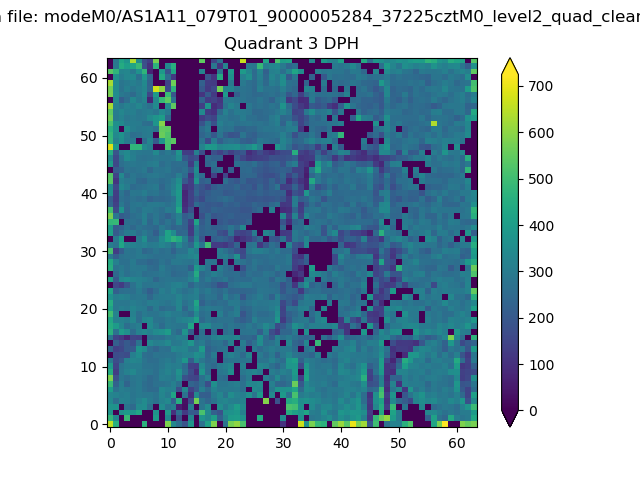 |
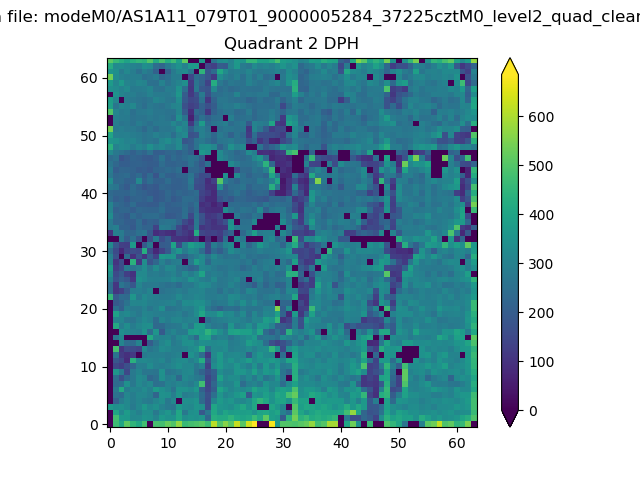 |
Quadrant C |
| Plot type | Count rate plots | Images |
|---|---|---|
| Comparison with Poisson distribution Blue bars denote a histogram of data divided into 1 sec bins. Red curve is a Poisson curve with rate = median count rate of data. |
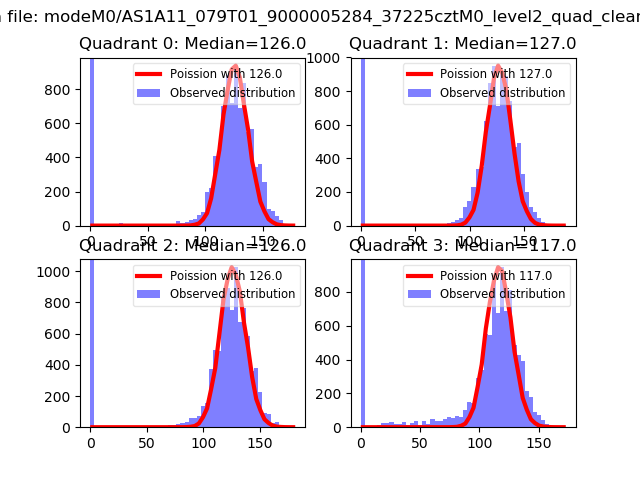 |
 |
| Quadrant-wise count rates Data is divided into 100 sec bins |
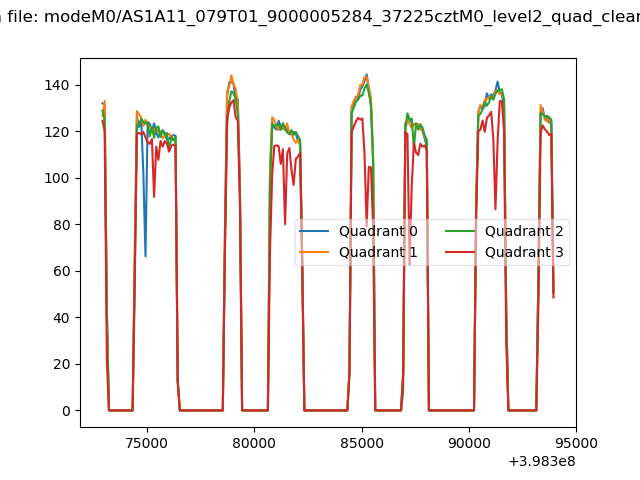 |
|
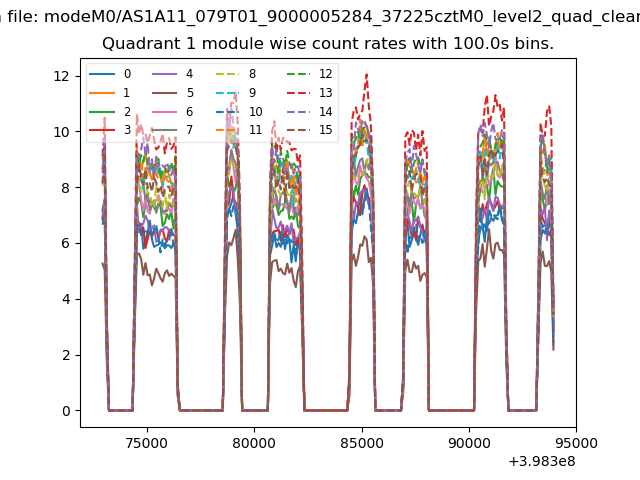
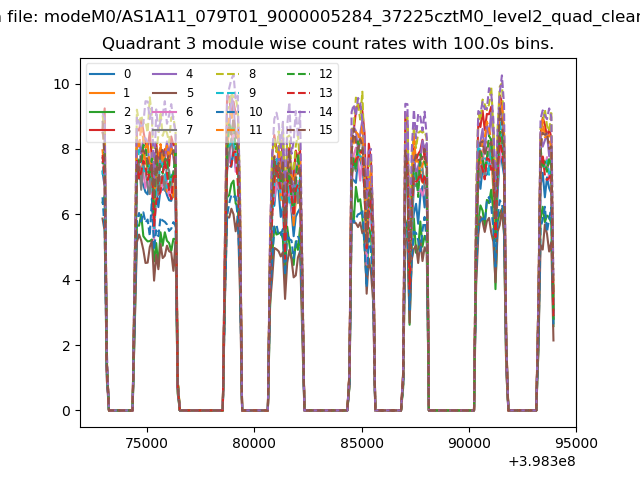
| Module-wise count rates for Quadrant A Data is divided into 100 sec bins |
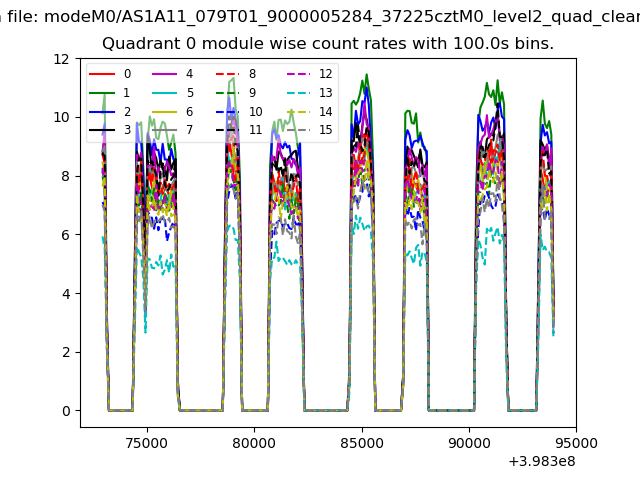 |
 |
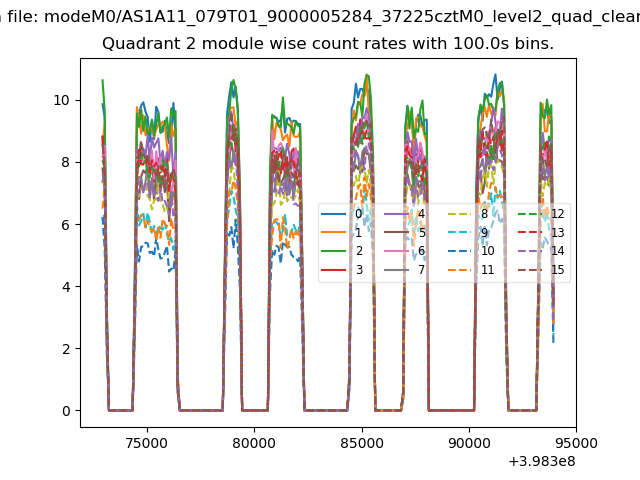
| Module-wise count rates for Quadrant B Data is divided into 100 sec bins |
 |
 |
| Module-wise count rates for Quadrant C Data is divided into 100 sec bins |
 |
 |
| Module-wise count rates for Quadrant D Data is divided into 100 sec bins |
 |
 |
| Parameter | Plot |
|---|---|
| CZT HV Monitor | 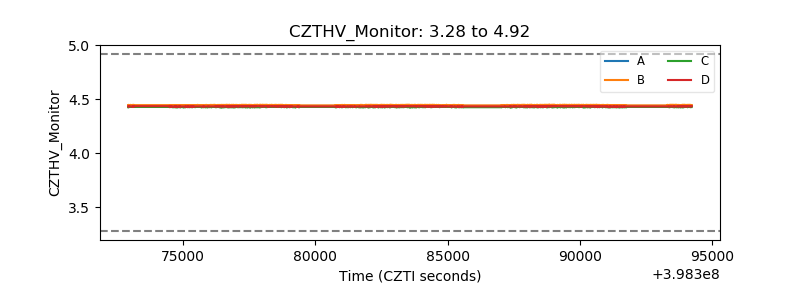 |
| D_VDD | 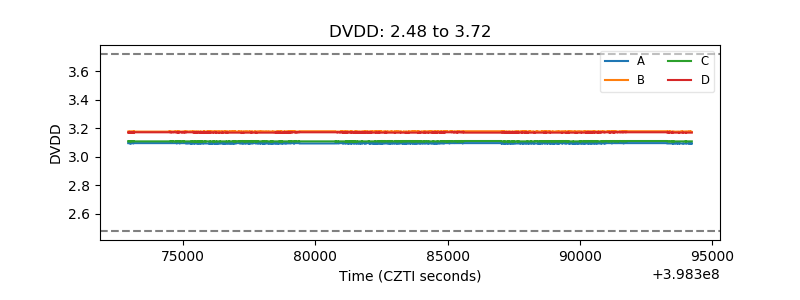 |
| Temperature 1 | 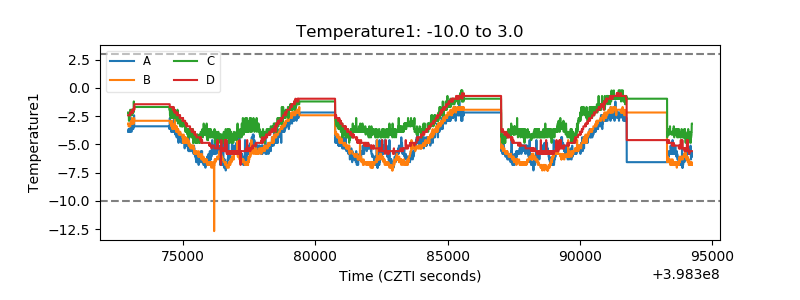 |
| Veto HV Monitor | 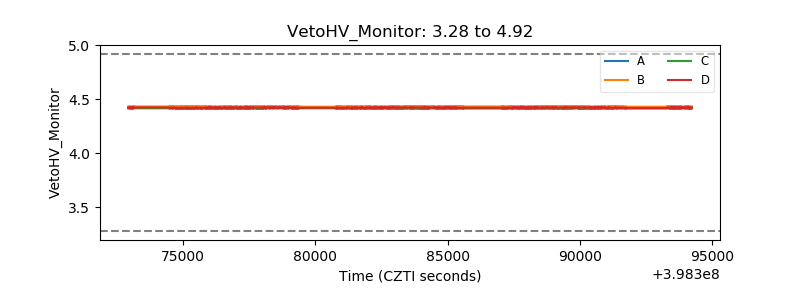 |
| Veto LLD | 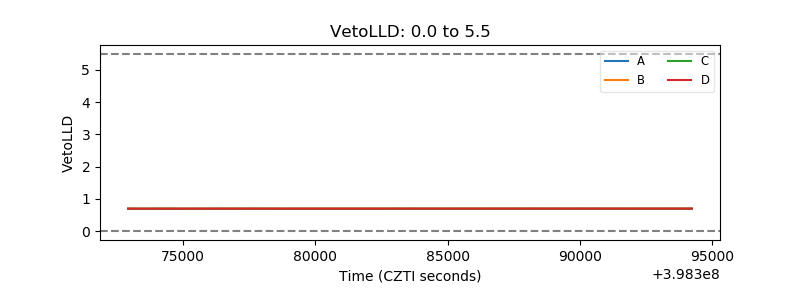 |
| Alpha Counter | 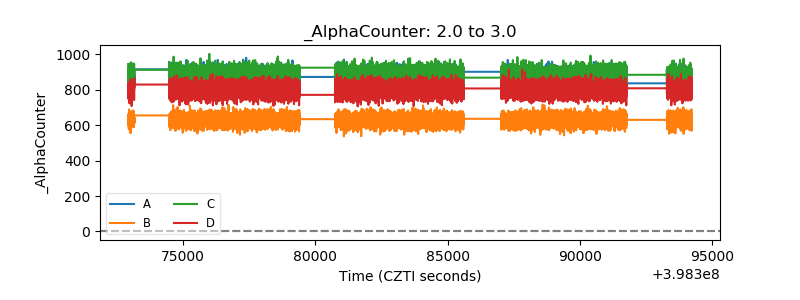 |
| _CPM_Rate | 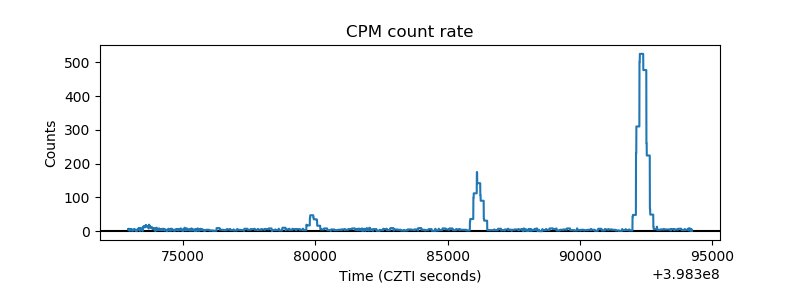 |
| CZT Counter | 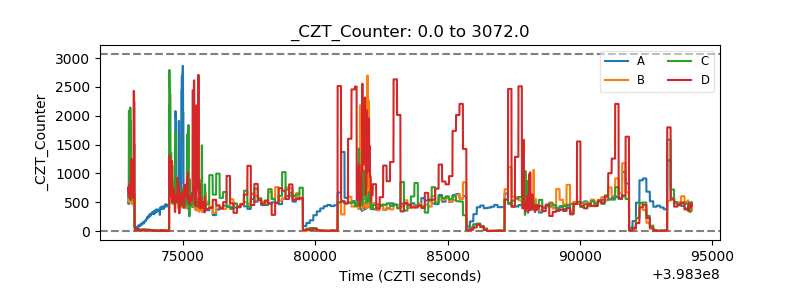 |
| +2.5 Volts monitor | 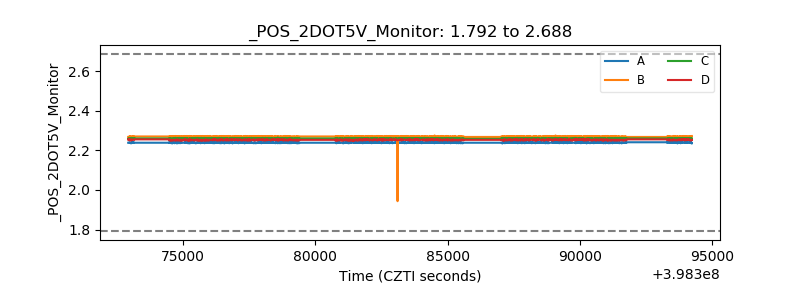 |
| +5 Volts monitor | 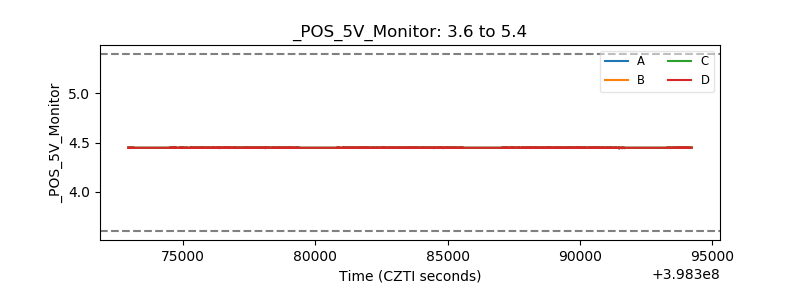 |
| _ROLL_ROT | 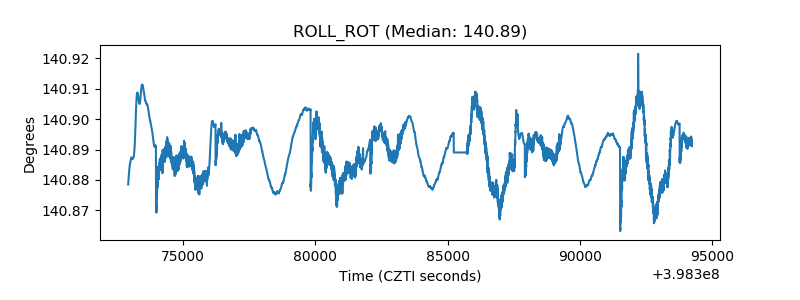 |
| _Roll_DEC | 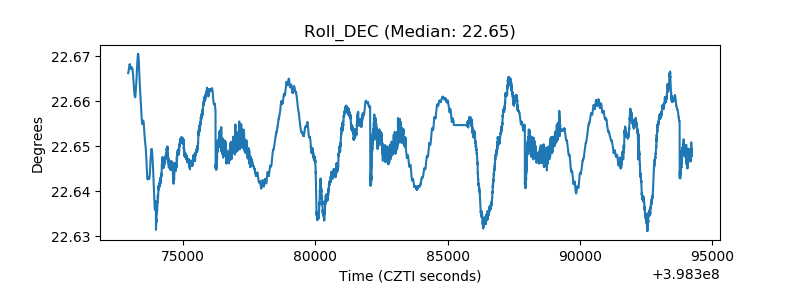 |
| _Roll_RA | 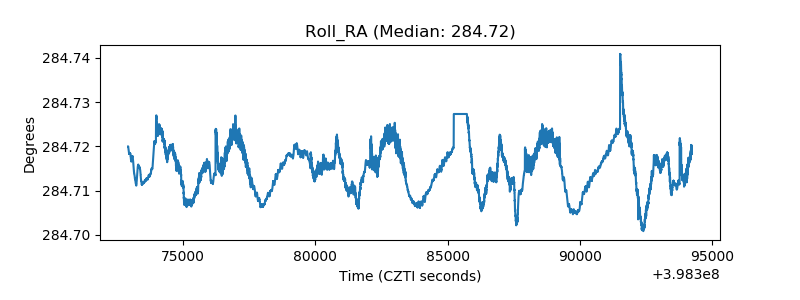 |
| Veto Counter | 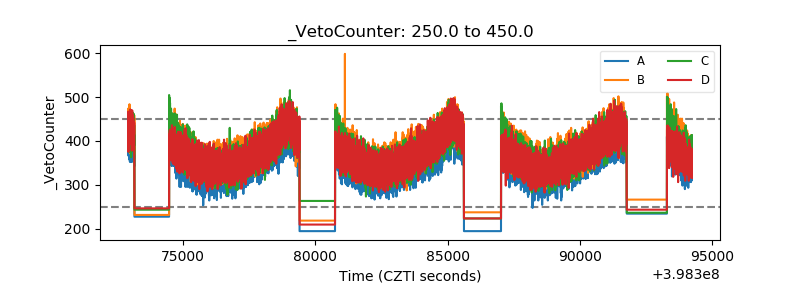 |