| Param | Original file | Final file |
|---|---|---|
| Filename | modeM0/AS1A11_079T01_9000005284_37226cztM0_level2.evt | modeM0/AS1A11_079T01_9000005284_37226cztM0_level2_quad_clean.evt |
| Size (bytes) | 390,165,120 | 57,585,600 |
| Size | 372.1 MB | 54.9 MB |
| Events in quadrant A | 2,809,541 | 345,178 |
| Events in quadrant B | 2,756,970 | 349,857 |
| Events in quadrant C | 2,749,782 | 343,766 |
| Events in quadrant D | 3,133,459 | 327,492 |
| Mode M9 | |||
|---|---|---|---|
| Quadrant | BADHDUFLAG | Total packets | Discarded packets |
| A | 0 | 24 | 0 |
| B | 0 | 24 | 0 |
| C | 0 | 24 | 0 |
| D | 0 | 25 | 0 |
| Mode SS | |||
|---|---|---|---|
| Quadrant | BADHDUFLAG | Total packets | Discarded packets |
| A | 0 | 108 | 0 |
| B | 0 | 108 | 0 |
| C | 0 | 108 | 0 |
| D | 0 | 108 | 0 |
| Mode M0 | |||
|---|---|---|---|
| Quadrant | BADHDUFLAG | Total packets | Discarded packets |
| A | 0 | 11730 | 3 |
| B | 0 | 11553 | 2 |
| C | 0 | 11345 | 2 |
| D | 0 | 13060 | 2 |
| Quadrant | Total seconds | Saturated seconds | Saturation percentage |
|---|---|---|---|
| A | 5393 | 18 | 0.333766% |
| B | 5393 | 36 | 0.667532% |
| C | 5393 | 38 | 0.704617% |
| D | 5393 | 94 | 1.743000% |
Noise dominated data is calculated using 1-second bins in cleaned event files. If a bin has >2000 counts, and if more than 50% of those come from <1% of pixels, then it is considered to be noise-dominated and hence unusable.
| Quadrant | # 1 sec bins | Bins with >0 counts | Bins with >2000 counts | High rate bins dominated by noise | Noise dominated (total time) | Noise dominated (detector-on time) | Marked lightcurve |
|---|---|---|---|---|---|---|---|
| A | 7034 | 5394 | 11 | 11 | 0.16% | 0.20% | 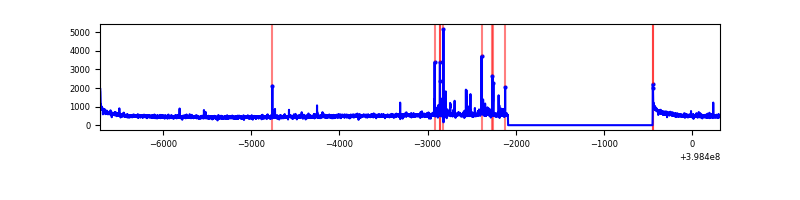 |
| B | 7034 | 5394 | 18 | 18 | 0.26% | 0.33% | 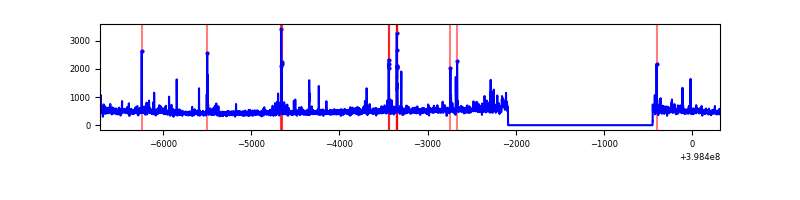 |
| C | 7034 | 5394 | 27 | 27 | 0.38% | 0.50% | 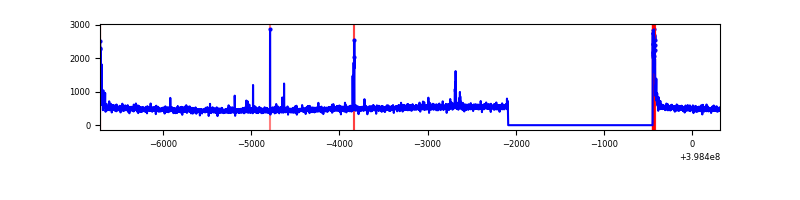 |
| D | 7034 | 5394 | 65 | 65 | 0.92% | 1.21% | 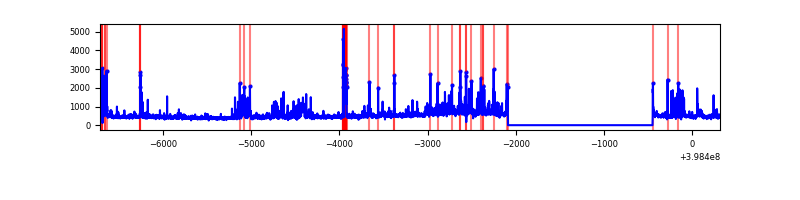 |
Top three noisy pixels from each quadrant. If the there are fewer than three noisy pixels in the level2.evt file, extra rows are filled as -1
| Pixel properties | Quadrant properties | ||||||
|---|---|---|---|---|---|---|---|
| Quadrant | DetID | PixID | Counts | Sigma | Mean | Median | Sigma |
| A | 10 | 83 | 268720 | 2102.91 | 626 | 615 | 127.5 |
| A | 15 | 237 | 70415 | 547.48 | 626 | 615 | 127.5 |
| A | 13 | 248 | 26791 | 205.31 | 626 | 615 | 127.5 |
| B | 5 | 172 | 88951 | 729.13 | 625 | 608 | 121.2 |
| B | 0 | 155 | 69006 | 564.51 | 625 | 608 | 121.2 |
| B | 0 | 213 | 46441 | 378.28 | 625 | 608 | 121.2 |
| C | 15 | 214 | 231442 | 1607.62 | 609 | 613 | 143.6 |
| C | 0 | 10 | 95825 | 663.11 | 609 | 613 | 143.6 |
| C | 14 | 254 | 28113 | 191.53 | 609 | 613 | 143.6 |
| D | 12 | 248 | 232567 | 1569.21 | 605 | 588 | 147.8 |
| D | 2 | 249 | 150314 | 1012.81 | 605 | 588 | 147.8 |
| D | 12 | 235 | 121398 | 817.21 | 605 | 588 | 147.8 |
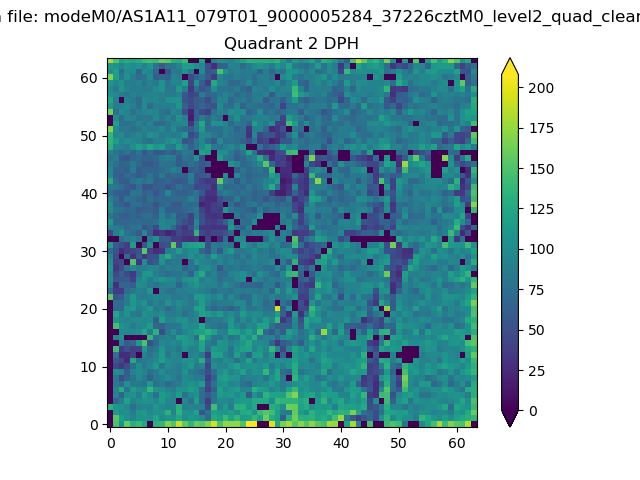
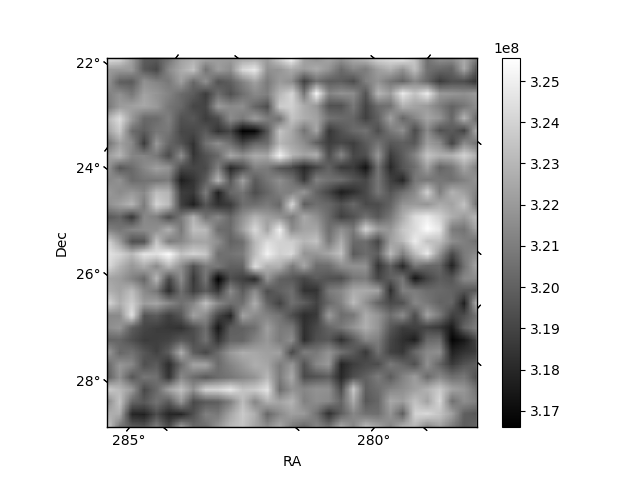
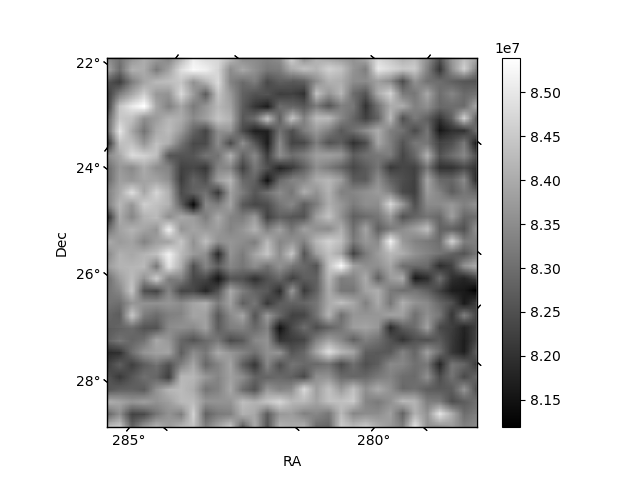
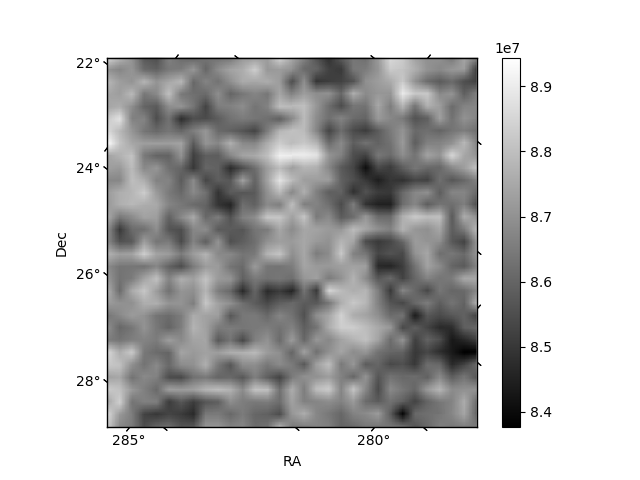
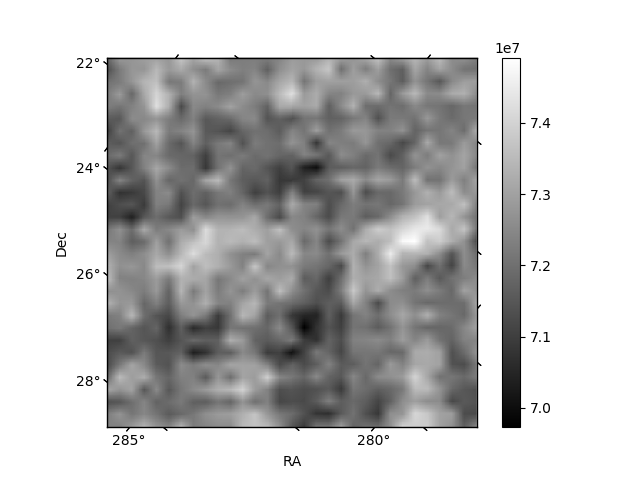
Histogram calculated using DETX and DETY for each event in the final _common_clean file
| Quadrant A | 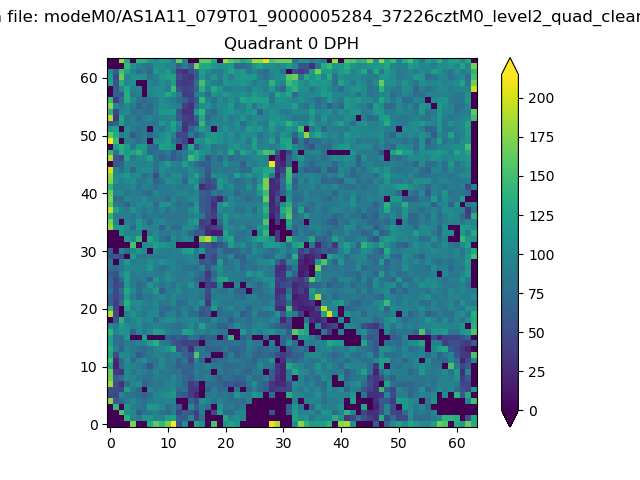 |
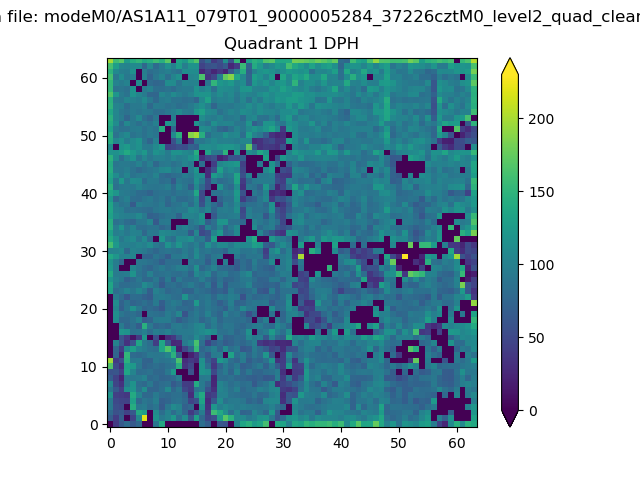 |
Quadrant B |
|---|---|---|---|
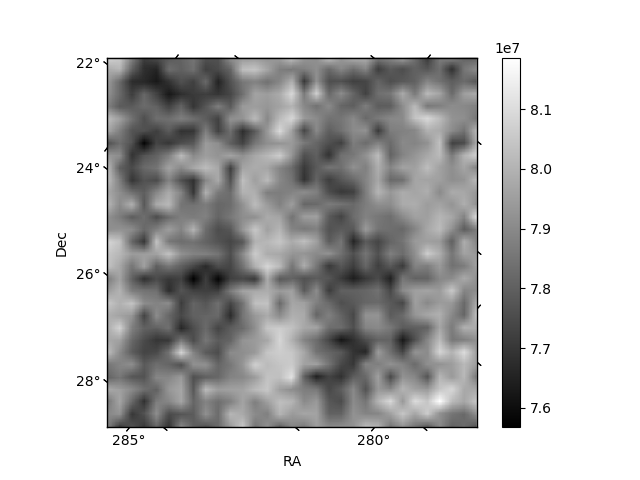
| Quadrant D | 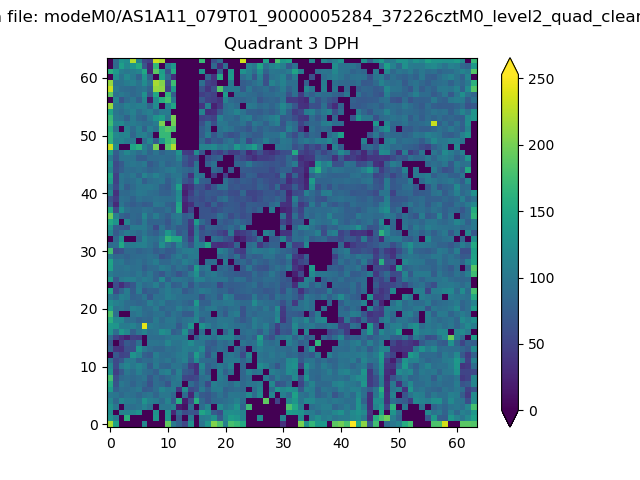 |
 |
Quadrant C |
| Plot type | Count rate plots | Images |
|---|---|---|
| Comparison with Poisson distribution Blue bars denote a histogram of data divided into 1 sec bins. Red curve is a Poisson curve with rate = median count rate of data. |
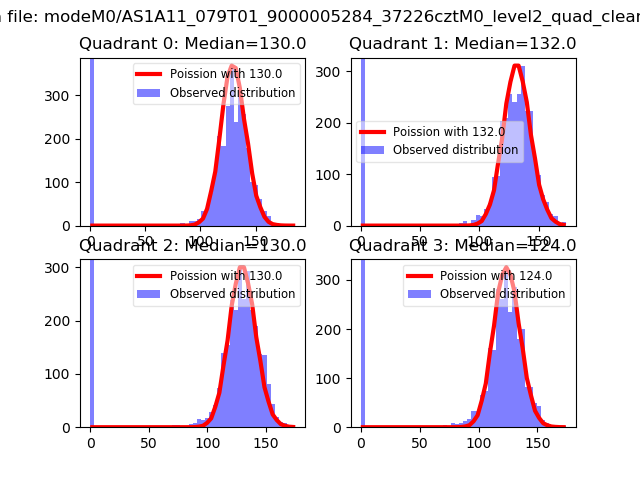 |
 |
| Quadrant-wise count rates Data is divided into 100 sec bins |
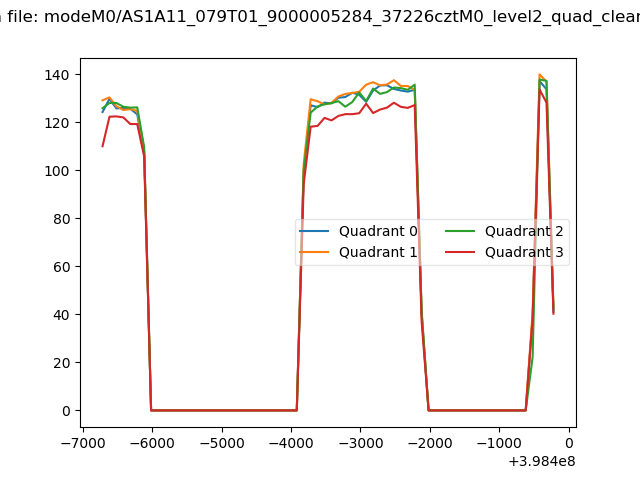 |
|
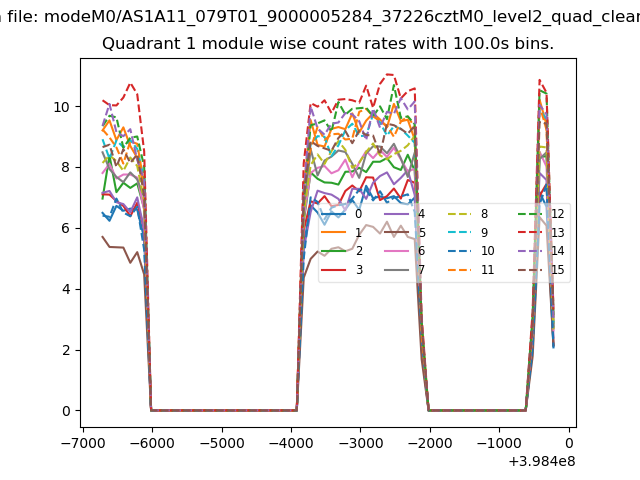
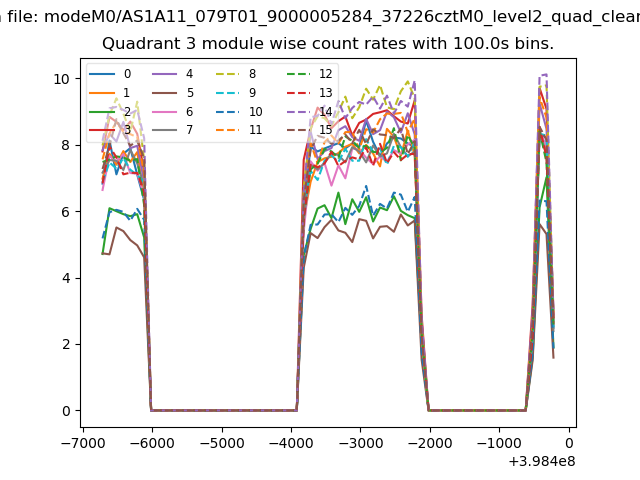
| Module-wise count rates for Quadrant A Data is divided into 100 sec bins |
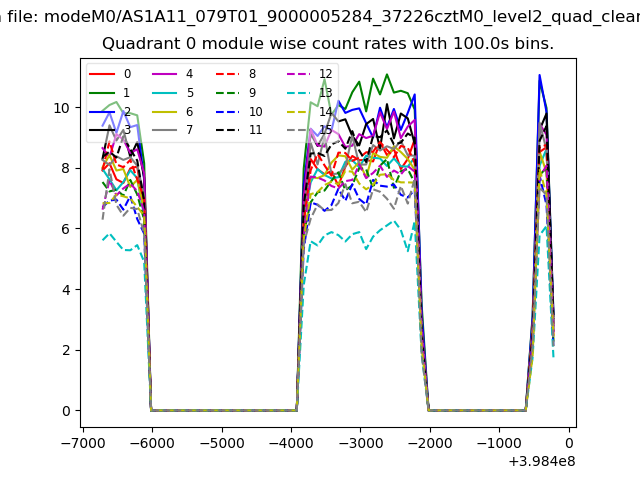 |
 |
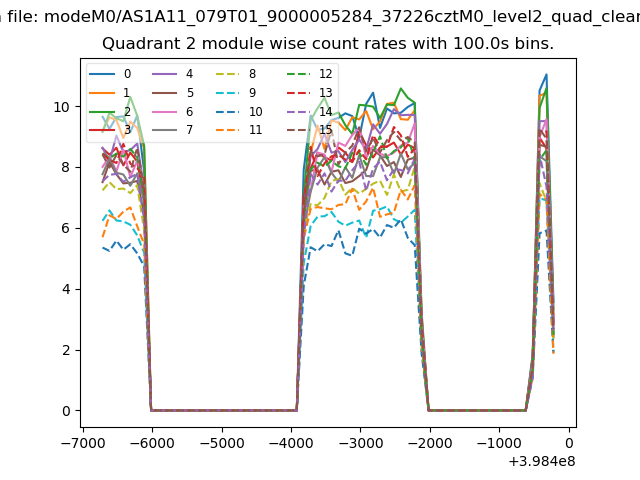
| Module-wise count rates for Quadrant B Data is divided into 100 sec bins |
 |
 |
| Module-wise count rates for Quadrant C Data is divided into 100 sec bins |
 |
 |
| Module-wise count rates for Quadrant D Data is divided into 100 sec bins |
 |
 |
| Parameter | Plot |
|---|---|
| CZT HV Monitor | 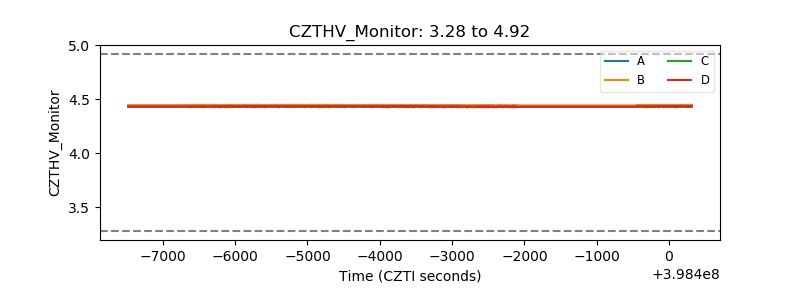 |
| D_VDD | 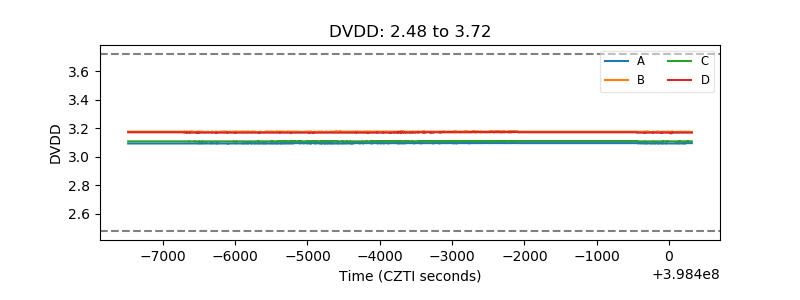 |
| Temperature 1 | 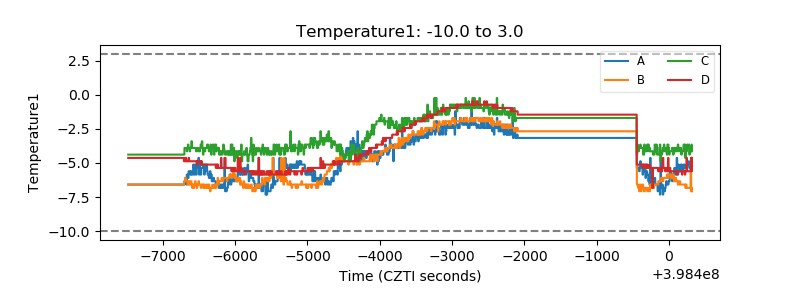 |
| Veto HV Monitor | 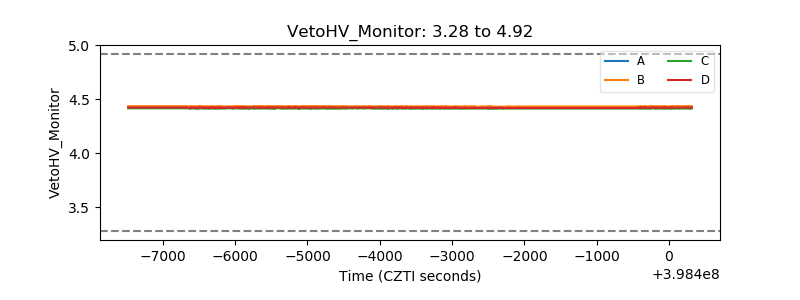 |
| Veto LLD | 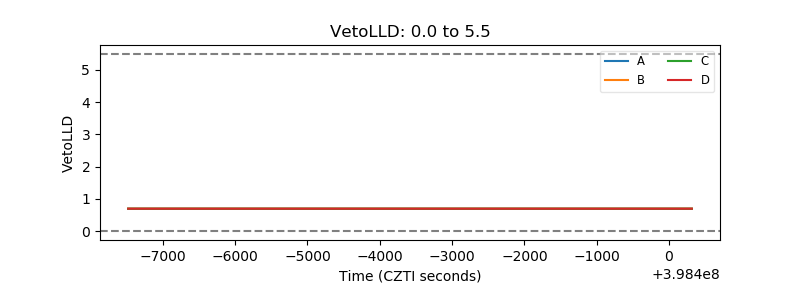 |
| Alpha Counter | 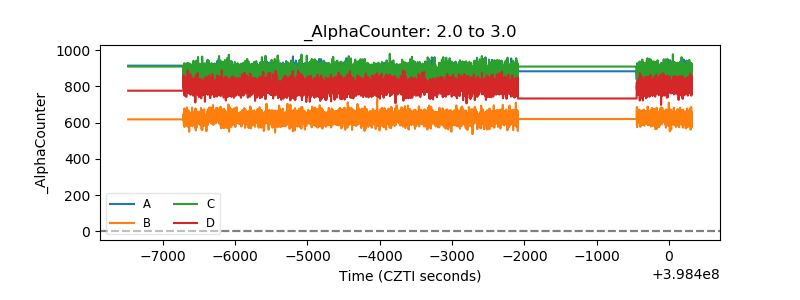 |
| _CPM_Rate | 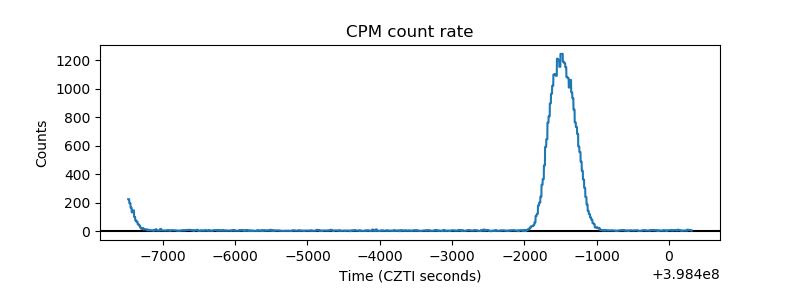 |
| CZT Counter | 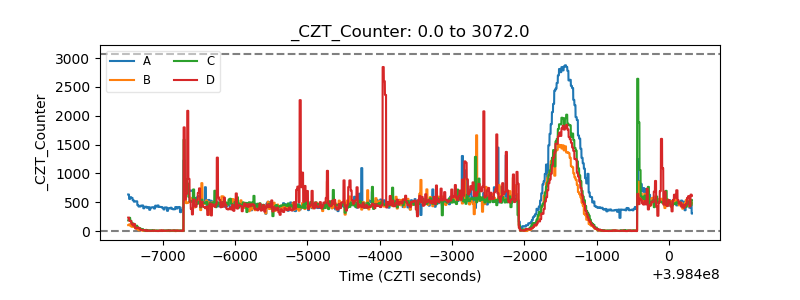 |
| +2.5 Volts monitor | 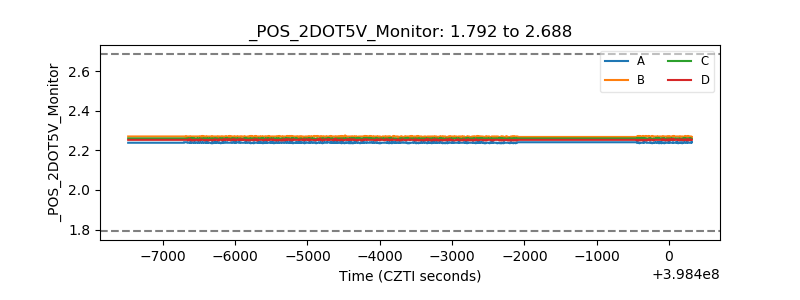 |
| +5 Volts monitor | 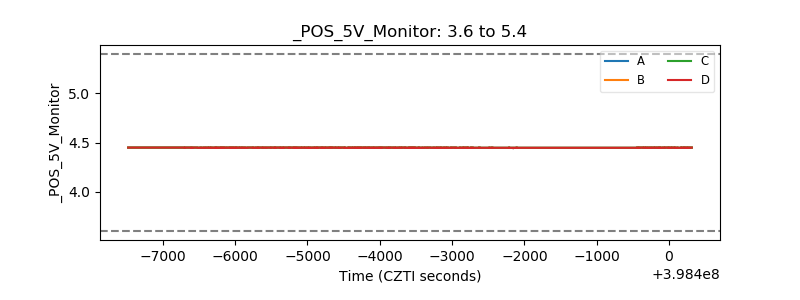 |
| _ROLL_ROT | 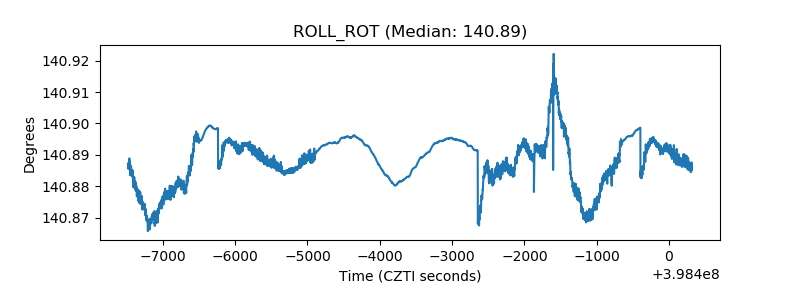 |
| _Roll_DEC | 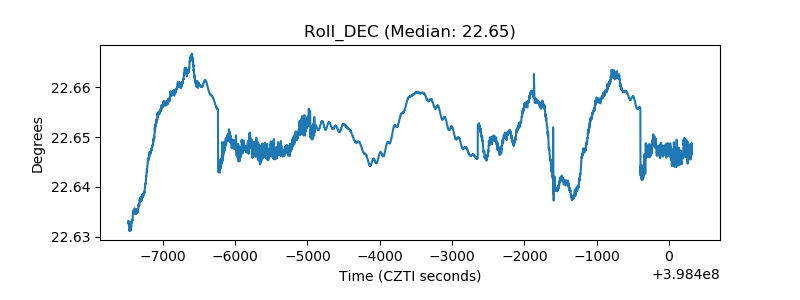 |
| _Roll_RA | 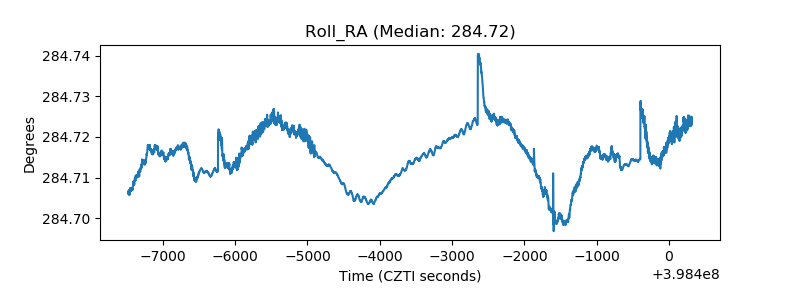 |
| Veto Counter | 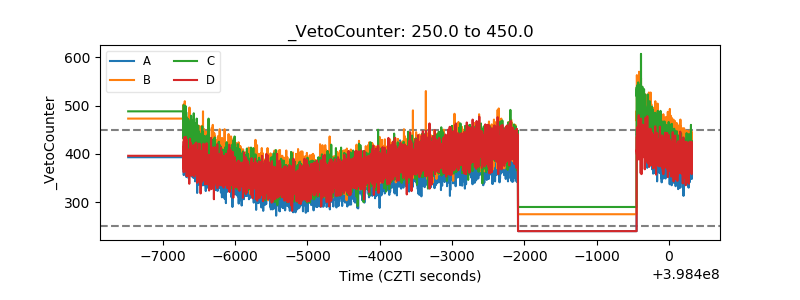 |