| Param | Original file | Final file |
|---|---|---|
| Filename | modeM0/AS1A10_123T11_9000005286_37228cztM0_level2.evt | modeM0/AS1A10_123T11_9000005286_37228cztM0_level2_quad_clean.evt |
| Size (bytes) | 132,514,560 | 15,670,080 |
| Size | 126.4 MB | 14.9 MB |
| Events in quadrant A | 933,934 | 89,627 |
| Events in quadrant B | 981,320 | 89,254 |
| Events in quadrant C | 947,411 | 87,324 |
| Events in quadrant D | 1,034,553 | 84,927 |
| Mode M0 | |||
|---|---|---|---|
| Quadrant | BADHDUFLAG | Total packets | Discarded packets |
| A | 0 | 3753 | 2 |
| B | 0 | 3908 | 1 |
| C | 0 | 3724 | 1 |
| D | 0 | 4126 | 1 |
| Mode M9 | |||
|---|---|---|---|
| Quadrant | BADHDUFLAG | Total packets | Discarded packets |
| A | 0 | 17 | 0 |
| B | 0 | 17 | 0 |
| C | 0 | 17 | 0 |
| D | 0 | 17 | 0 |
| Mode SS | |||
|---|---|---|---|
| Quadrant | BADHDUFLAG | Total packets | Discarded packets |
| A | 0 | 36 | 0 |
| B | 0 | 36 | 0 |
| C | 0 | 36 | 0 |
| D | 0 | 36 | 0 |
| Quadrant | Total seconds | Saturated seconds | Saturation percentage |
|---|---|---|---|
| A | 1666 | 9 | 0.540216% |
| B | 1666 | 13 | 0.780312% |
| C | 1666 | 23 | 1.380552% |
| D | 1666 | 20 | 1.200480% |
Noise dominated data is calculated using 1-second bins in cleaned event files. If a bin has >2000 counts, and if more than 50% of those come from <1% of pixels, then it is considered to be noise-dominated and hence unusable.
| Quadrant | # 1 sec bins | Bins with >0 counts | Bins with >2000 counts | High rate bins dominated by noise | Noise dominated (total time) | Noise dominated (detector-on time) | Marked lightcurve |
|---|---|---|---|---|---|---|---|
| A | 3429 | 1667 | 1 | 1 | 0.03% | 0.06% | 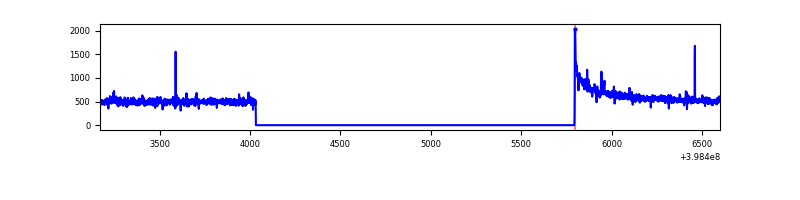 |
| B | 3429 | 1667 | 6 | 6 | 0.17% | 0.36% | 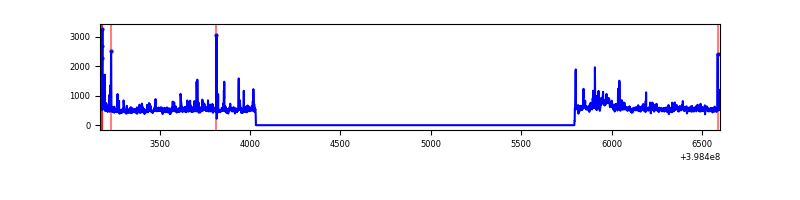 |
| C | 3429 | 1667 | 17 | 17 | 0.50% | 1.02% | 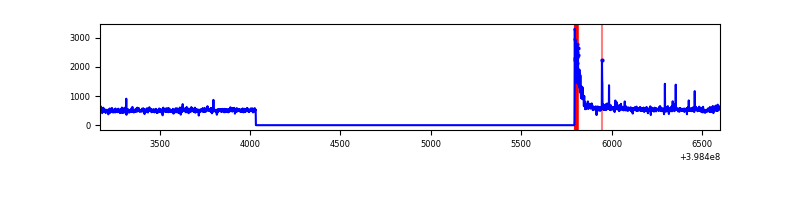 |
| D | 3429 | 1667 | 16 | 16 | 0.47% | 0.96% | 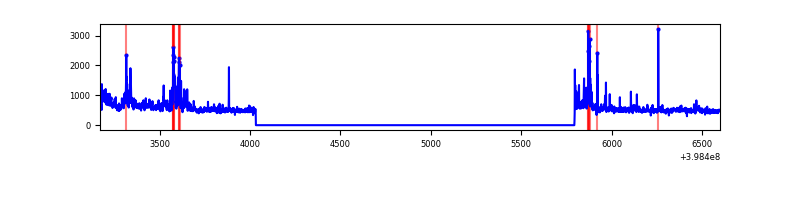 |
Top three noisy pixels from each quadrant. If the there are fewer than three noisy pixels in the level2.evt file, extra rows are filled as -1
| Pixel properties | Quadrant properties | ||||||
|---|---|---|---|---|---|---|---|
| Quadrant | DetID | PixID | Counts | Sigma | Mean | Median | Sigma |
| A | 10 | 83 | 108102 | 2452.76 | 209 | 206 | 44.0 |
| A | 15 | 223 | 9368 | 208.28 | 209 | 206 | 44.0 |
| A | 13 | 248 | 2716 | 57.06 | 209 | 206 | 44.0 |
| B | 0 | 213 | 64309 | 1525.64 | 209 | 204 | 42.0 |
| B | 5 | 172 | 50700 | 1201.76 | 209 | 204 | 42.0 |
| B | 0 | 230 | 20044 | 472.17 | 209 | 204 | 42.0 |
| C | 15 | 214 | 73387 | 1507.75 | 203 | 204 | 48.5 |
| C | 0 | 10 | 63681 | 1307.78 | 203 | 204 | 48.5 |
| C | 14 | 254 | 7258 | 145.33 | 203 | 204 | 48.5 |
| D | 12 | 248 | 72855 | 1419.02 | 203 | 197 | 51.2 |
| D | 10 | 253 | 57662 | 1122.3 | 203 | 197 | 51.2 |
| D | 12 | 235 | 25694 | 497.96 | 203 | 197 | 51.2 |
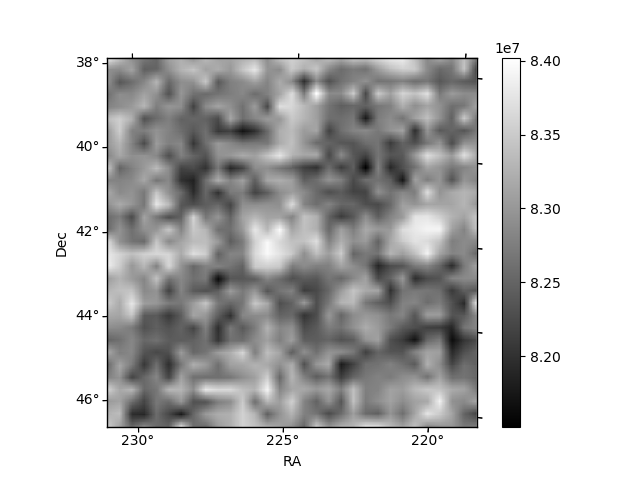
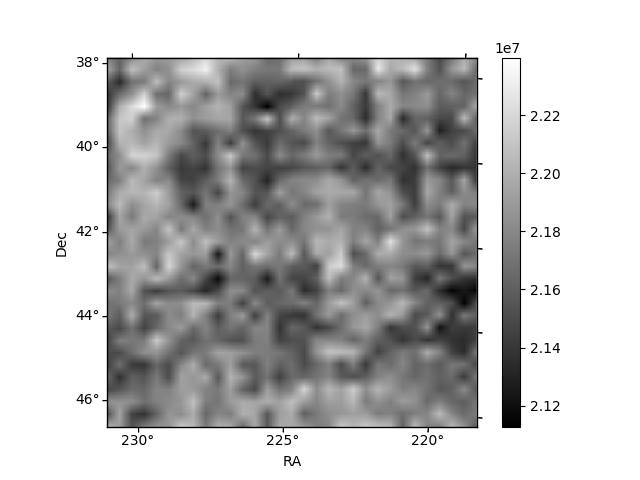
Histogram calculated using DETX and DETY for each event in the final _common_clean file
| Quadrant A | 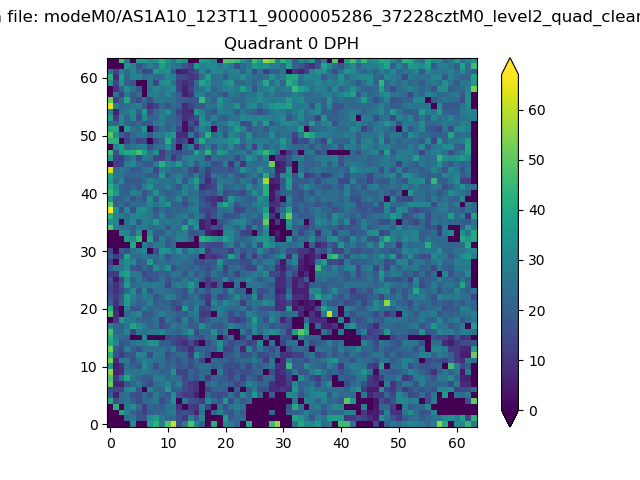 |
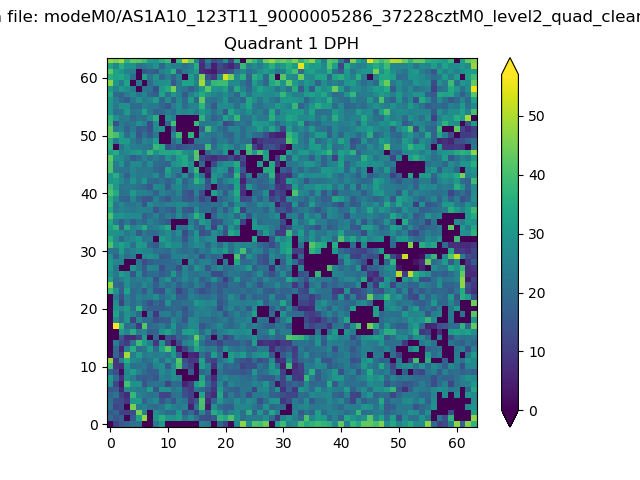 |
Quadrant B |
|---|---|---|---|
| Quadrant D | 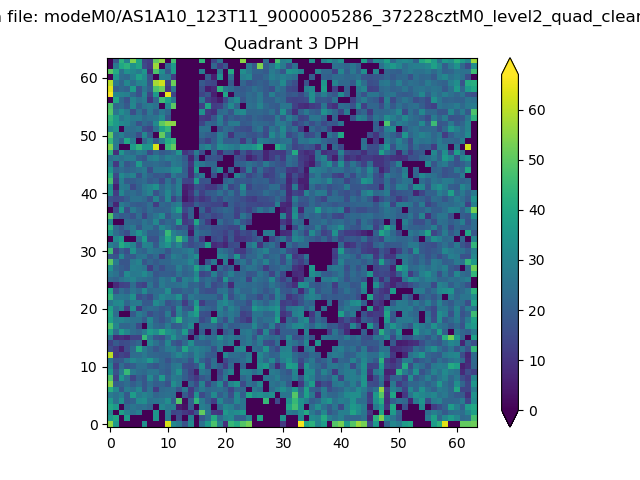 |
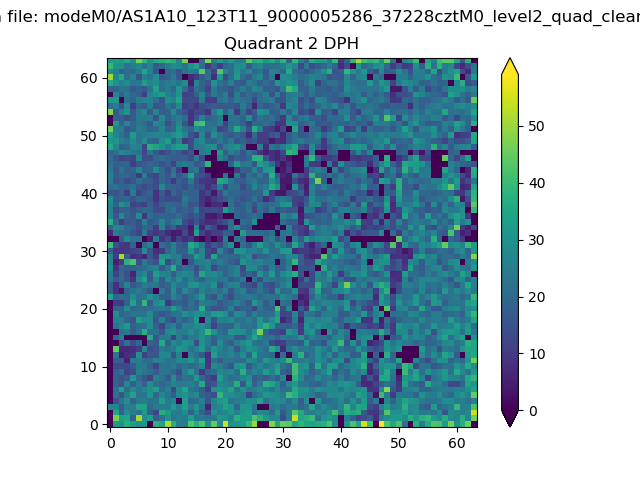 |
Quadrant C |
| Plot type | Count rate plots | Images |
|---|---|---|
| Comparison with Poisson distribution Blue bars denote a histogram of data divided into 1 sec bins. Red curve is a Poisson curve with rate = median count rate of data. |
 |
 |
| Quadrant-wise count rates Data is divided into 100 sec bins |
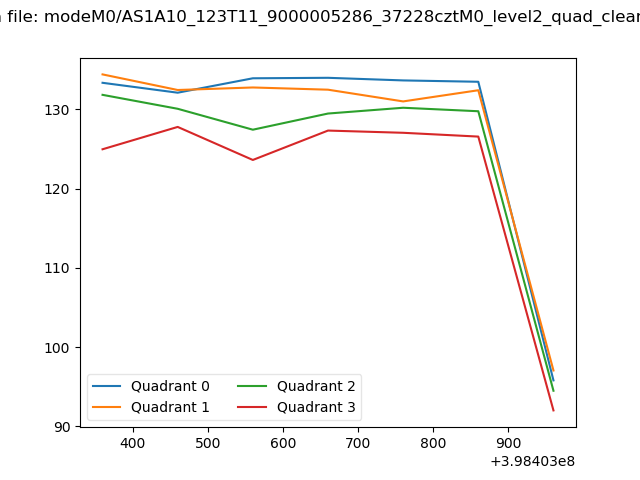 |
|
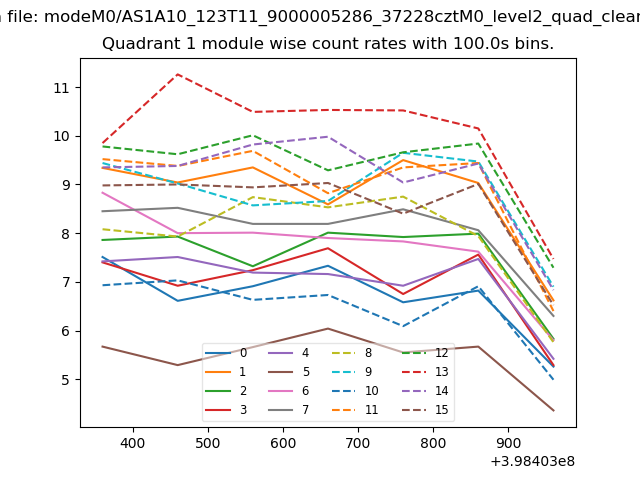
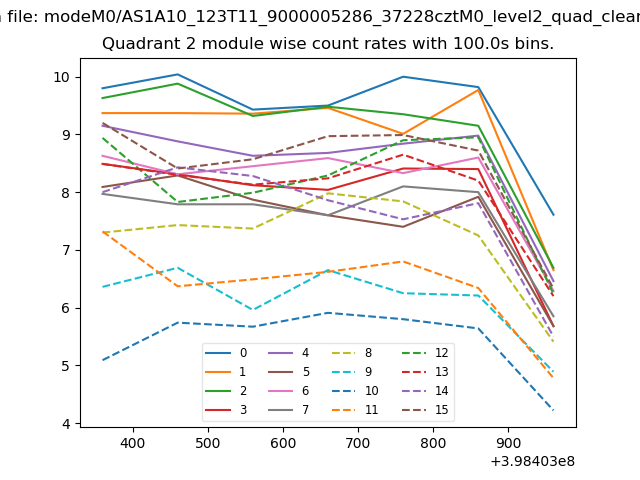
| Module-wise count rates for Quadrant A Data is divided into 100 sec bins |
 |
 |
| Module-wise count rates for Quadrant B Data is divided into 100 sec bins |
 |
 |
| Module-wise count rates for Quadrant C Data is divided into 100 sec bins |
 |
 |
| Module-wise count rates for Quadrant D Data is divided into 100 sec bins |
 |
 |
| Parameter | Plot |
|---|---|
| CZT HV Monitor | 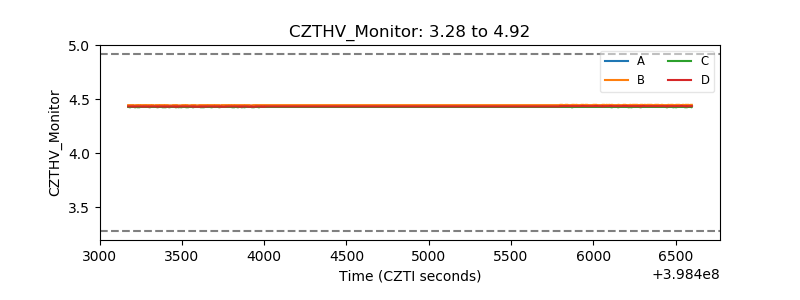 |
| D_VDD | 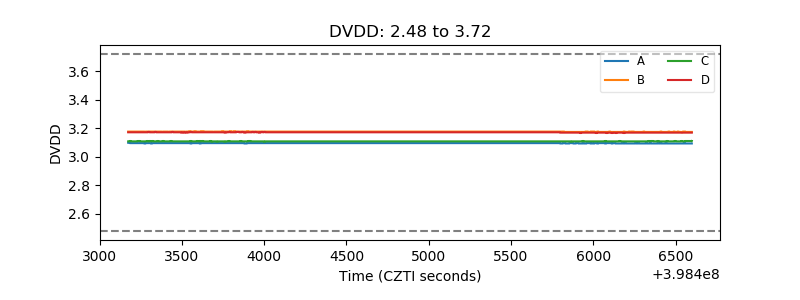 |
| Temperature 1 | 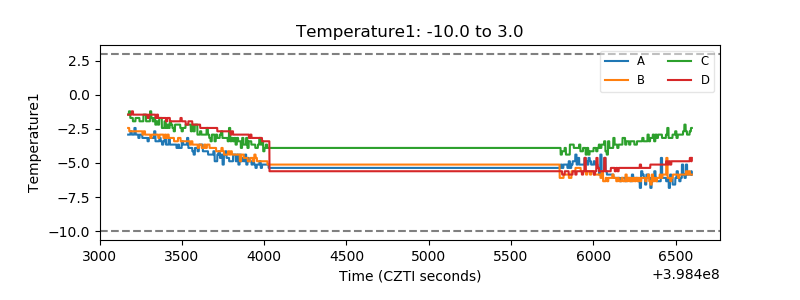 |
| Veto HV Monitor | 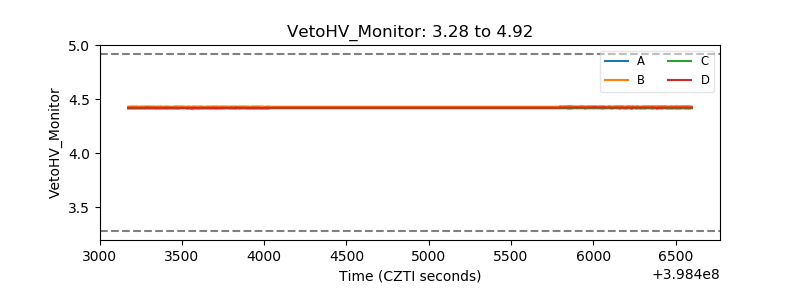 |
| Veto LLD | 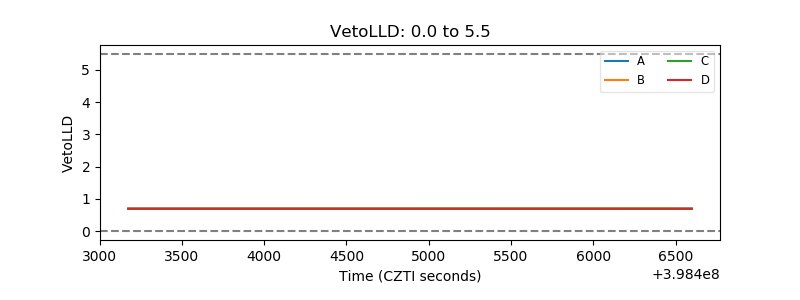 |
| Alpha Counter | 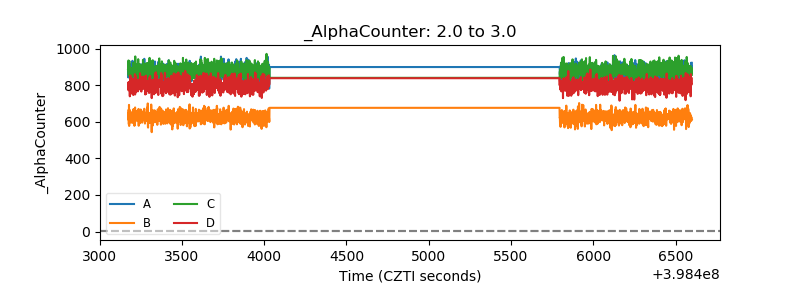 |
| _CPM_Rate | 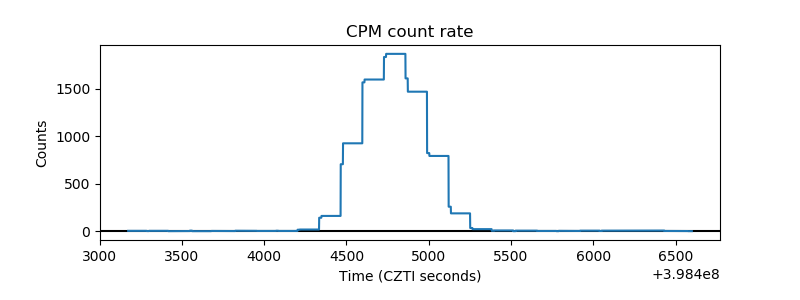 |
| CZT Counter | 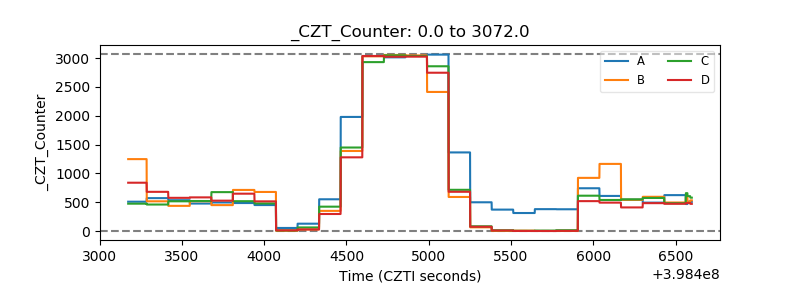 |
| +2.5 Volts monitor | 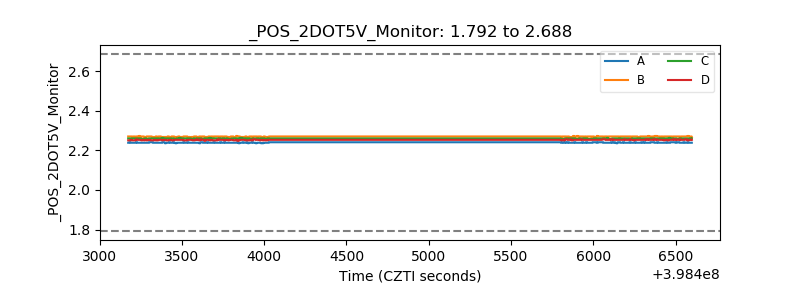 |
| +5 Volts monitor | 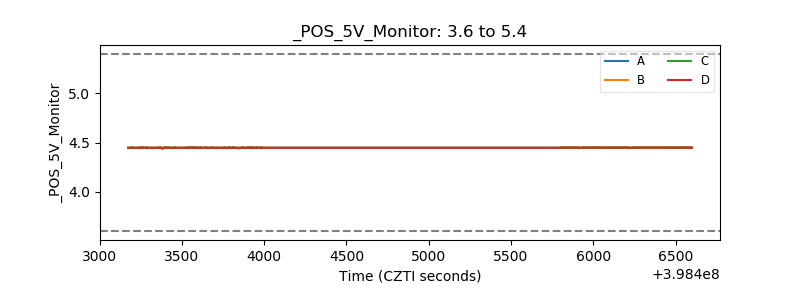 |
| _ROLL_ROT |  |
| _Roll_DEC |  |
| _Roll_RA | 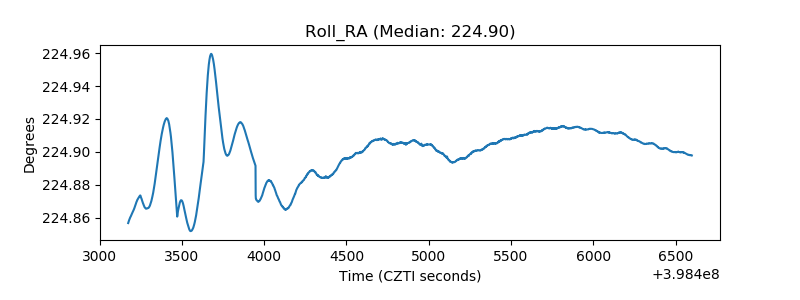 |
| Veto Counter | 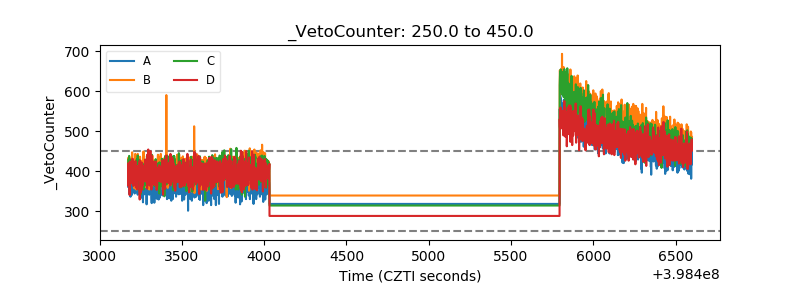 |