| Param | Original file | Final file |
|---|---|---|
| Filename | modeM0/AS1A10_123T11_9000005286_37229cztM0_level2.evt | modeM0/AS1A10_123T11_9000005286_37229cztM0_level2_quad_clean.evt |
| Size (bytes) | 530,867,520 | 72,665,280 |
| Size | 506.3 MB | 69.3 MB |
| Events in quadrant A | 4,266,221 | 441,786 |
| Events in quadrant B | 3,143,351 | 491,759 |
| Events in quadrant C | 2,958,178 | 478,317 |
| Events in quadrant D | 5,348,280 | 414,431 |
| Mode M0 | |||
|---|---|---|---|
| Quadrant | BADHDUFLAG | Total packets | Discarded packets |
| A | 0 | 15943 | 3 |
| B | 0 | 12653 | 2 |
| C | 0 | 11804 | 2 |
| D | 0 | 19343 | 2 |
| Mode M9 | |||
|---|---|---|---|
| Quadrant | BADHDUFLAG | Total packets | Discarded packets |
| A | 0 | 36 | 0 |
| B | 0 | 36 | 0 |
| C | 0 | 36 | 0 |
| D | 0 | 36 | 0 |
| Mode SS | |||
|---|---|---|---|
| Quadrant | BADHDUFLAG | Total packets | Discarded packets |
| A | 0 | 112 | 0 |
| B | 0 | 112 | 0 |
| C | 0 | 112 | 0 |
| D | 0 | 112 | 0 |
| Quadrant | Total seconds | Saturated seconds | Saturation percentage |
|---|---|---|---|
| A | 5328 | 598 | 11.223724% |
| B | 5328 | 45 | 0.844595% |
| C | 5328 | 69 | 1.295045% |
| D | 5328 | 797 | 14.958709% |
Noise dominated data is calculated using 1-second bins in cleaned event files. If a bin has >2000 counts, and if more than 50% of those come from <1% of pixels, then it is considered to be noise-dominated and hence unusable.
| Quadrant | # 1 sec bins | Bins with >0 counts | Bins with >2000 counts | High rate bins dominated by noise | Noise dominated (total time) | Noise dominated (detector-on time) | Marked lightcurve |
|---|---|---|---|---|---|---|---|
| A | 8974 | 5329 | 499 | 499 | 5.56% | 9.36% | 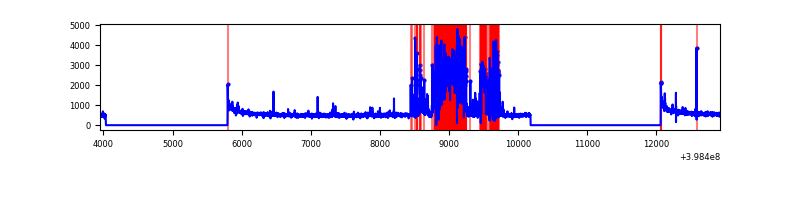 |
| B | 8974 | 5330 | 21 | 21 | 0.23% | 0.39% | 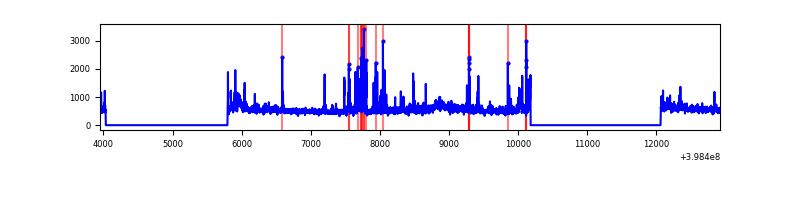 |
| C | 8974 | 5330 | 49 | 49 | 0.55% | 0.92% | 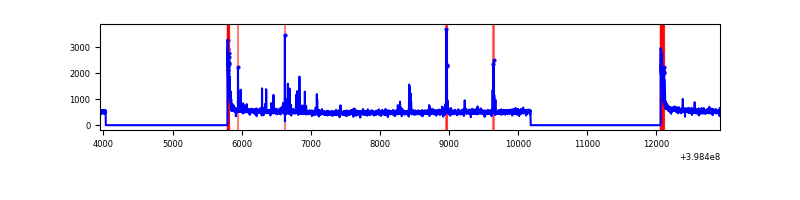 |
| D | 8974 | 5330 | 760 | 760 | 8.47% | 14.26% | 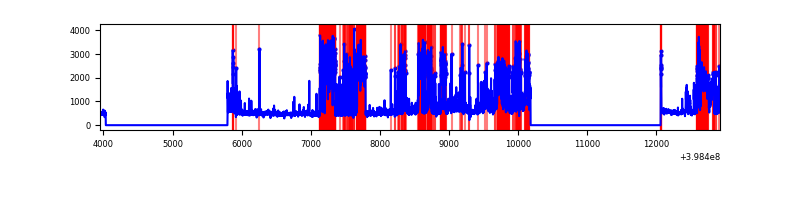 |
Top three noisy pixels from each quadrant. If the there are fewer than three noisy pixels in the level2.evt file, extra rows are filled as -1
| Pixel properties | Quadrant properties | ||||||
|---|---|---|---|---|---|---|---|
| Quadrant | DetID | PixID | Counts | Sigma | Mean | Median | Sigma |
| A | 15 | 237 | 1466584 | 11721.52 | 628 | 617 | 125.1 |
| A | 10 | 83 | 256285 | 2044.26 | 628 | 617 | 125.1 |
| A | 13 | 248 | 50514 | 398.96 | 628 | 617 | 125.1 |
| B | 5 | 172 | 173964 | 1391.5 | 658 | 644 | 124.6 |
| B | 0 | 213 | 123857 | 989.22 | 658 | 644 | 124.6 |
| B | 0 | 230 | 121631 | 971.35 | 658 | 644 | 124.6 |
| C | 15 | 214 | 226908 | 1545.35 | 634 | 638 | 146.4 |
| C | 0 | 10 | 150767 | 1025.33 | 634 | 638 | 146.4 |
| C | 8 | 79 | 48388 | 326.12 | 634 | 638 | 146.4 |
| D | 12 | 248 | 1389796 | 9477.57 | 607 | 591 | 146.6 |
| D | 10 | 253 | 645062 | 4396.77 | 607 | 591 | 146.6 |
| D | 2 | 249 | 403881 | 2751.37 | 607 | 591 | 146.6 |
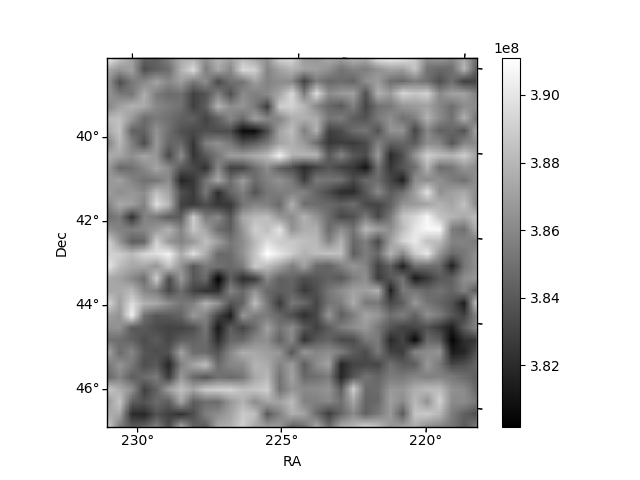
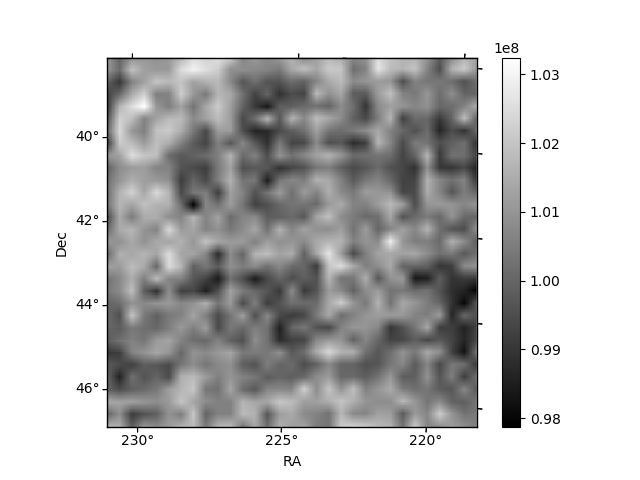
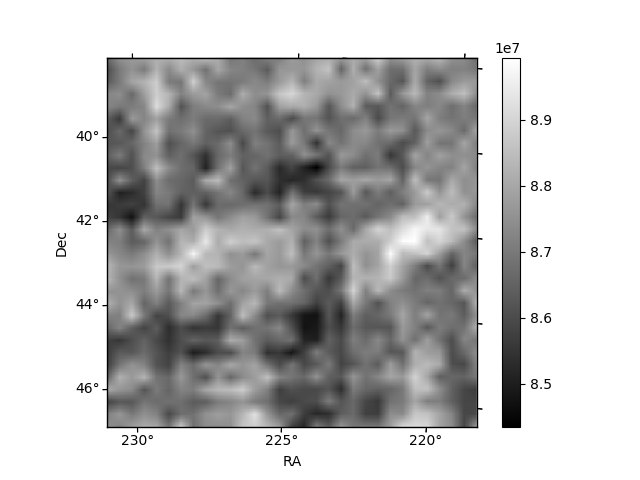
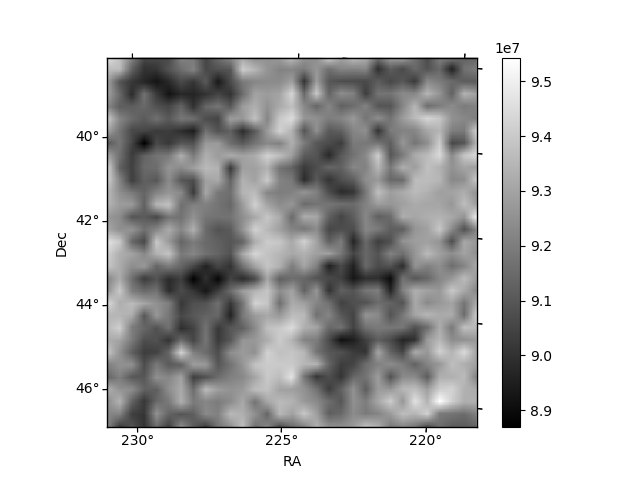
Histogram calculated using DETX and DETY for each event in the final _common_clean file
| Quadrant A | 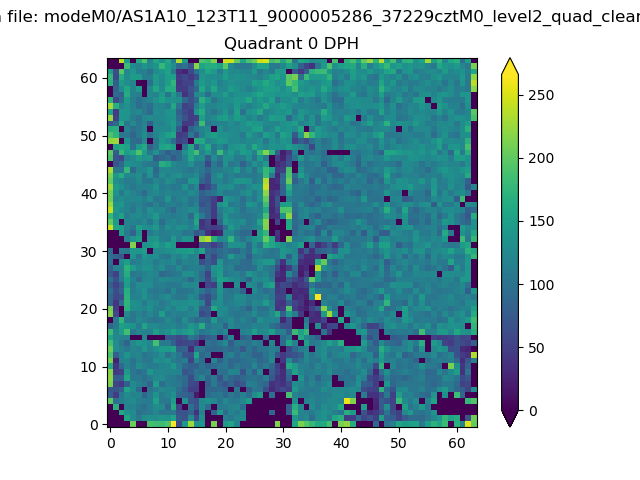 |
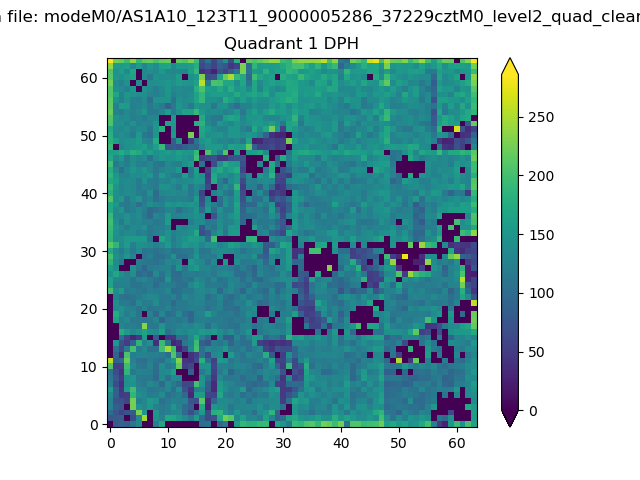 |
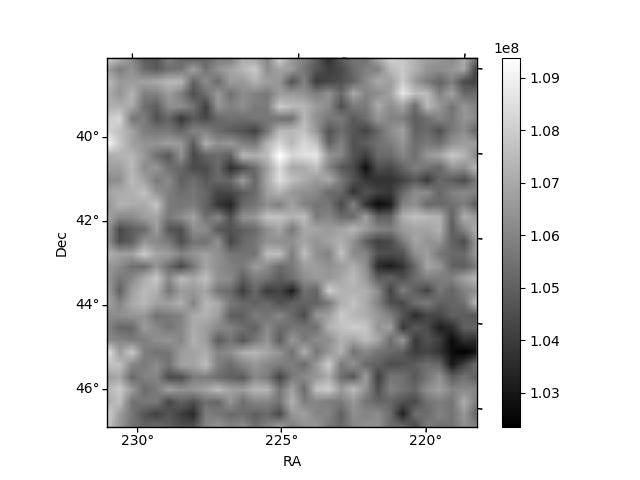
Quadrant B |
|---|---|---|---|
| Quadrant D | 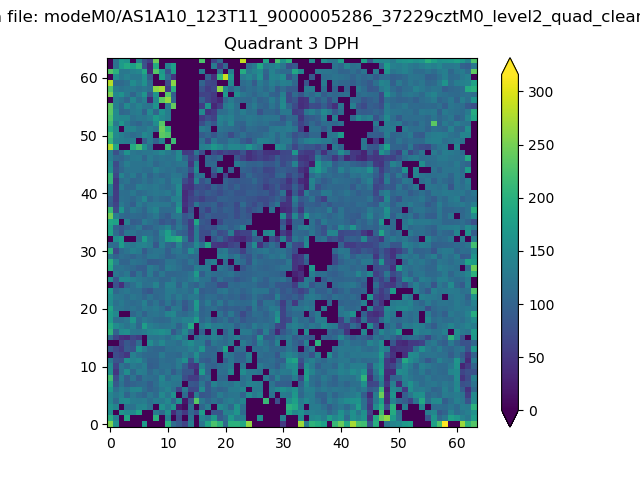 |
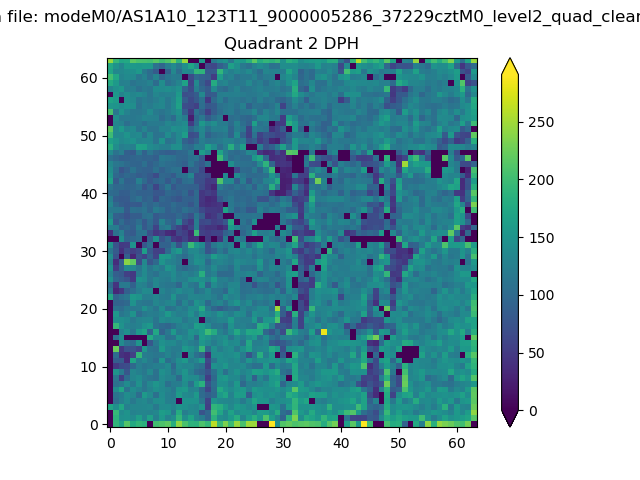 |
Quadrant C |
| Plot type | Count rate plots | Images |
|---|---|---|
| Comparison with Poisson distribution Blue bars denote a histogram of data divided into 1 sec bins. Red curve is a Poisson curve with rate = median count rate of data. |
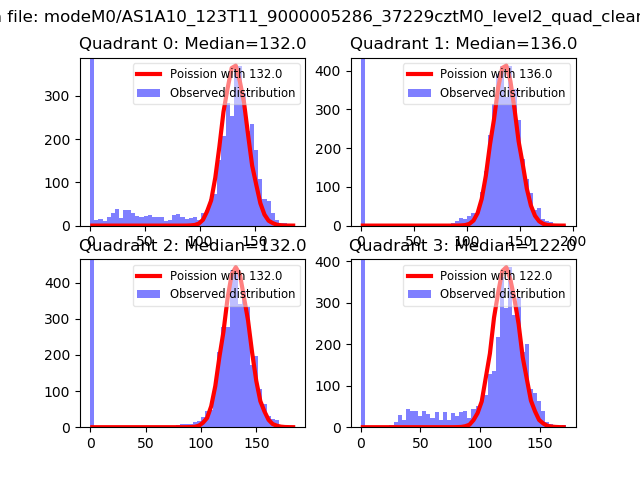 |
 |
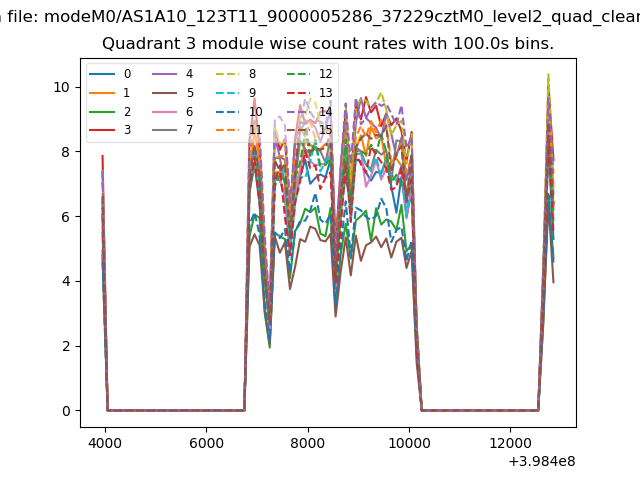
| Quadrant-wise count rates Data is divided into 100 sec bins |
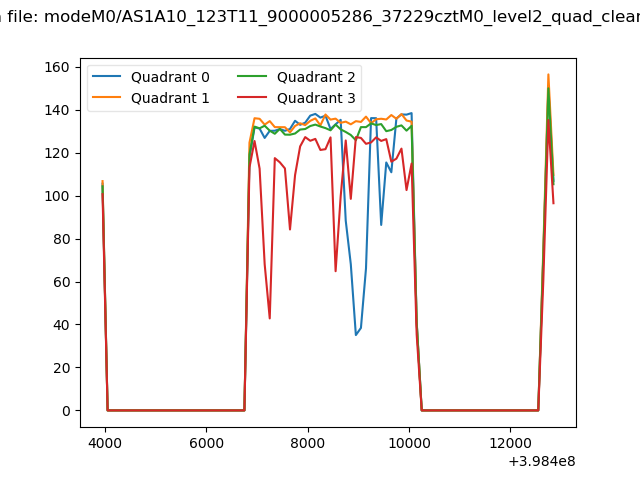 |
|
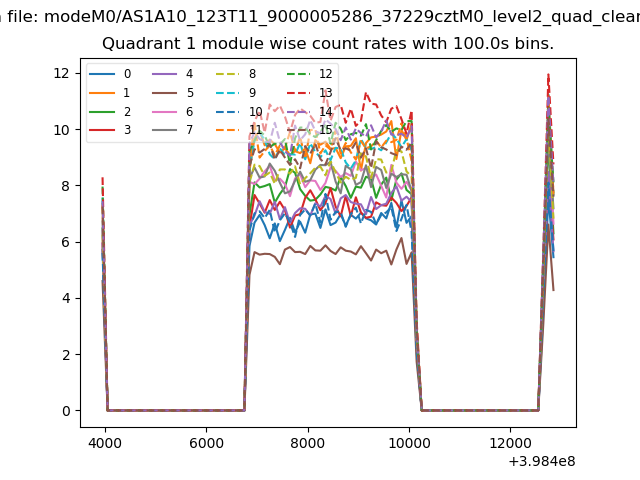
| Module-wise count rates for Quadrant A Data is divided into 100 sec bins |
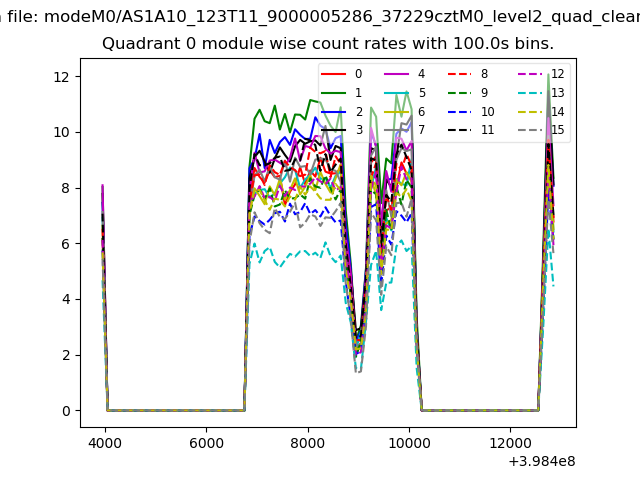 |
 |
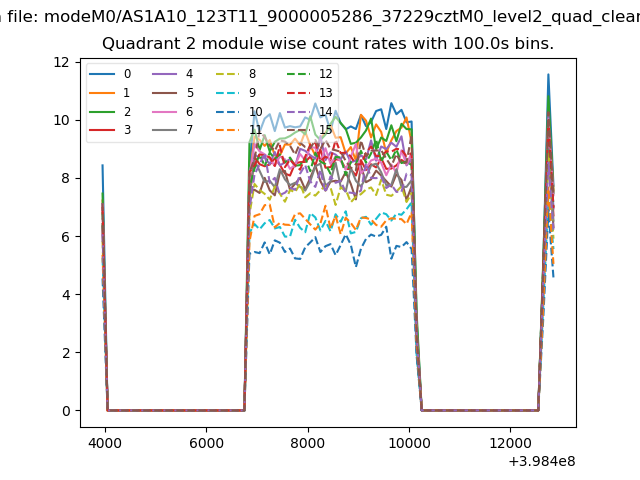
| Module-wise count rates for Quadrant B Data is divided into 100 sec bins |
 |
 |
| Module-wise count rates for Quadrant C Data is divided into 100 sec bins |
 |
 |
| Module-wise count rates for Quadrant D Data is divided into 100 sec bins |
 |
 |
| Parameter | Plot |
|---|---|
| CZT HV Monitor | 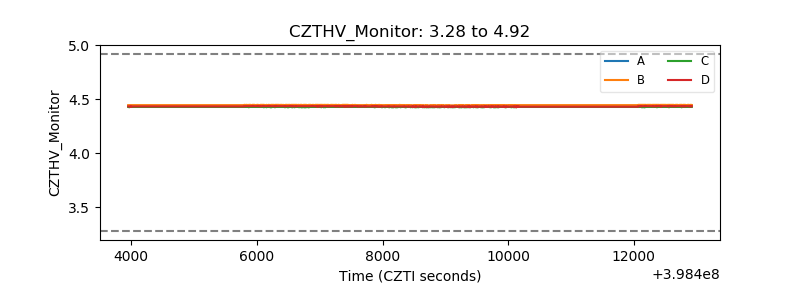 |
| D_VDD | 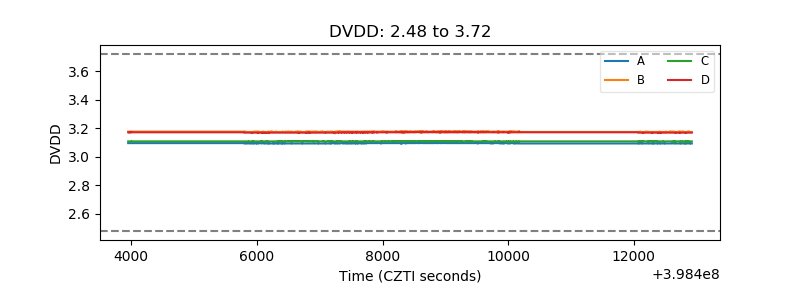 |
| Temperature 1 | 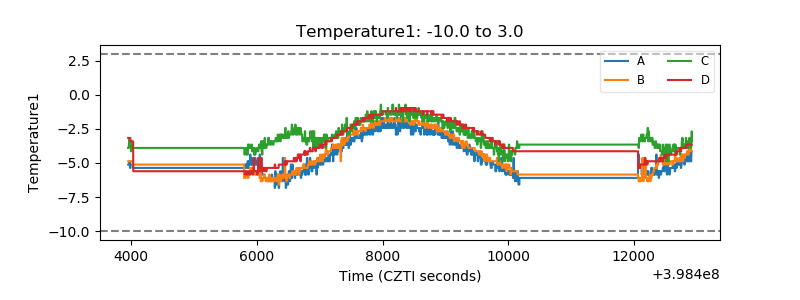 |
| Veto HV Monitor | 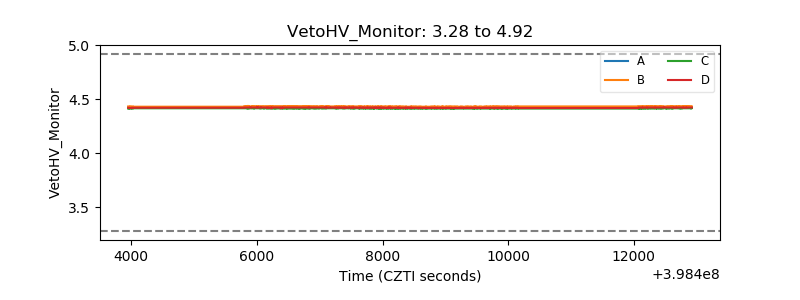 |
| Veto LLD | 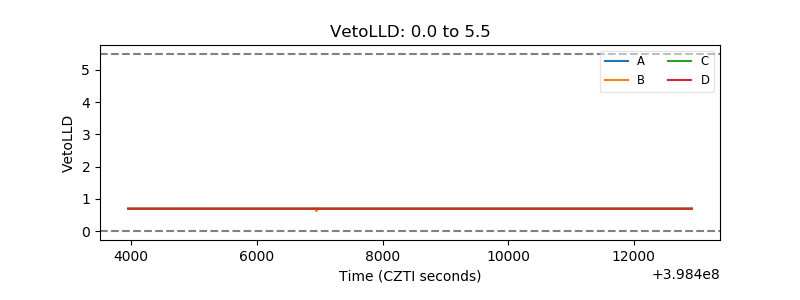 |
| Alpha Counter | 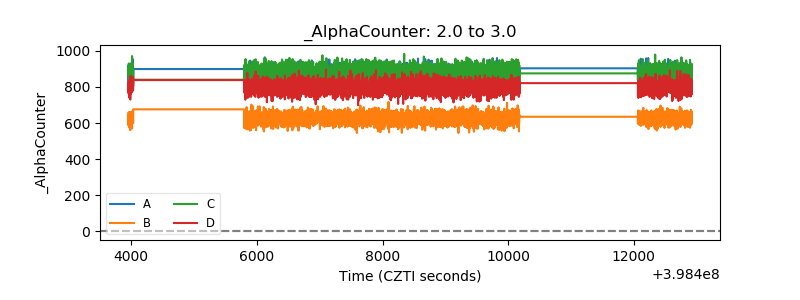 |
| _CPM_Rate |  |
| CZT Counter | 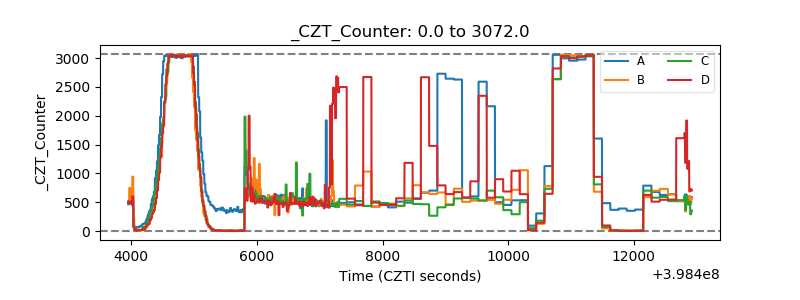 |
| +2.5 Volts monitor | 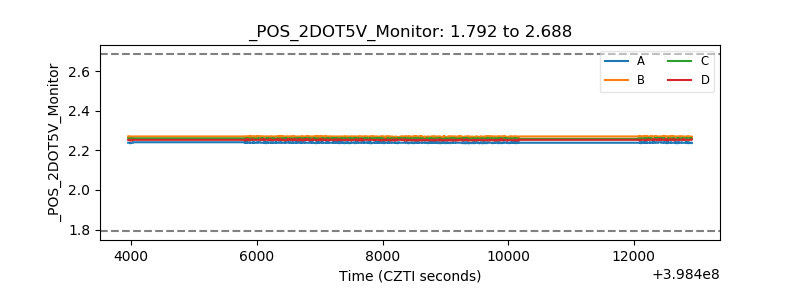 |
| +5 Volts monitor | 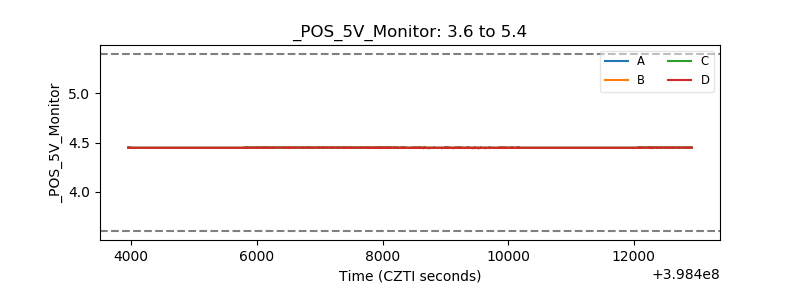 |
| _ROLL_ROT | 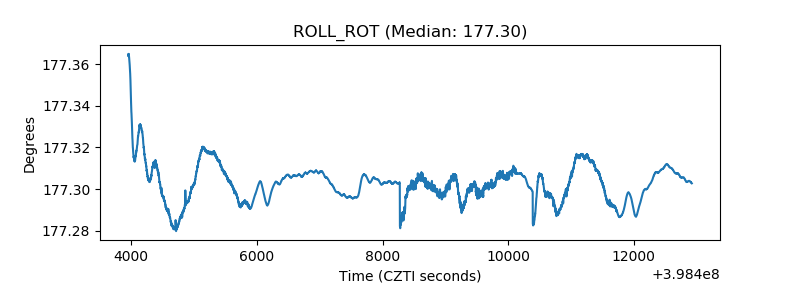 |
| _Roll_DEC | 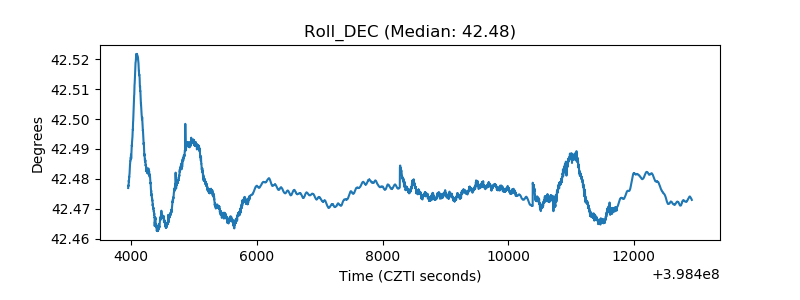 |
| _Roll_RA | 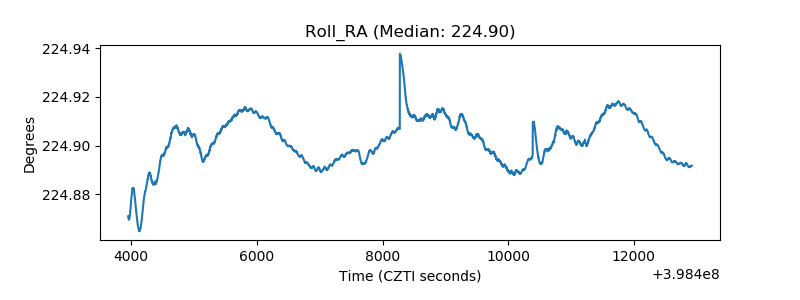 |
| Veto Counter | 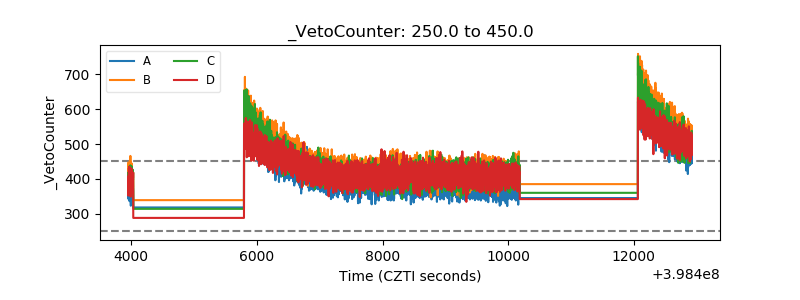 |