| Param | Original file | Final file |
|---|---|---|
| Filename | modeM0/AS1A10_123T11_9000005286_37230cztM0_level2.evt | modeM0/AS1A10_123T11_9000005286_37230cztM0_level2_quad_clean.evt |
| Size (bytes) | 459,264,960 | 90,155,520 |
| Size | 438.0 MB | 86.0 MB |
| Events in quadrant A | 3,121,540 | 613,834 |
| Events in quadrant B | 3,018,490 | 617,539 |
| Events in quadrant C | 2,820,484 | 593,995 |
| Events in quadrant D | 4,604,365 | 549,263 |
| Mode M0 | |||
|---|---|---|---|
| Quadrant | BADHDUFLAG | Total packets | Discarded packets |
| A | 0 | 12283 | 3 |
| B | 0 | 12147 | 2 |
| C | 0 | 11155 | 2 |
| D | 0 | 16963 | 2 |
| Mode M9 | |||
|---|---|---|---|
| Quadrant | BADHDUFLAG | Total packets | Discarded packets |
| A | 0 | 27 | 0 |
| B | 0 | 27 | 0 |
| C | 0 | 27 | 0 |
| D | 0 | 28 | 0 |
| Mode SS | |||
|---|---|---|---|
| Quadrant | BADHDUFLAG | Total packets | Discarded packets |
| A | 0 | 104 | 0 |
| B | 0 | 104 | 0 |
| C | 0 | 104 | 0 |
| D | 0 | 104 | 0 |
| Quadrant | Total seconds | Saturated seconds | Saturation percentage |
|---|---|---|---|
| A | 5071 | 81 | 1.597318% |
| B | 5071 | 37 | 0.729639% |
| C | 5071 | 67 | 1.321238% |
| D | 5071 | 436 | 8.597910% |
Noise dominated data is calculated using 1-second bins in cleaned event files. If a bin has >2000 counts, and if more than 50% of those come from <1% of pixels, then it is considered to be noise-dominated and hence unusable.
| Quadrant | # 1 sec bins | Bins with >0 counts | Bins with >2000 counts | High rate bins dominated by noise | Noise dominated (total time) | Noise dominated (detector-on time) | Marked lightcurve |
|---|---|---|---|---|---|---|---|
| A | 7073 | 5072 | 44 | 44 | 0.62% | 0.87% | 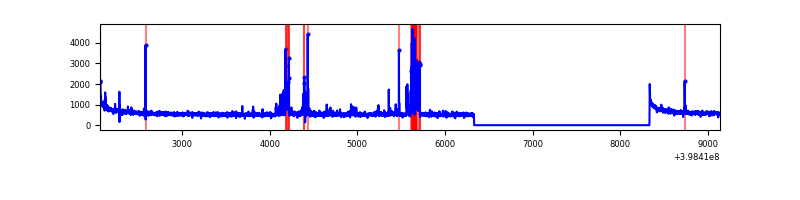 |
| B | 7073 | 5072 | 19 | 19 | 0.27% | 0.37% | 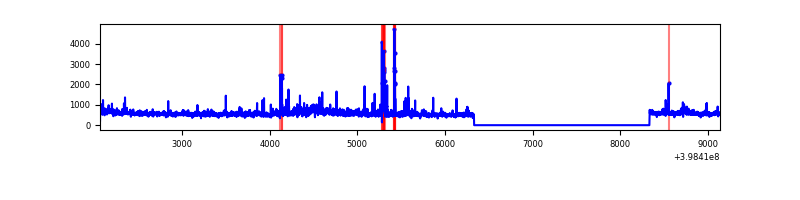 |
| C | 7073 | 5072 | 53 | 53 | 0.75% | 1.04% | 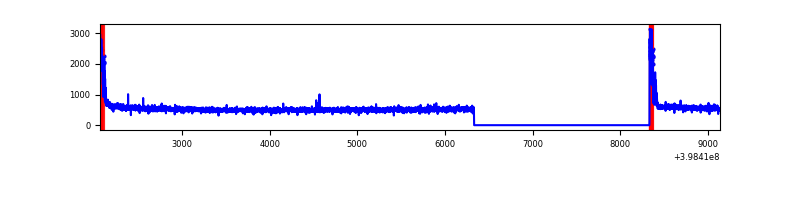 |
| D | 7073 | 5072 | 416 | 416 | 5.88% | 8.20% | 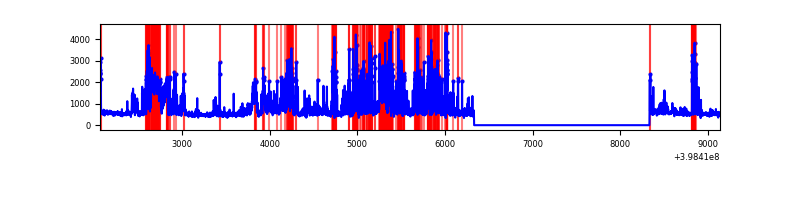 |
Top three noisy pixels from each quadrant. If the there are fewer than three noisy pixels in the level2.evt file, extra rows are filled as -1
| Pixel properties | Quadrant properties | ||||||
|---|---|---|---|---|---|---|---|
| Quadrant | DetID | PixID | Counts | Sigma | Mean | Median | Sigma |
| A | 10 | 83 | 262011 | 2003.83 | 656 | 645 | 130.4 |
| A | 15 | 237 | 253843 | 1941.21 | 656 | 645 | 130.4 |
| A | 13 | 248 | 26390 | 197.38 | 656 | 645 | 130.4 |
| B | 0 | 213 | 120142 | 985.69 | 646 | 634 | 121.2 |
| B | 0 | 230 | 81277 | 665.14 | 646 | 634 | 121.2 |
| B | 0 | 190 | 79618 | 651.45 | 646 | 634 | 121.2 |
| C | 15 | 214 | 217013 | 1523.48 | 619 | 625 | 142.0 |
| C | 0 | 10 | 179247 | 1257.59 | 619 | 625 | 142.0 |
| C | 13 | 61 | 4163 | 24.91 | 619 | 625 | 142.0 |
| D | 2 | 249 | 1127743 | 7617.55 | 615 | 599 | 148.0 |
| D | 10 | 253 | 744017 | 5024.22 | 615 | 599 | 148.0 |
| D | 12 | 235 | 87015 | 584.02 | 615 | 599 | 148.0 |
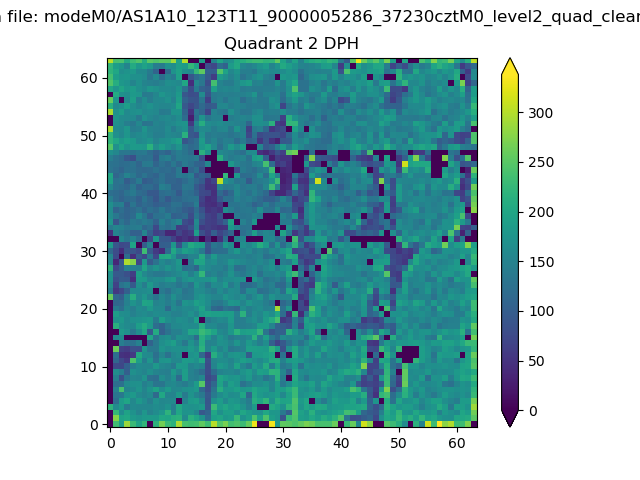
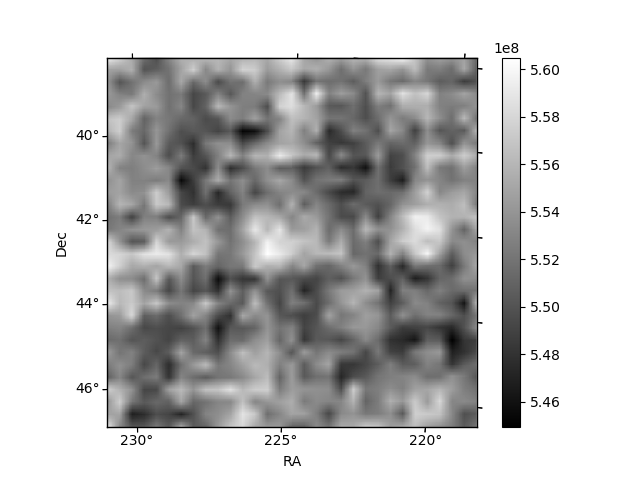
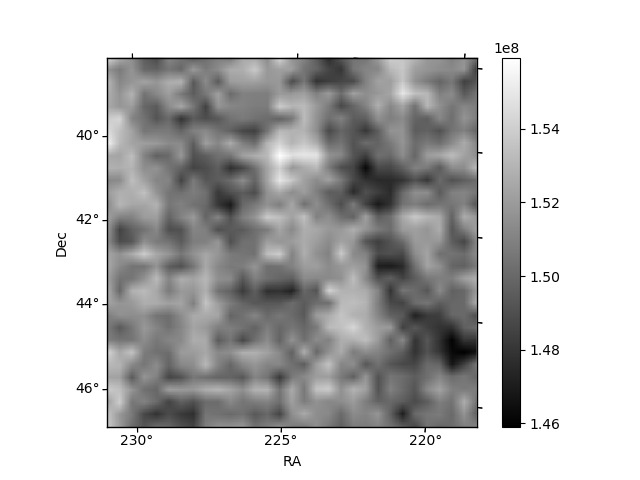
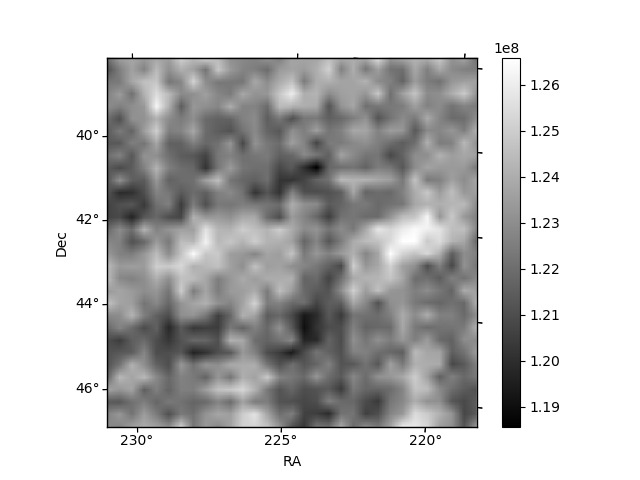
Histogram calculated using DETX and DETY for each event in the final _common_clean file
| Quadrant A | 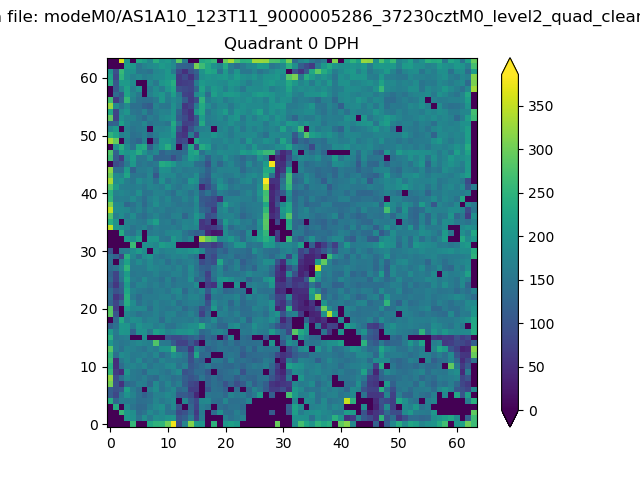 |
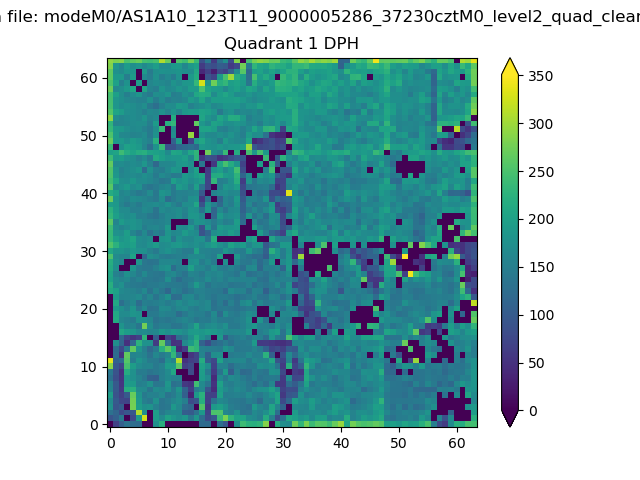 |
Quadrant B |
|---|---|---|---|
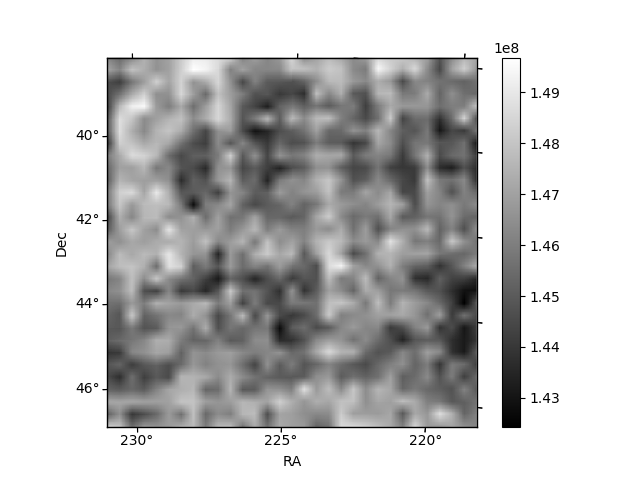
| Quadrant D | 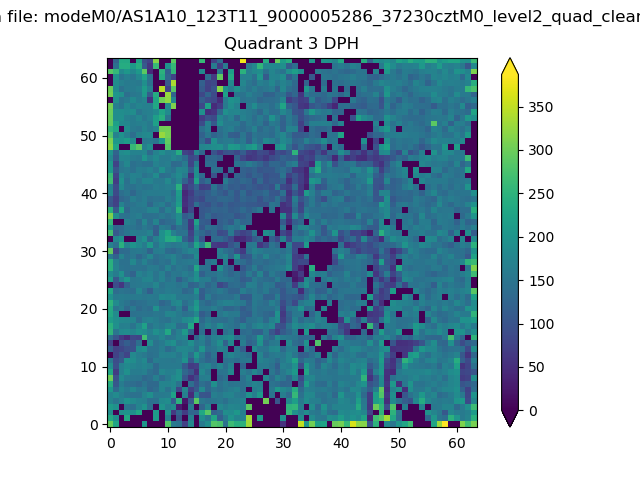 |
 |
Quadrant C |
| Plot type | Count rate plots | Images |
|---|---|---|
| Comparison with Poisson distribution Blue bars denote a histogram of data divided into 1 sec bins. Red curve is a Poisson curve with rate = median count rate of data. |
 |
 |
| Quadrant-wise count rates Data is divided into 100 sec bins |
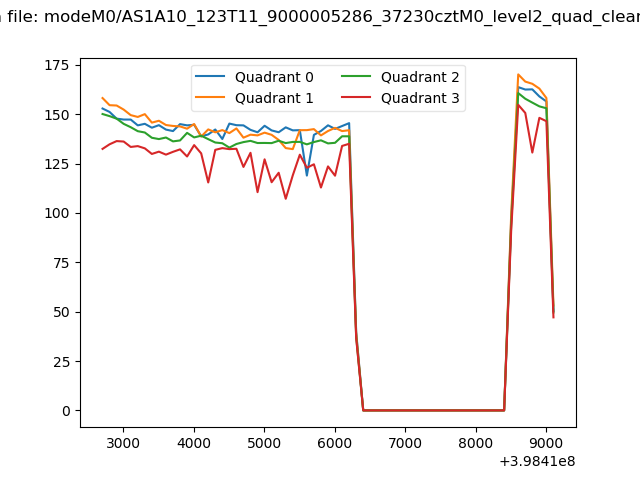 |
|
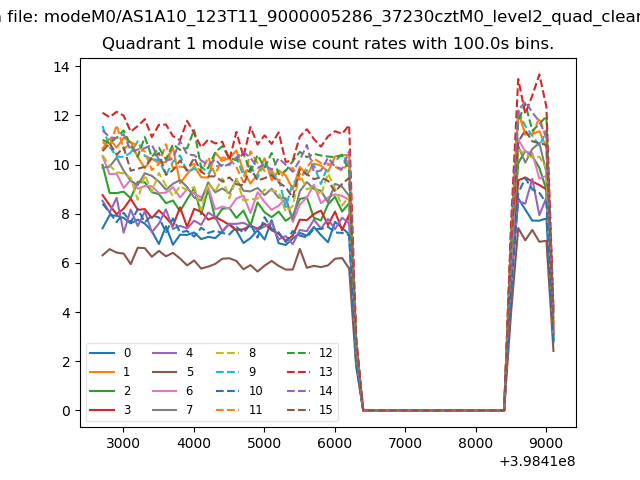
| Module-wise count rates for Quadrant A Data is divided into 100 sec bins |
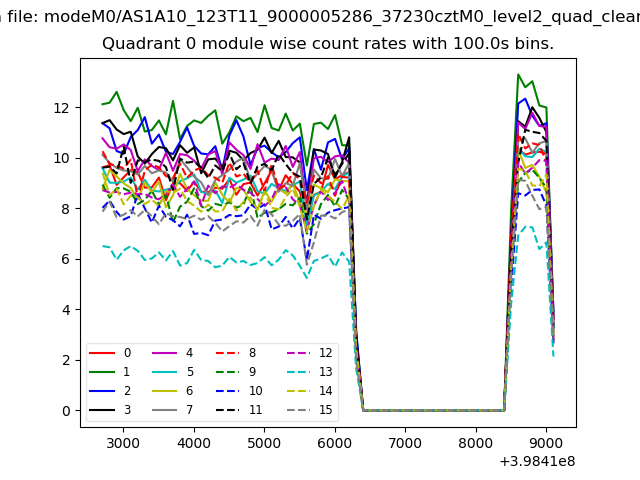 |
 |
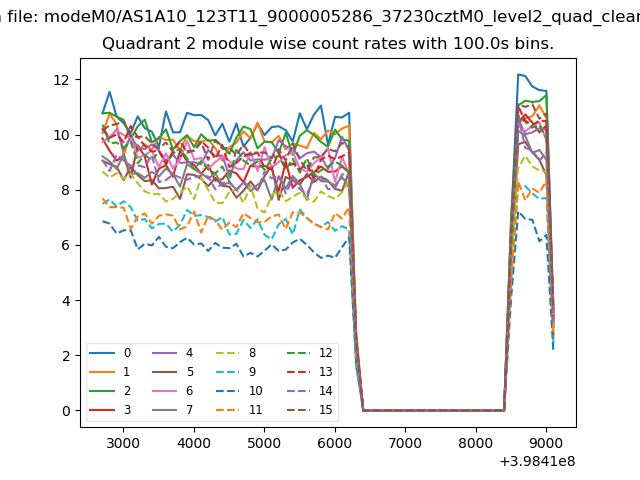
| Module-wise count rates for Quadrant B Data is divided into 100 sec bins |
 |
 |
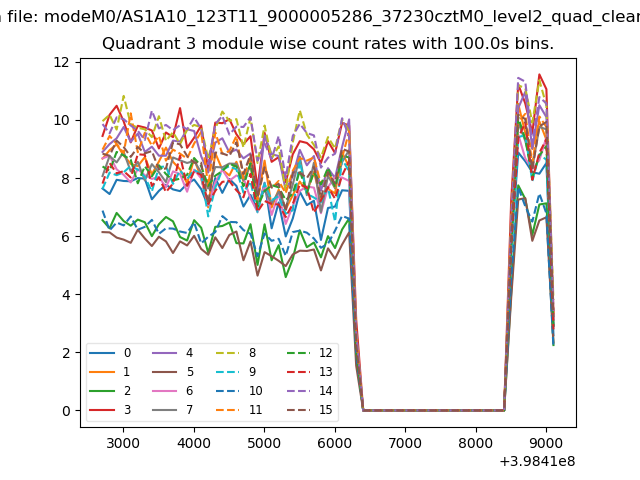
| Module-wise count rates for Quadrant C Data is divided into 100 sec bins |
 |
 |
| Module-wise count rates for Quadrant D Data is divided into 100 sec bins |
 |
 |
| Parameter | Plot |
|---|---|
| CZT HV Monitor | 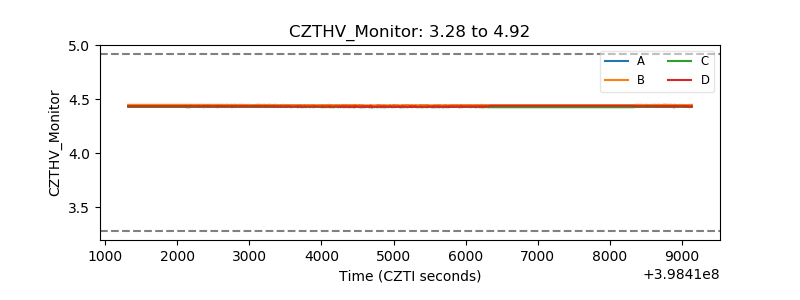 |
| D_VDD | 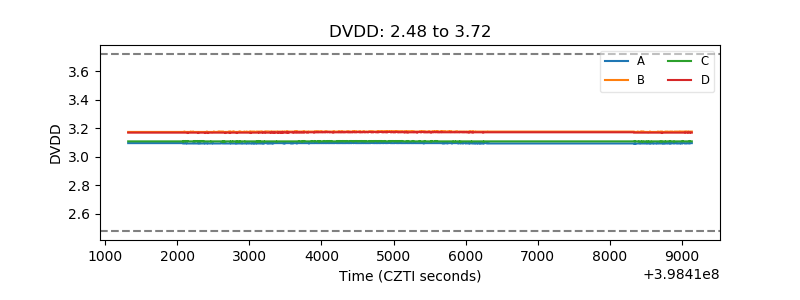 |
| Temperature 1 | 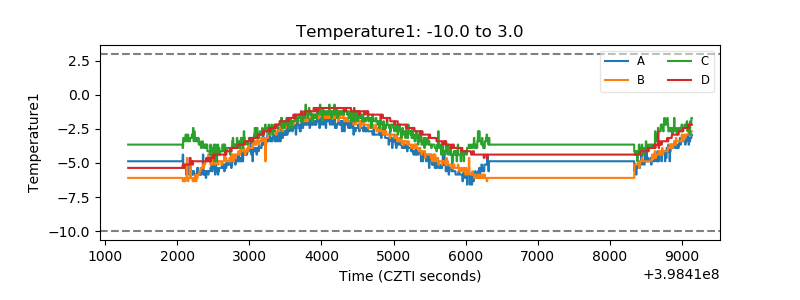 |
| Veto HV Monitor | 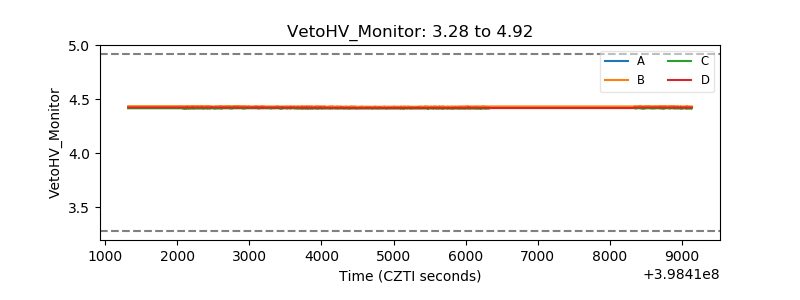 |
| Veto LLD | 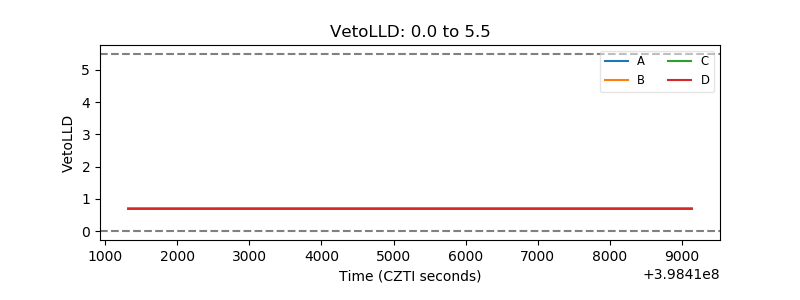 |
| Alpha Counter | 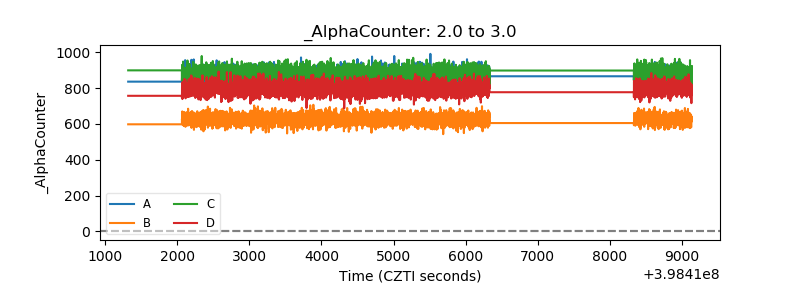 |
| _CPM_Rate | 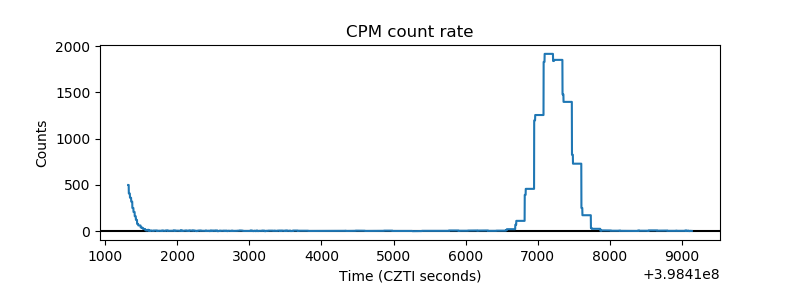 |
| CZT Counter | 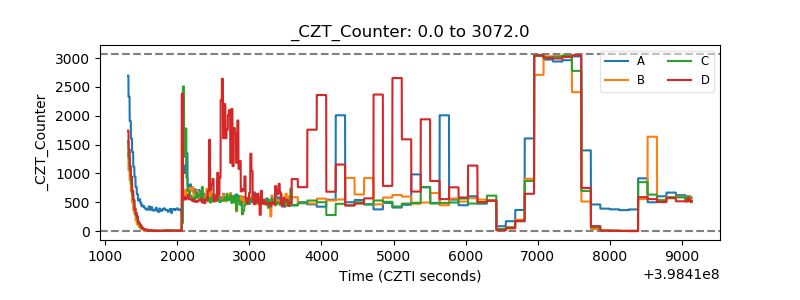 |
| +2.5 Volts monitor | 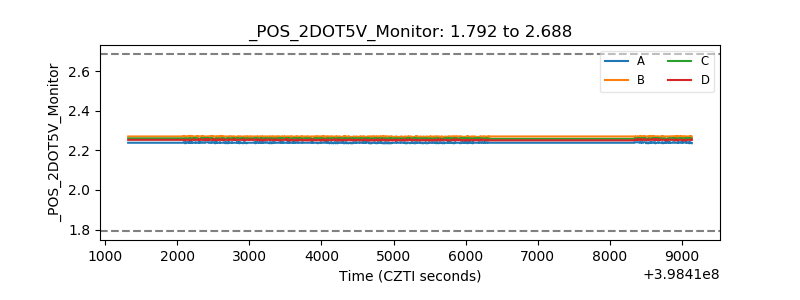 |
| +5 Volts monitor | 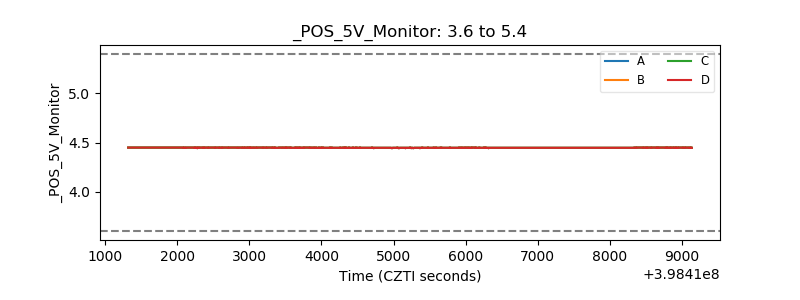 |
| _ROLL_ROT | 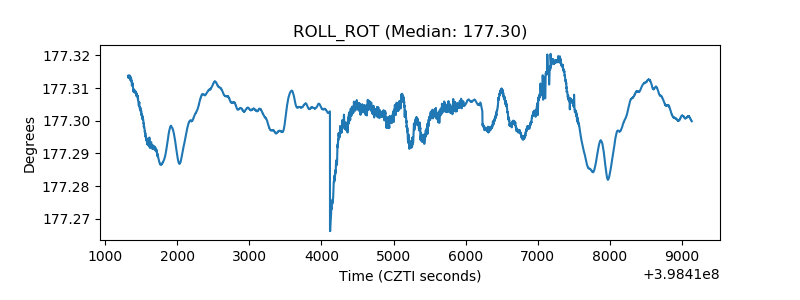 |
| _Roll_DEC |  |
| _Roll_RA | 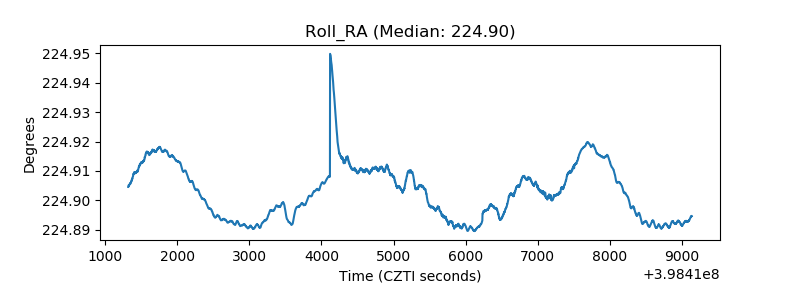 |
| Veto Counter | 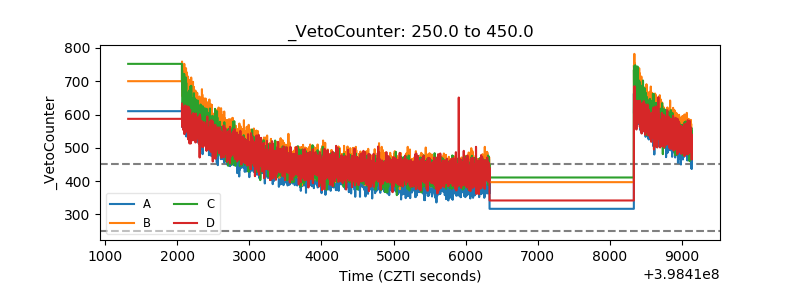 |