| Param | Original file | Final file |
|---|---|---|
| Filename | modeM0/AS1A10_123T11_9000005286_37231cztM0_level2.evt | modeM0/AS1A10_123T11_9000005286_37231cztM0_level2_quad_clean.evt |
| Size (bytes) | 420,900,480 | 98,130,240 |
| Size | 401.4 MB | 93.6 MB |
| Events in quadrant A | 3,259,803 | 672,246 |
| Events in quadrant B | 2,860,285 | 683,094 |
| Events in quadrant C | 2,775,790 | 647,680 |
| Events in quadrant D | 3,513,589 | 620,296 |
| Mode M0 | |||
|---|---|---|---|
| Quadrant | BADHDUFLAG | Total packets | Discarded packets |
| A | 0 | 12723 | 3 |
| B | 0 | 11467 | 2 |
| C | 0 | 10938 | 2 |
| D | 0 | 13570 | 2 |
| Mode M9 | |||
|---|---|---|---|
| Quadrant | BADHDUFLAG | Total packets | Discarded packets |
| A | 0 | 30 | 0 |
| B | 0 | 30 | 0 |
| C | 0 | 30 | 0 |
| D | 0 | 31 | 0 |
| Mode SS | |||
|---|---|---|---|
| Quadrant | BADHDUFLAG | Total packets | Discarded packets |
| A | 0 | 100 | 0 |
| B | 0 | 100 | 0 |
| C | 0 | 100 | 0 |
| D | 0 | 100 | 0 |
| Quadrant | Total seconds | Saturated seconds | Saturation percentage |
|---|---|---|---|
| A | 4976 | 133 | 2.672830% |
| B | 4976 | 26 | 0.522508% |
| C | 4976 | 63 | 1.266077% |
| D | 4976 | 154 | 3.094855% |
Noise dominated data is calculated using 1-second bins in cleaned event files. If a bin has >2000 counts, and if more than 50% of those come from <1% of pixels, then it is considered to be noise-dominated and hence unusable.
| Quadrant | # 1 sec bins | Bins with >0 counts | Bins with >2000 counts | High rate bins dominated by noise | Noise dominated (total time) | Noise dominated (detector-on time) | Marked lightcurve |
|---|---|---|---|---|---|---|---|
| A | 7068 | 4977 | 109 | 109 | 1.54% | 2.19% | 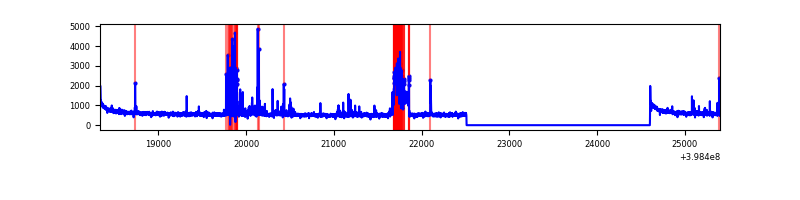 |
| B | 7068 | 4977 | 11 | 11 | 0.16% | 0.22% | 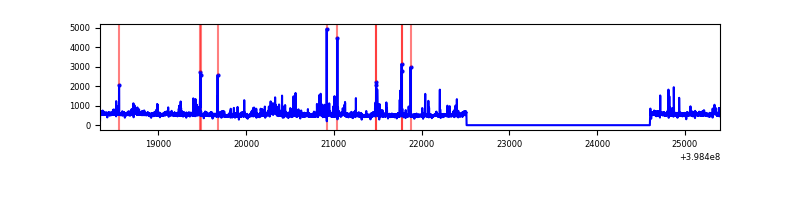 |
| C | 7068 | 4977 | 53 | 53 | 0.75% | 1.06% | 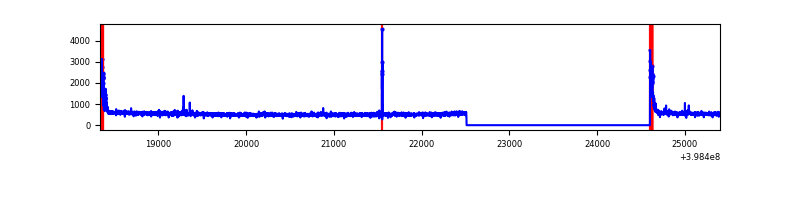 |
| D | 7068 | 4977 | 138 | 138 | 1.95% | 2.77% | 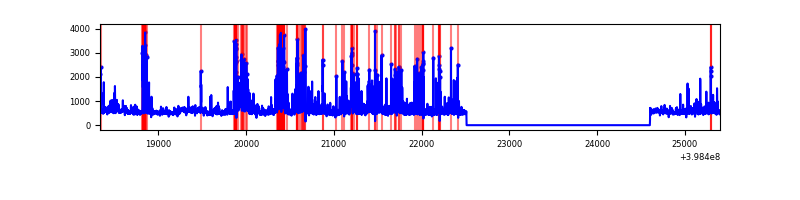 |
Top three noisy pixels from each quadrant. If the there are fewer than three noisy pixels in the level2.evt file, extra rows are filled as -1
| Pixel properties | Quadrant properties | ||||||
|---|---|---|---|---|---|---|---|
| Quadrant | DetID | PixID | Counts | Sigma | Mean | Median | Sigma |
| A | 15 | 237 | 411405 | 3196.13 | 641 | 631 | 128.5 |
| A | 10 | 83 | 265060 | 2057.45 | 641 | 631 | 128.5 |
| A | 13 | 248 | 44567 | 341.85 | 641 | 631 | 128.5 |
| B | 0 | 213 | 120685 | 1015.29 | 631 | 618 | 118.3 |
| B | 5 | 172 | 83613 | 701.81 | 631 | 618 | 118.3 |
| B | 0 | 155 | 50850 | 424.76 | 631 | 618 | 118.3 |
| C | 15 | 214 | 213705 | 1530.45 | 604 | 610 | 139.2 |
| C | 0 | 10 | 166365 | 1190.45 | 604 | 610 | 139.2 |
| C | 1 | 23 | 15659 | 108.08 | 604 | 610 | 139.2 |
| D | 2 | 249 | 391203 | 2614.2 | 615 | 601 | 149.4 |
| D | 13 | 171 | 140010 | 933.03 | 615 | 601 | 149.4 |
| D | 2 | 153 | 106111 | 706.15 | 615 | 601 | 149.4 |
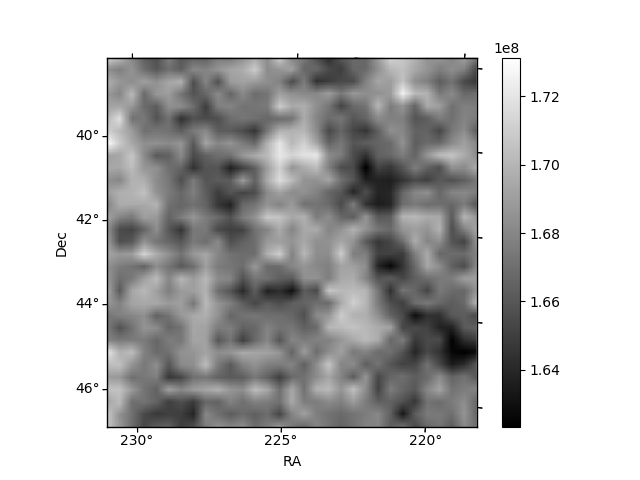
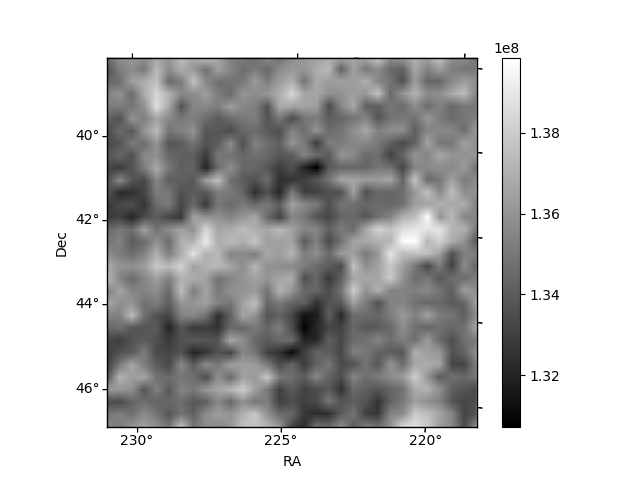
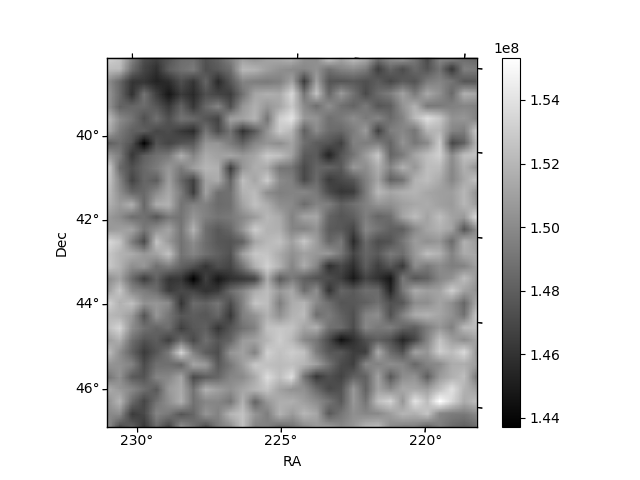
Histogram calculated using DETX and DETY for each event in the final _common_clean file
| Quadrant A | 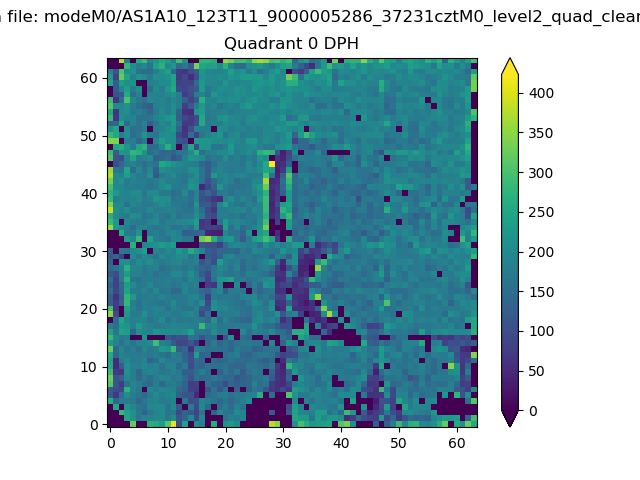 |
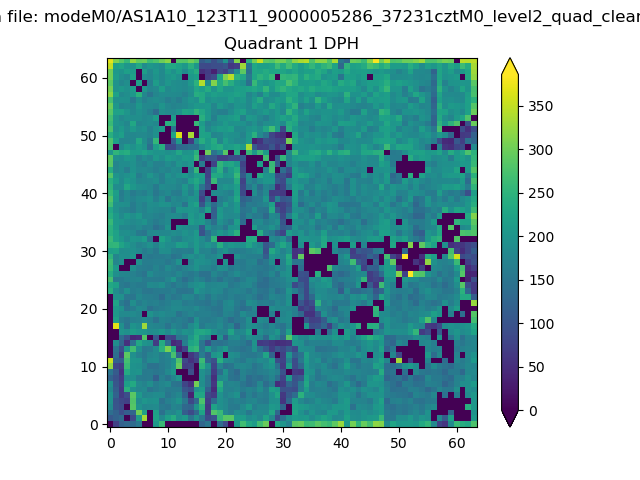 |
Quadrant B |
|---|---|---|---|
| Quadrant D | 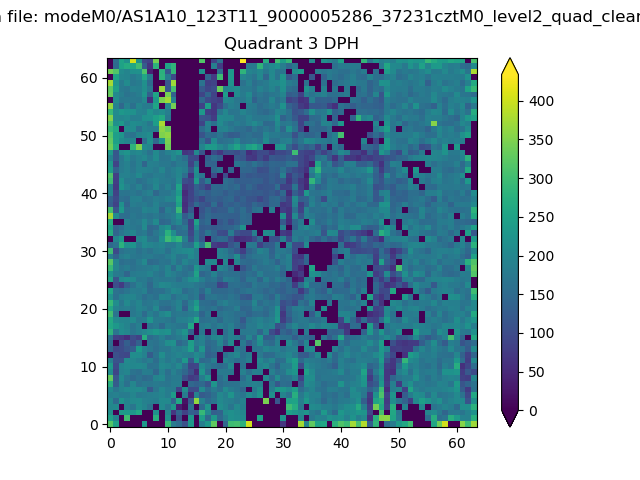 |
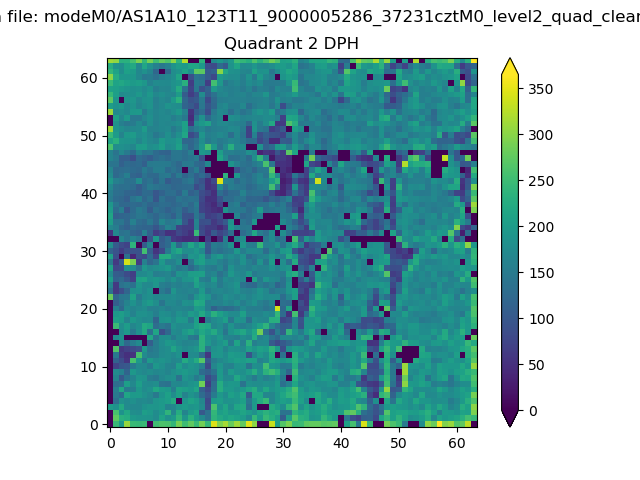 |
Quadrant C |
| Plot type | Count rate plots | Images |
|---|---|---|
| Comparison with Poisson distribution Blue bars denote a histogram of data divided into 1 sec bins. Red curve is a Poisson curve with rate = median count rate of data. |
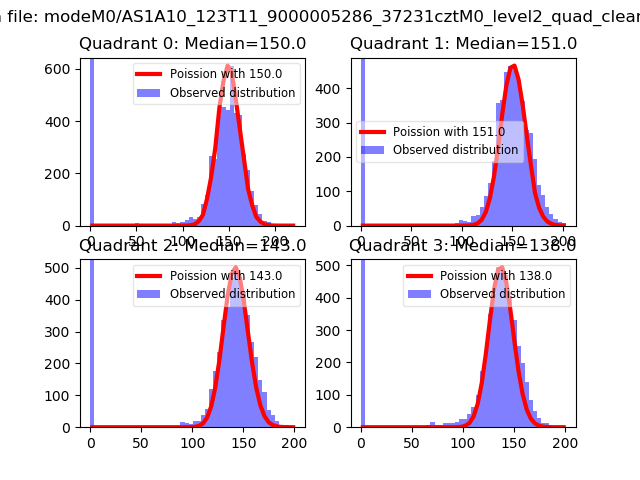 |
 |
| Quadrant-wise count rates Data is divided into 100 sec bins |
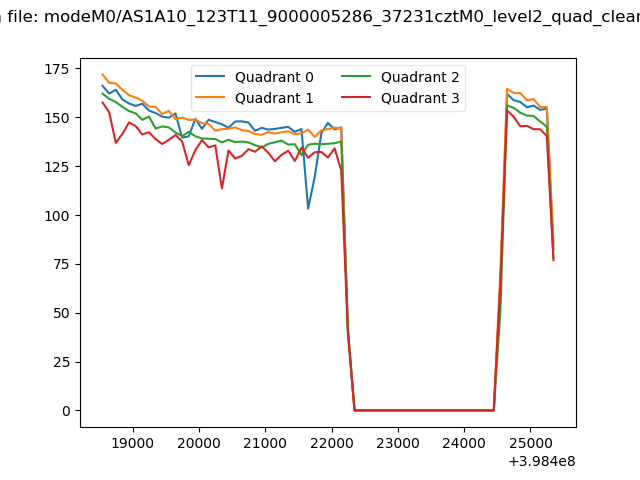 |
|
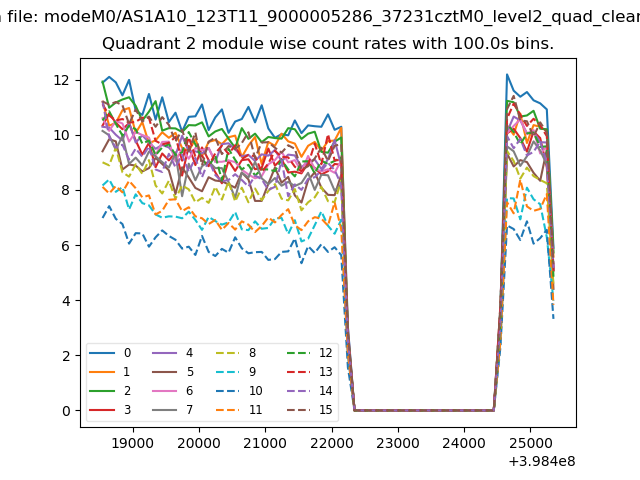
| Module-wise count rates for Quadrant A Data is divided into 100 sec bins |
 |
 |
| Module-wise count rates for Quadrant B Data is divided into 100 sec bins |
 |
 |
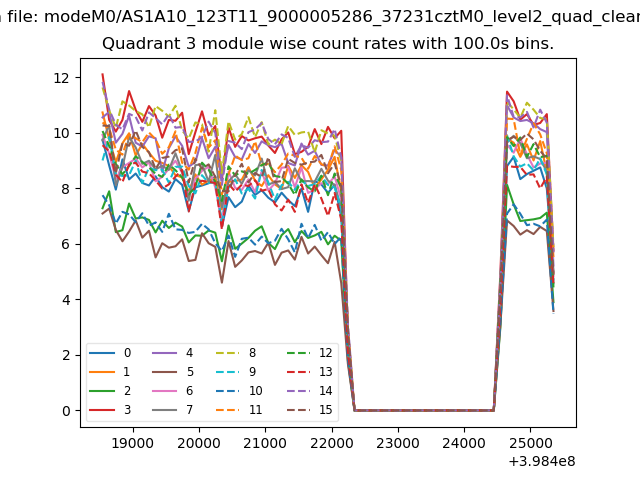
| Module-wise count rates for Quadrant C Data is divided into 100 sec bins |
 |
 |
| Module-wise count rates for Quadrant D Data is divided into 100 sec bins |
 |
 |
| Parameter | Plot |
|---|---|
| CZT HV Monitor | 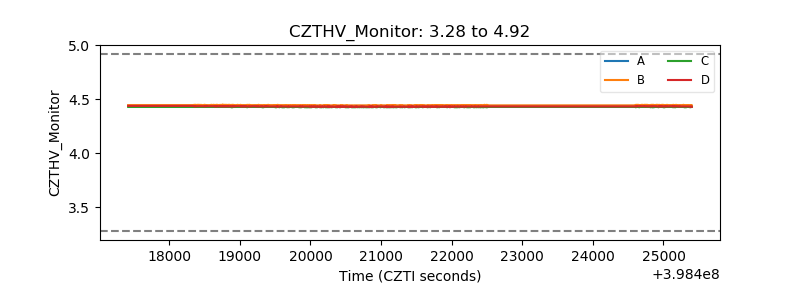 |
| D_VDD | 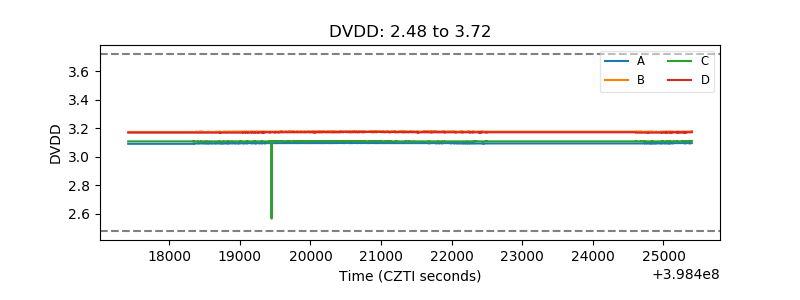 |
| Temperature 1 | 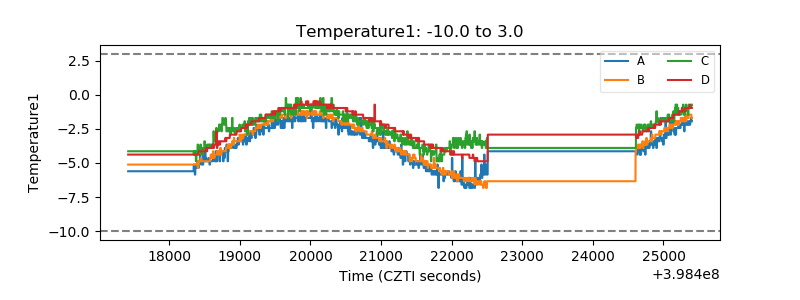 |
| Veto HV Monitor |  |
| Veto LLD | 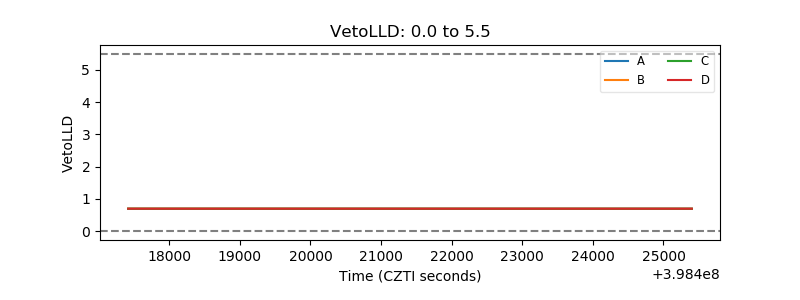 |
| Alpha Counter | 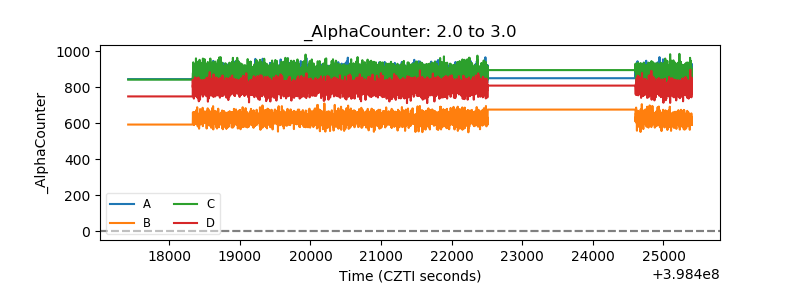 |
| _CPM_Rate | 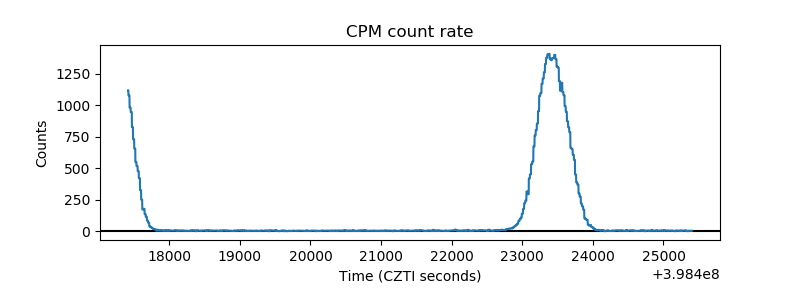 |
| CZT Counter | 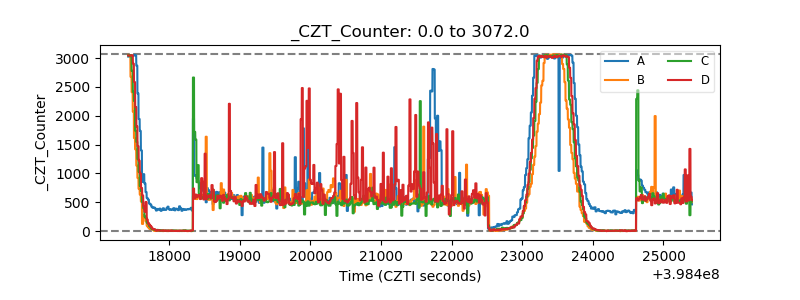 |
| +2.5 Volts monitor | 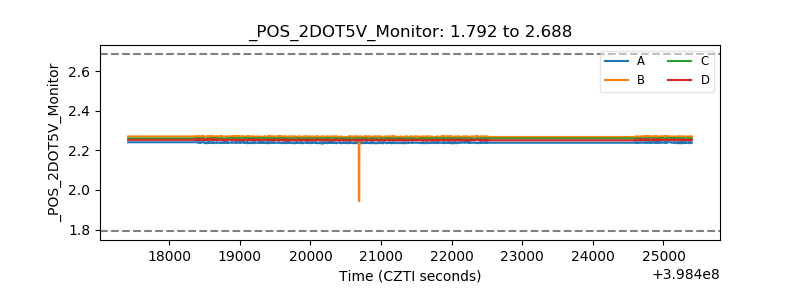 |
| +5 Volts monitor | 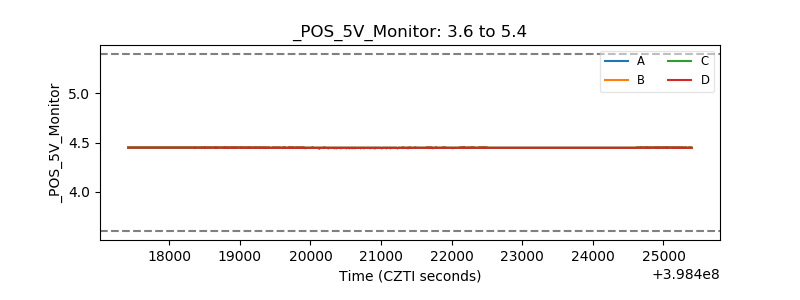 |
| _ROLL_ROT | 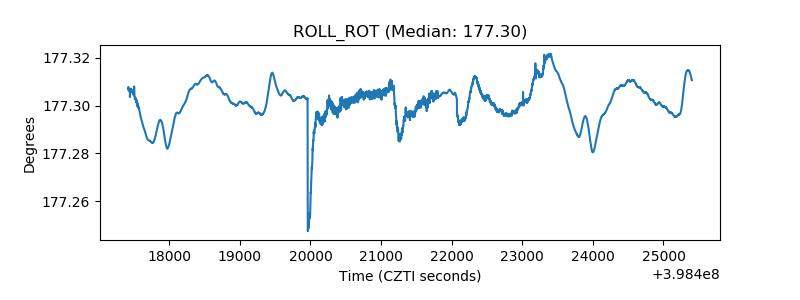 |
| _Roll_DEC | 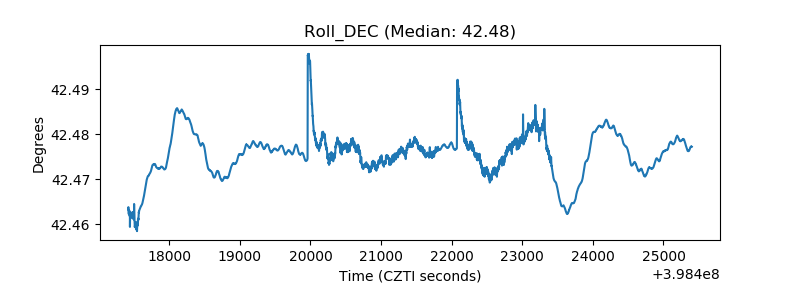 |
| _Roll_RA | 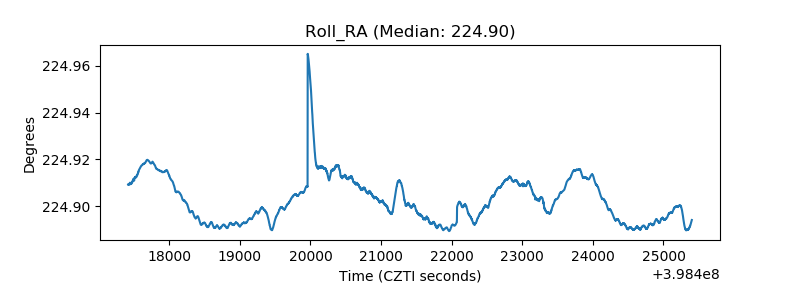 |
| Veto Counter | 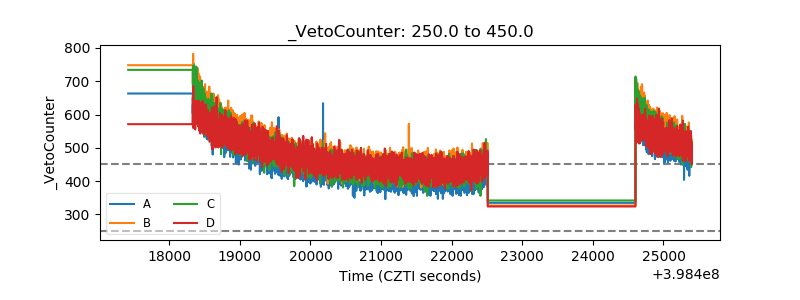 |