| Param | Original file | Final file |
|---|---|---|
| Filename | modeM0/AS1A10_123T11_9000005286_37232cztM0_level2.evt | modeM0/AS1A10_123T11_9000005286_37232cztM0_level2_quad_clean.evt |
| Size (bytes) | 430,983,360 | 91,376,640 |
| Size | 411.0 MB | 87.1 MB |
| Events in quadrant A | 3,023,190 | 627,110 |
| Events in quadrant B | 3,019,279 | 624,939 |
| Events in quadrant C | 2,809,189 | 597,128 |
| Events in quadrant D | 3,864,886 | 571,012 |
| Mode M0 | |||
|---|---|---|---|
| Quadrant | BADHDUFLAG | Total packets | Discarded packets |
| A | 0 | 12073 | 3 |
| B | 0 | 12064 | 2 |
| C | 0 | 11086 | 2 |
| D | 0 | 14683 | 2 |
| Mode M9 | |||
|---|---|---|---|
| Quadrant | BADHDUFLAG | Total packets | Discarded packets |
| A | 0 | 24 | 0 |
| B | 0 | 24 | 0 |
| C | 0 | 24 | 0 |
| D | 0 | 25 | 0 |
| Mode SS | |||
|---|---|---|---|
| Quadrant | BADHDUFLAG | Total packets | Discarded packets |
| A | 0 | 102 | 0 |
| B | 0 | 102 | 0 |
| C | 0 | 102 | 0 |
| D | 0 | 102 | 0 |
| Quadrant | Total seconds | Saturated seconds | Saturation percentage |
|---|---|---|---|
| A | 4946 | 66 | 1.334412% |
| B | 4946 | 28 | 0.566114% |
| C | 4946 | 70 | 1.415285% |
| D | 4946 | 237 | 4.791751% |
Noise dominated data is calculated using 1-second bins in cleaned event files. If a bin has >2000 counts, and if more than 50% of those come from <1% of pixels, then it is considered to be noise-dominated and hence unusable.
| Quadrant | # 1 sec bins | Bins with >0 counts | Bins with >2000 counts | High rate bins dominated by noise | Noise dominated (total time) | Noise dominated (detector-on time) | Marked lightcurve |
|---|---|---|---|---|---|---|---|
| A | 7067 | 4947 | 34 | 34 | 0.48% | 0.69% | 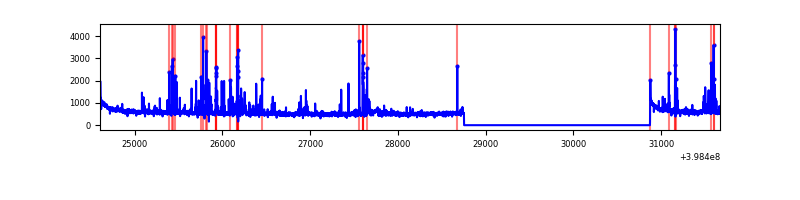 |
| B | 7067 | 4947 | 14 | 14 | 0.20% | 0.28% | 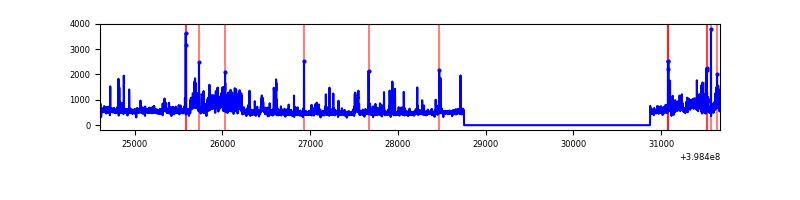 |
| C | 7067 | 4947 | 59 | 59 | 0.83% | 1.19% | 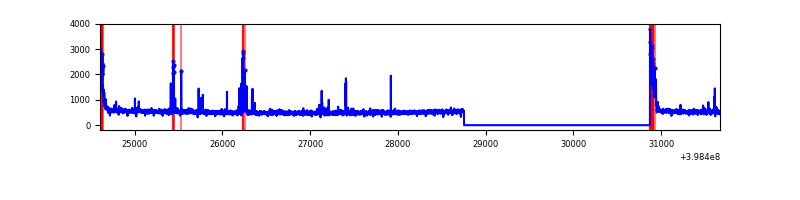 |
| D | 7067 | 4947 | 214 | 214 | 3.03% | 4.33% | 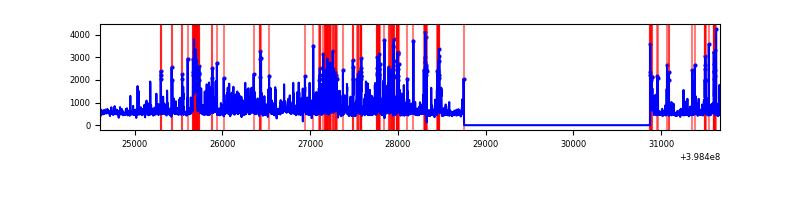 |
Top three noisy pixels from each quadrant. If the there are fewer than three noisy pixels in the level2.evt file, extra rows are filled as -1
| Pixel properties | Quadrant properties | ||||||
|---|---|---|---|---|---|---|---|
| Quadrant | DetID | PixID | Counts | Sigma | Mean | Median | Sigma |
| A | 10 | 83 | 269043 | 2166.08 | 619 | 608 | 123.9 |
| A | 9 | 143 | 139953 | 1124.42 | 619 | 608 | 123.9 |
| A | 15 | 237 | 95499 | 765.7 | 619 | 608 | 123.9 |
| B | 0 | 190 | 182958 | 1601.54 | 606 | 591 | 113.9 |
| B | 0 | 213 | 108362 | 946.44 | 606 | 591 | 113.9 |
| B | 4 | 232 | 104572 | 913.16 | 606 | 591 | 113.9 |
| C | 15 | 214 | 210950 | 1564.72 | 584 | 591 | 134.4 |
| C | 0 | 10 | 181612 | 1346.5 | 584 | 591 | 134.4 |
| C | 14 | 254 | 65554 | 483.22 | 584 | 591 | 134.4 |
| D | 12 | 233 | 334718 | 2327.9 | 591 | 577 | 143.5 |
| D | 2 | 249 | 308710 | 2146.71 | 591 | 577 | 143.5 |
| D | 13 | 171 | 201125 | 1397.18 | 591 | 577 | 143.5 |
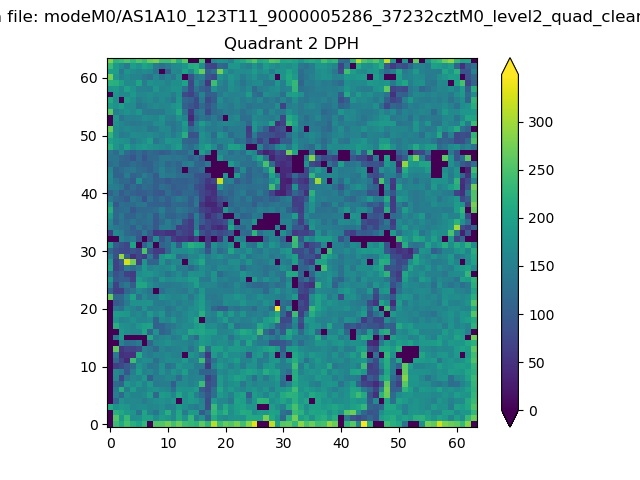
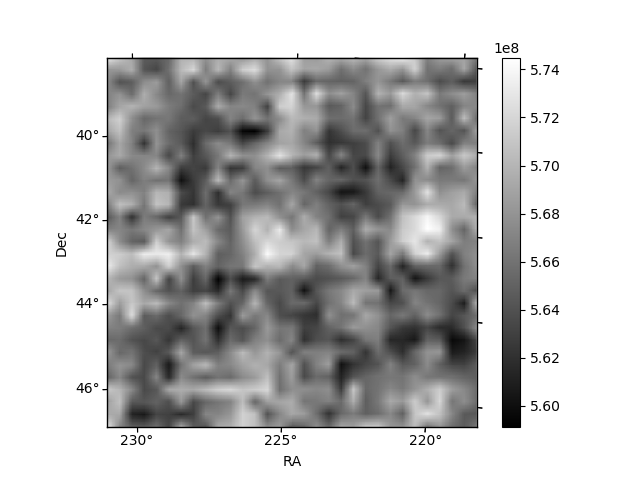
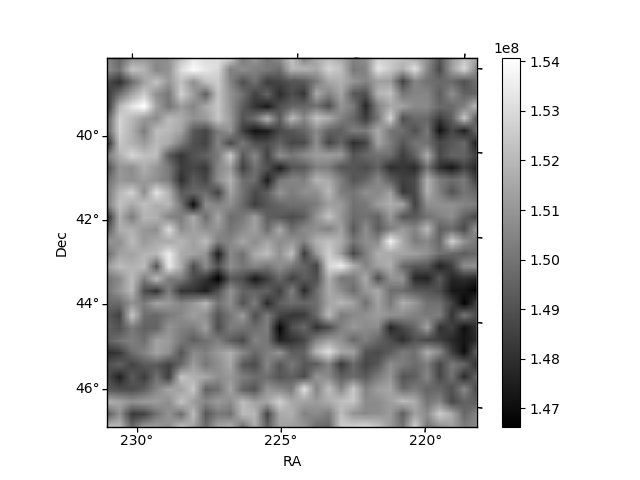
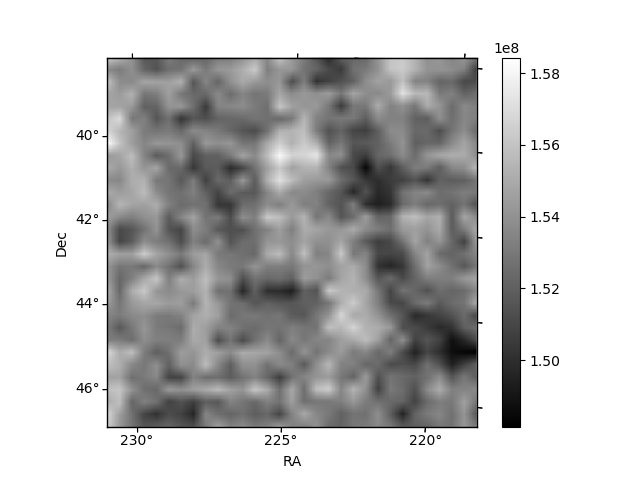
Histogram calculated using DETX and DETY for each event in the final _common_clean file
| Quadrant A | 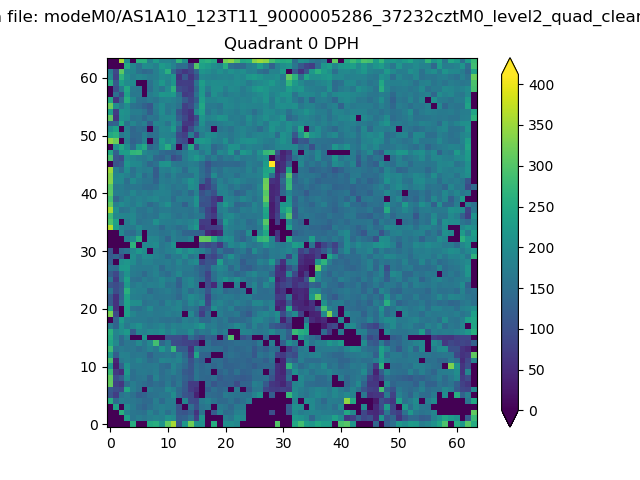 |
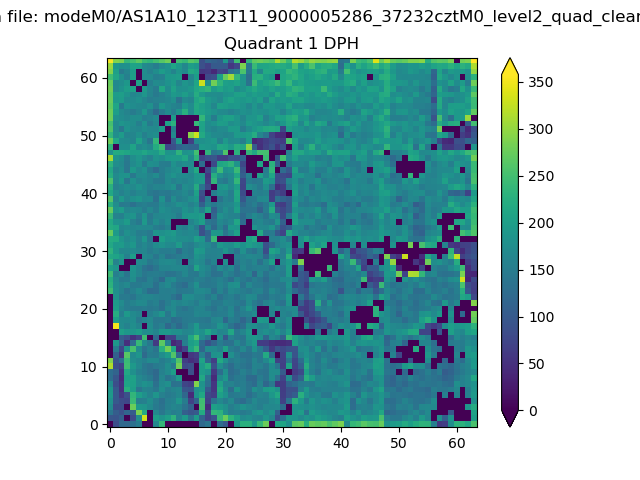 |
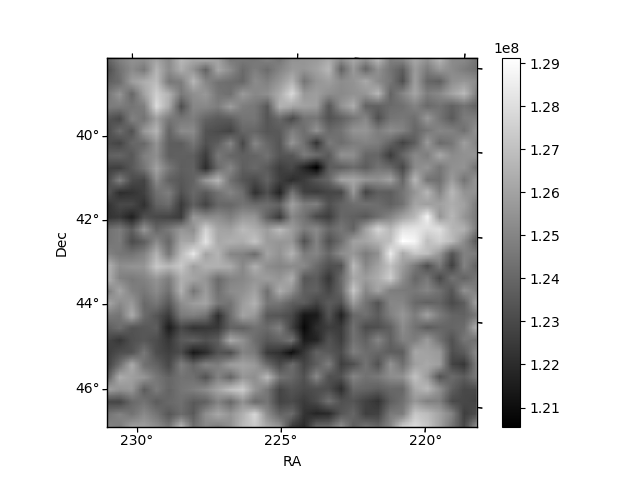
Quadrant B |
|---|---|---|---|
| Quadrant D | 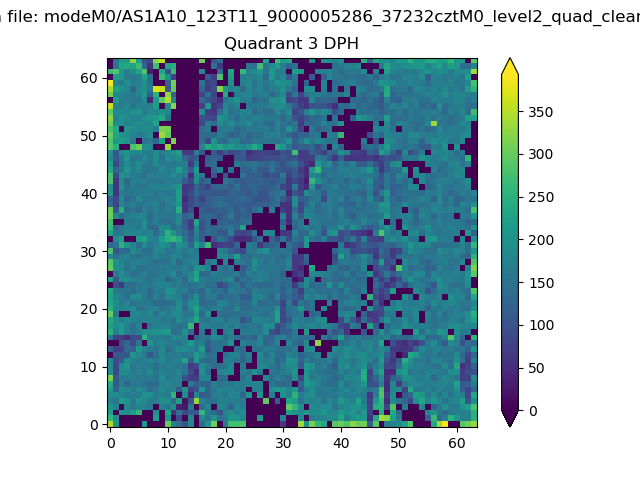 |
 |
Quadrant C |
| Plot type | Count rate plots | Images |
|---|---|---|
| Comparison with Poisson distribution Blue bars denote a histogram of data divided into 1 sec bins. Red curve is a Poisson curve with rate = median count rate of data. |
 |
 |
| Quadrant-wise count rates Data is divided into 100 sec bins |
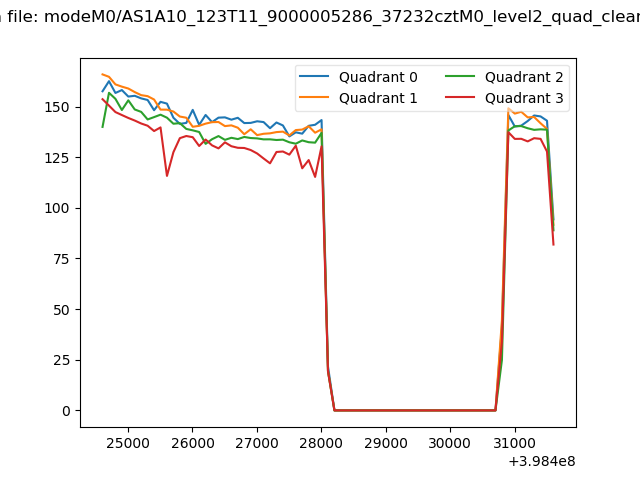 |
|
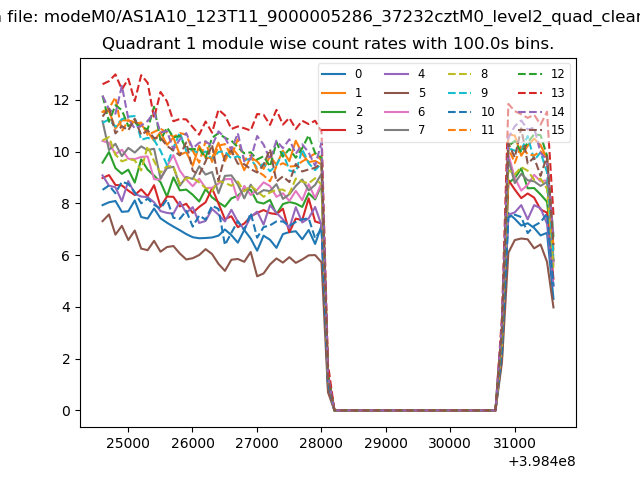
| Module-wise count rates for Quadrant A Data is divided into 100 sec bins |
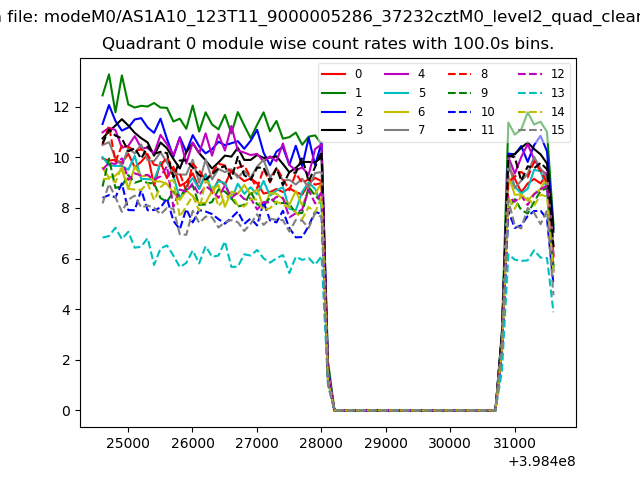 |
 |
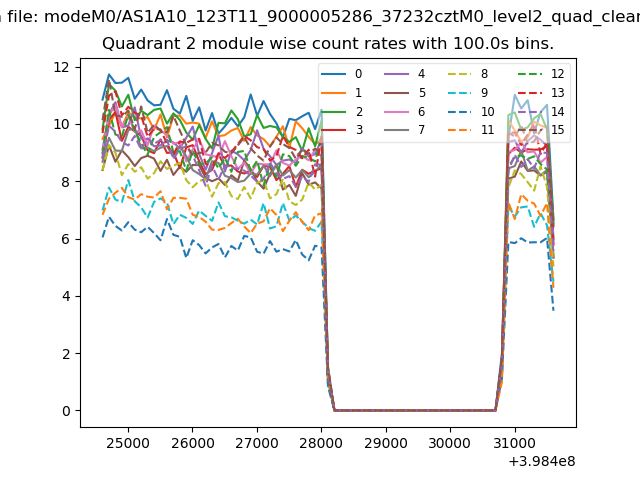
| Module-wise count rates for Quadrant B Data is divided into 100 sec bins |
 |
 |
| Module-wise count rates for Quadrant C Data is divided into 100 sec bins |
 |
 |
| Module-wise count rates for Quadrant D Data is divided into 100 sec bins |
 |
 |
| Parameter | Plot |
|---|---|
| CZT HV Monitor | 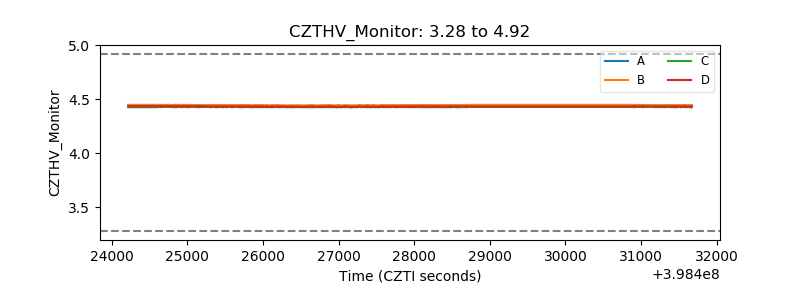 |
| D_VDD | 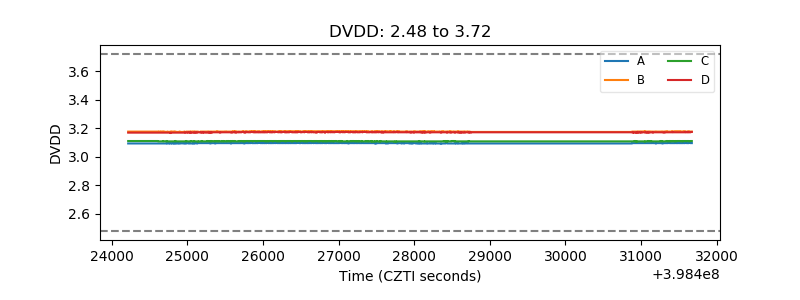 |
| Temperature 1 |  |
| Veto HV Monitor | 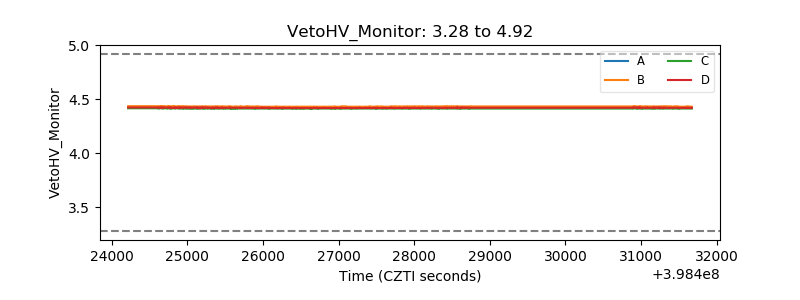 |
| Veto LLD | 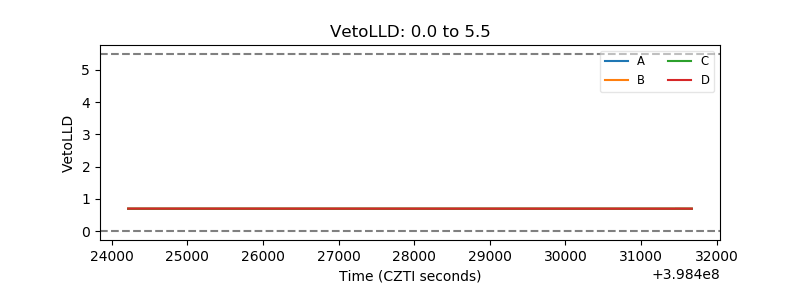 |
| Alpha Counter | 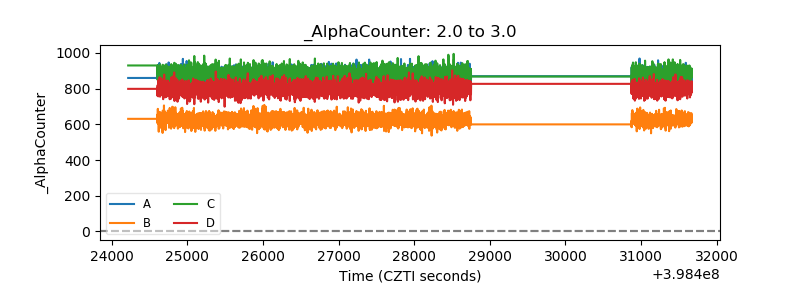 |
| _CPM_Rate | 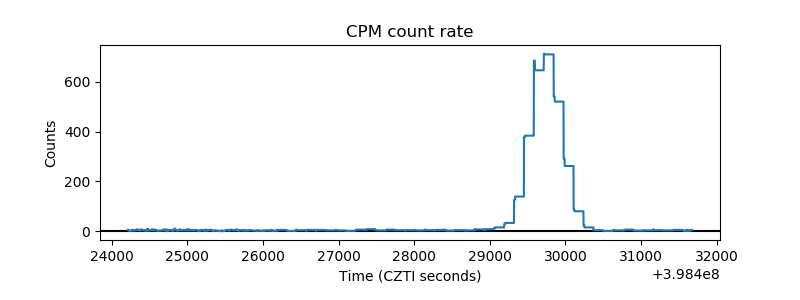 |
| CZT Counter | 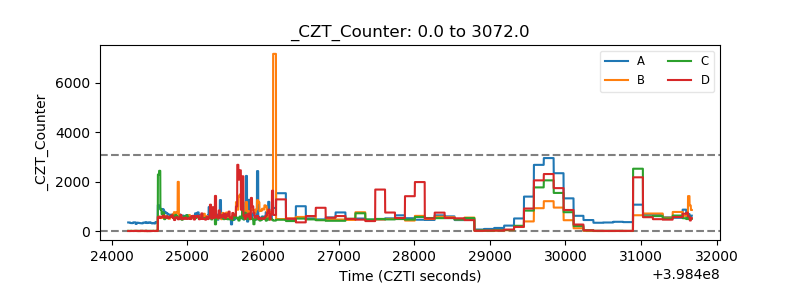 |
| +2.5 Volts monitor | 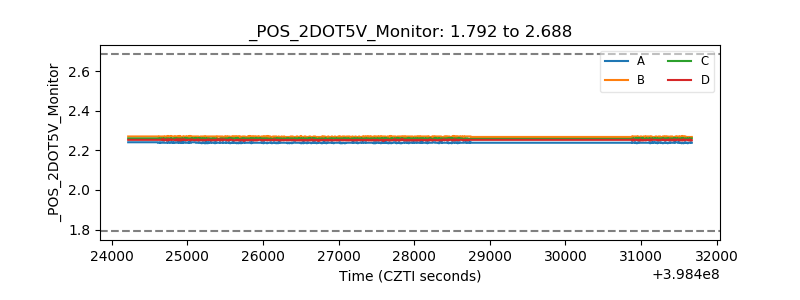 |
| +5 Volts monitor | 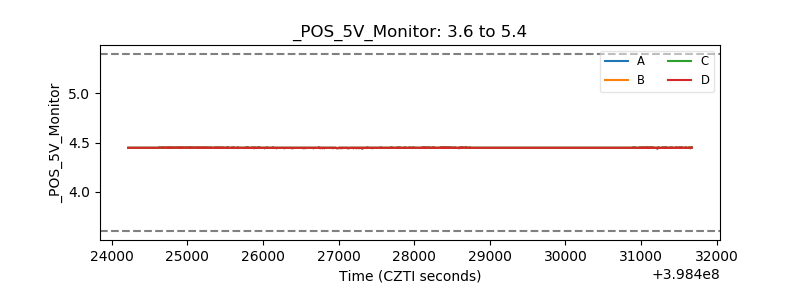 |
| _ROLL_ROT |  |
| _Roll_DEC |  |
| _Roll_RA | 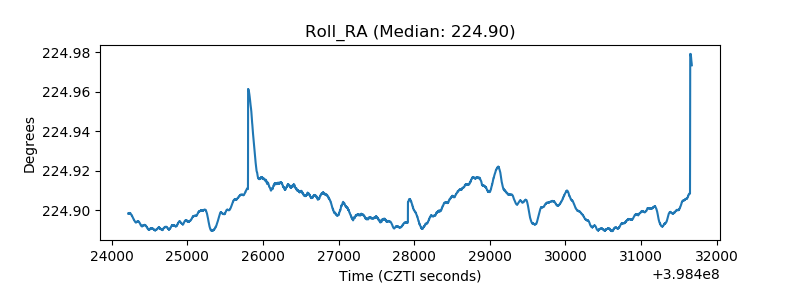 |
| Veto Counter | 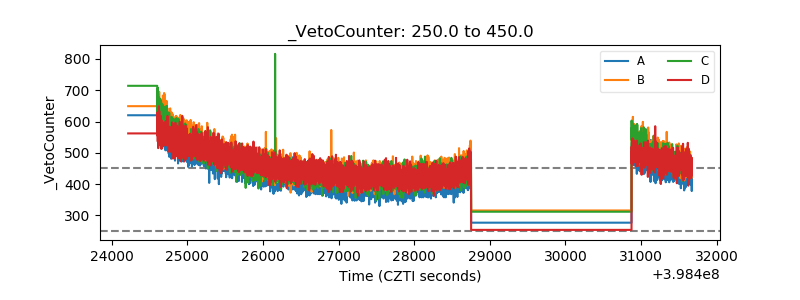 |