| Param | Original file | Final file |
|---|---|---|
| Filename | modeM0/AS1A10_123T11_9000005286_37234cztM0_level2.evt | modeM0/AS1A10_123T11_9000005286_37234cztM0_level2_quad_clean.evt |
| Size (bytes) | 436,893,120 | 69,384,960 |
| Size | 416.7 MB | 66.2 MB |
| Events in quadrant A | 2,787,090 | 451,571 |
| Events in quadrant B | 3,318,465 | 438,271 |
| Events in quadrant C | 3,397,611 | 422,718 |
| Events in quadrant D | 3,371,583 | 420,395 |
| Mode M0 | |||
|---|---|---|---|
| Quadrant | BADHDUFLAG | Total packets | Discarded packets |
| A | 0 | 11531 | 2 |
| B | 0 | 13354 | 1 |
| C | 0 | 13267 | 1 |
| D | 0 | 13418 | 1 |
| Mode M9 | |||
|---|---|---|---|
| Quadrant | BADHDUFLAG | Total packets | Discarded packets |
| A | 0 | 18 | 0 |
| B | 0 | 18 | 0 |
| C | 0 | 18 | 0 |
| D | 0 | 18 | 0 |
| Mode SS | |||
|---|---|---|---|
| Quadrant | BADHDUFLAG | Total packets | Discarded packets |
| A | 0 | 108 | 0 |
| B | 0 | 108 | 0 |
| C | 0 | 108 | 0 |
| D | 0 | 108 | 0 |
| Quadrant | Total seconds | Saturated seconds | Saturation percentage |
|---|---|---|---|
| A | 5249 | 53 | 1.009716% |
| B | 5249 | 132 | 2.514765% |
| C | 5249 | 211 | 4.019813% |
| D | 5249 | 113 | 2.152791% |
Noise dominated data is calculated using 1-second bins in cleaned event files. If a bin has >2000 counts, and if more than 50% of those come from <1% of pixels, then it is considered to be noise-dominated and hence unusable.
| Quadrant | # 1 sec bins | Bins with >0 counts | Bins with >2000 counts | High rate bins dominated by noise | Noise dominated (total time) | Noise dominated (detector-on time) | Marked lightcurve |
|---|---|---|---|---|---|---|---|
| A | 7102 | 5250 | 51 | 51 | 0.72% | 0.97% | 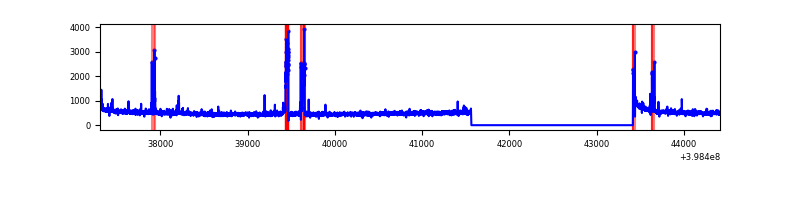 |
| B | 7102 | 5250 | 78 | 78 | 1.10% | 1.49% | 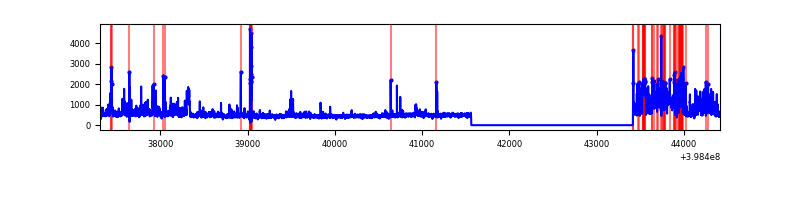 |
| C | 7102 | 5250 | 172 | 172 | 2.42% | 3.28% | 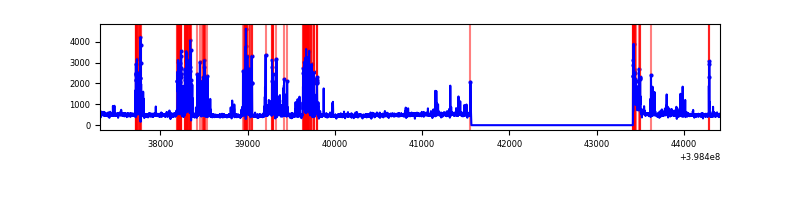 |
| D | 7102 | 5250 | 122 | 122 | 1.72% | 2.32% | 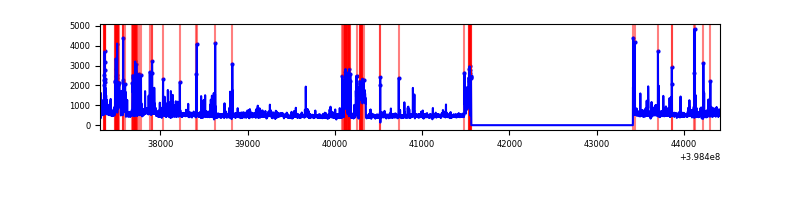 |
Top three noisy pixels from each quadrant. If the there are fewer than three noisy pixels in the level2.evt file, extra rows are filled as -1
| Pixel properties | Quadrant properties | ||||||
|---|---|---|---|---|---|---|---|
| Quadrant | DetID | PixID | Counts | Sigma | Mean | Median | Sigma |
| A | 10 | 83 | 246674 | 2004.26 | 598 | 586 | 122.8 |
| A | 15 | 237 | 145939 | 1183.83 | 598 | 586 | 122.8 |
| A | 13 | 248 | 50884 | 409.65 | 598 | 586 | 122.8 |
| B | 5 | 172 | 326776 | 2912.02 | 590 | 573 | 112.0 |
| B | 4 | 67 | 150375 | 1337.28 | 590 | 573 | 112.0 |
| B | 0 | 190 | 113871 | 1011.41 | 590 | 573 | 112.0 |
| C | 14 | 254 | 832923 | 6208.48 | 574 | 577 | 134.1 |
| C | 15 | 214 | 219808 | 1635.25 | 574 | 577 | 134.1 |
| C | 0 | 10 | 81936 | 606.86 | 574 | 577 | 134.1 |
| D | 12 | 248 | 456226 | 3203.66 | 583 | 567 | 142.2 |
| D | 2 | 249 | 83042 | 579.86 | 583 | 567 | 142.2 |
| D | 2 | 153 | 82716 | 577.57 | 583 | 567 | 142.2 |
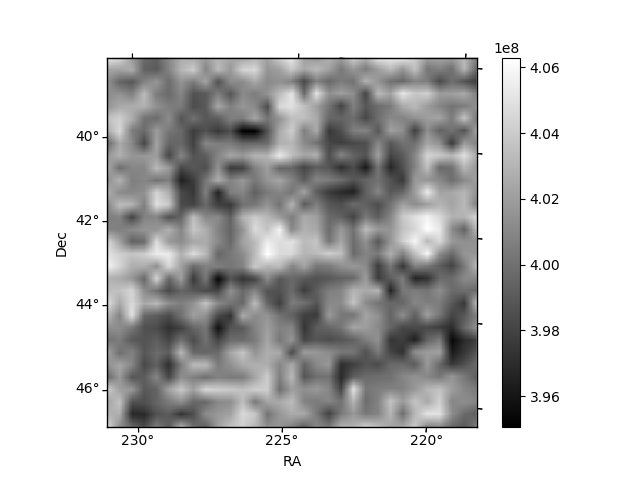
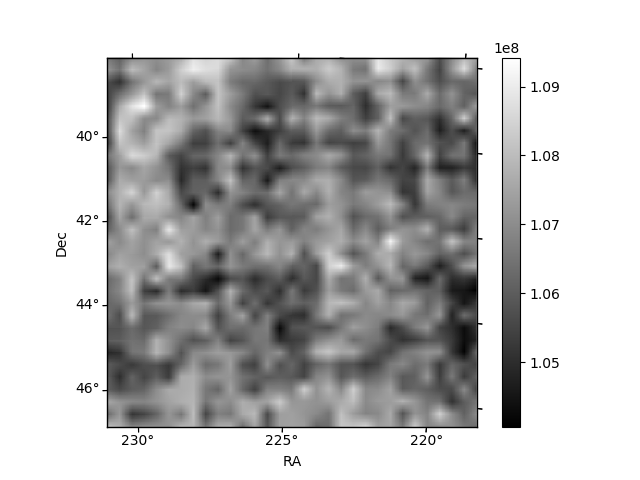
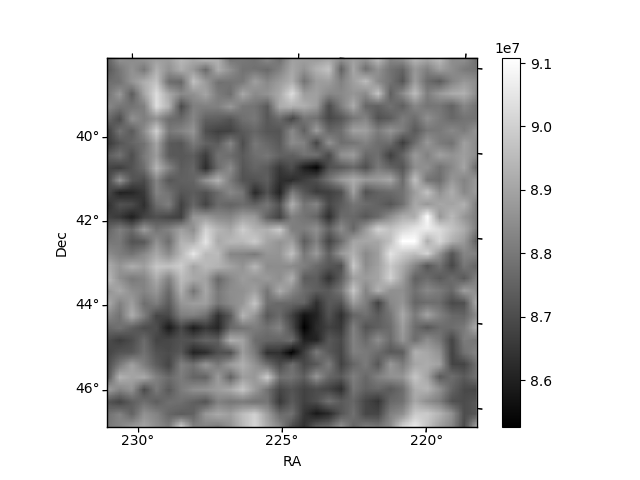
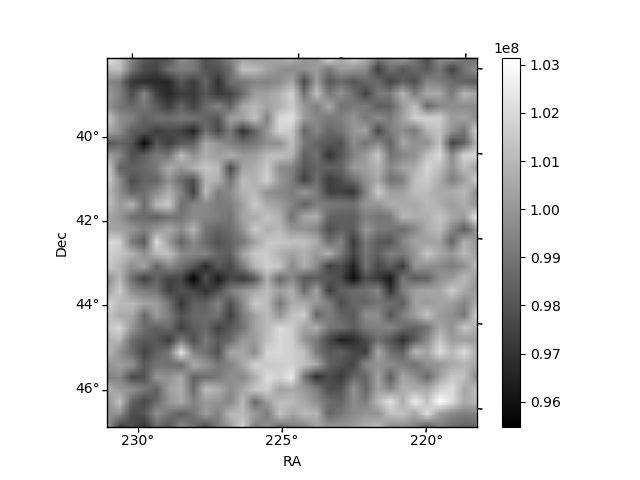
Histogram calculated using DETX and DETY for each event in the final _common_clean file
| Quadrant A | 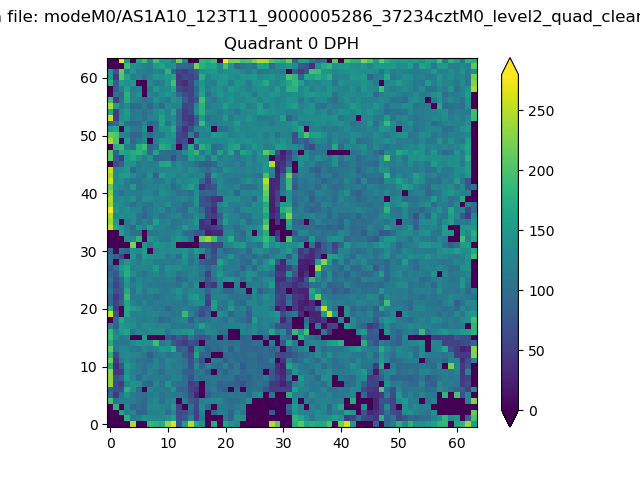 |
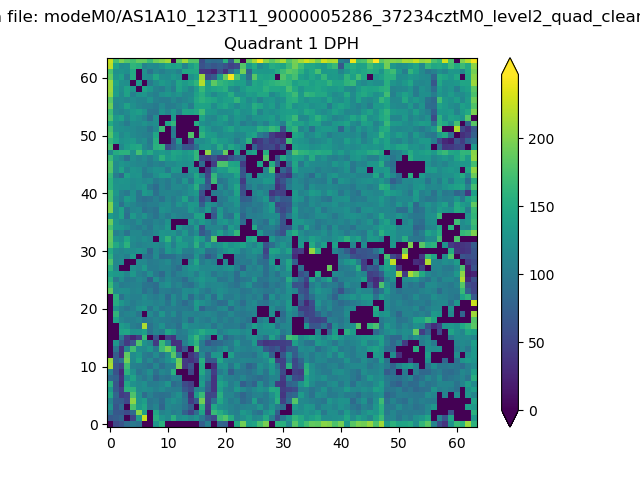 |
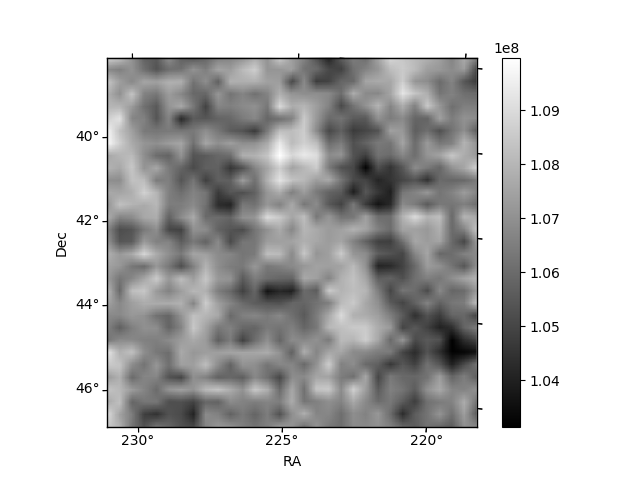
Quadrant B |
|---|---|---|---|
| Quadrant D | 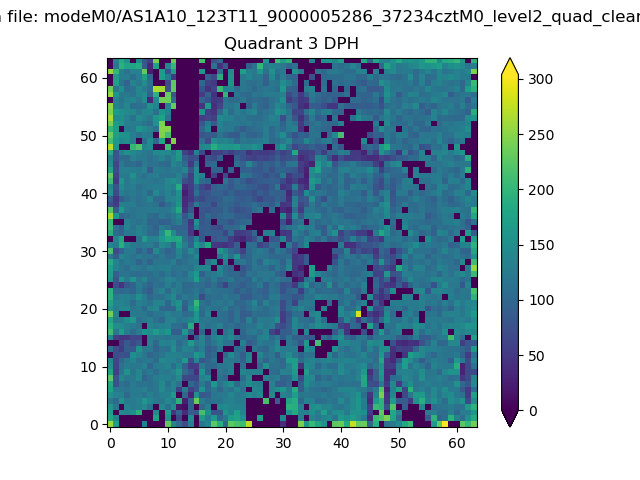 |
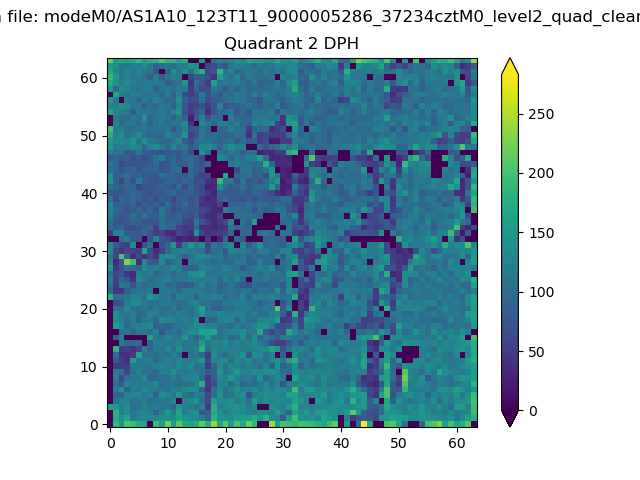 |
Quadrant C |
| Plot type | Count rate plots | Images |
|---|---|---|
| Comparison with Poisson distribution Blue bars denote a histogram of data divided into 1 sec bins. Red curve is a Poisson curve with rate = median count rate of data. |
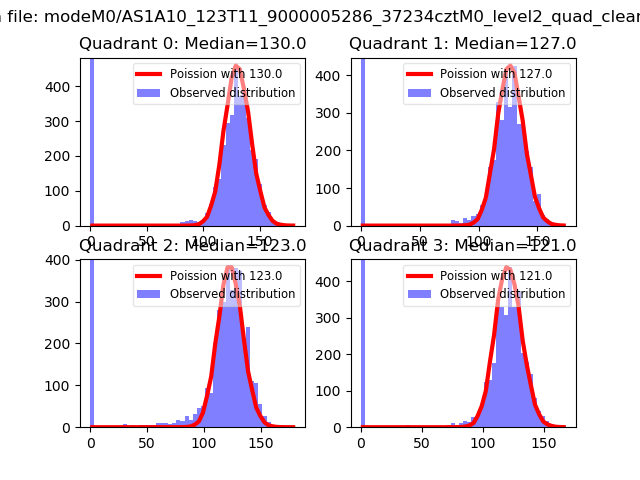 |
 |
| Quadrant-wise count rates Data is divided into 100 sec bins |
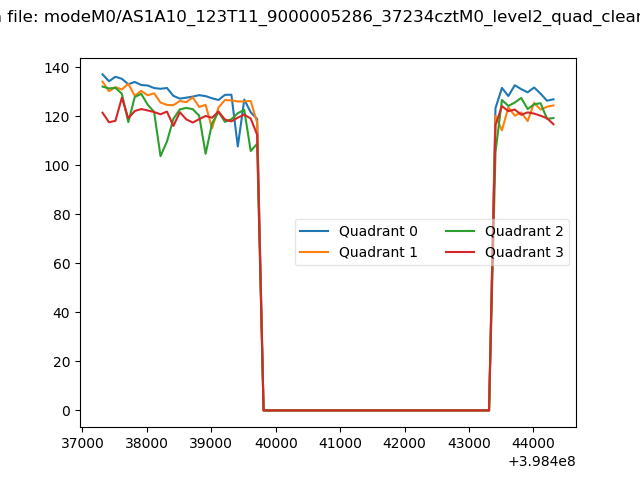 |
|
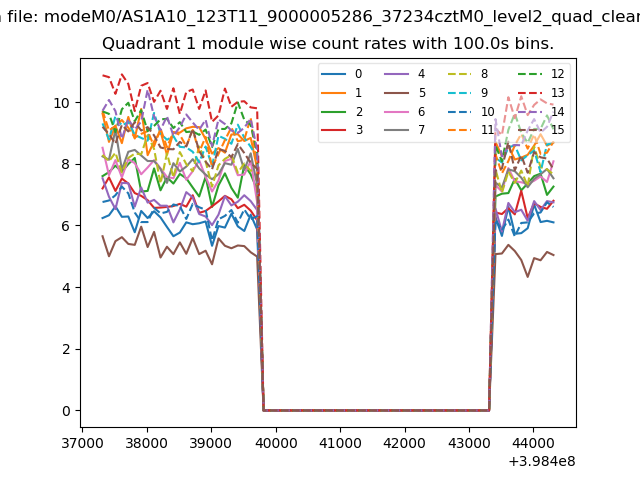
| Module-wise count rates for Quadrant A Data is divided into 100 sec bins |
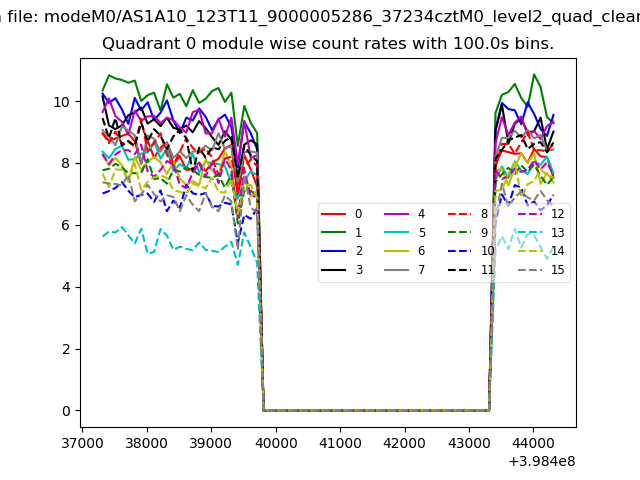 |
 |
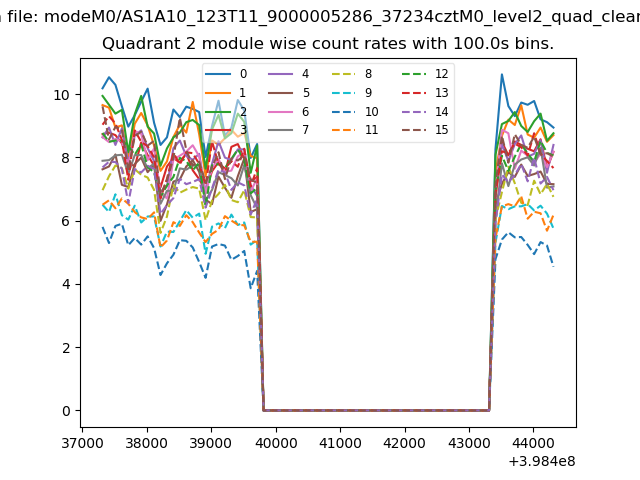
| Module-wise count rates for Quadrant B Data is divided into 100 sec bins |
 |
 |
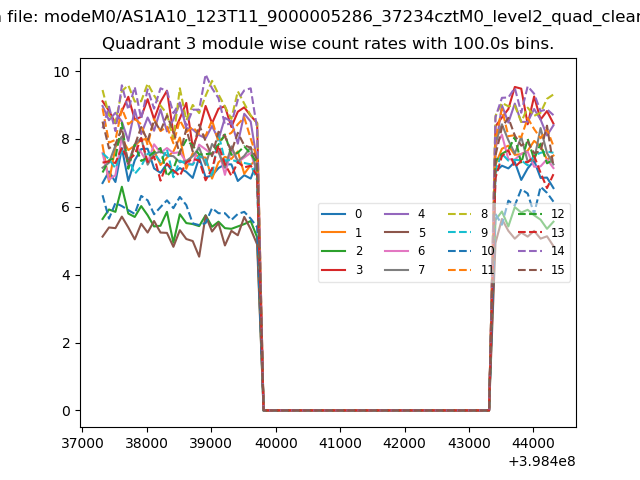
| Module-wise count rates for Quadrant C Data is divided into 100 sec bins |
 |
 |
| Module-wise count rates for Quadrant D Data is divided into 100 sec bins |
 |
 |
| Parameter | Plot |
|---|---|
| CZT HV Monitor |  |
| D_VDD | 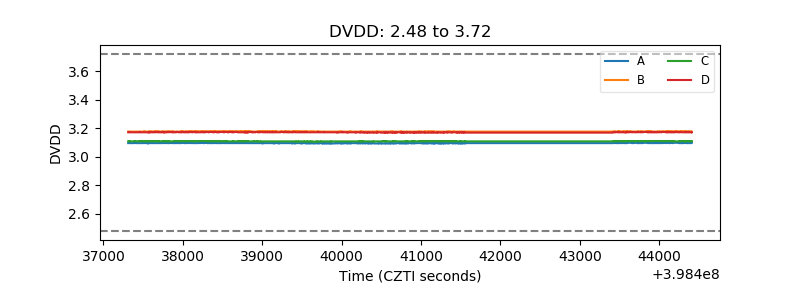 |
| Temperature 1 |  |
| Veto HV Monitor | 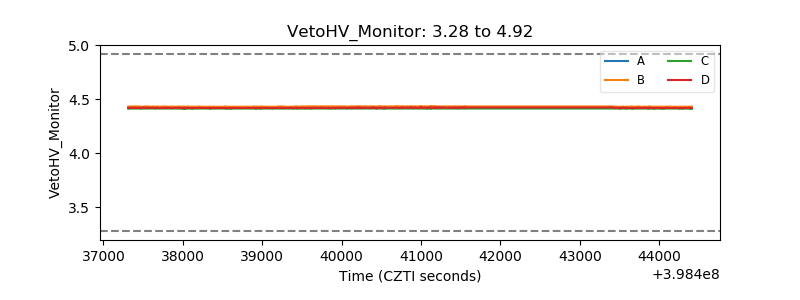 |
| Veto LLD | 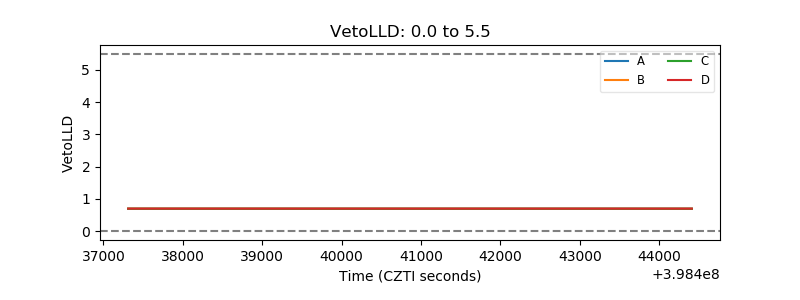 |
| Alpha Counter | 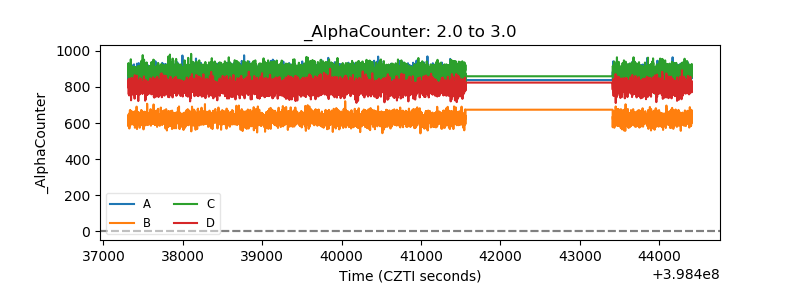 |
| _CPM_Rate | 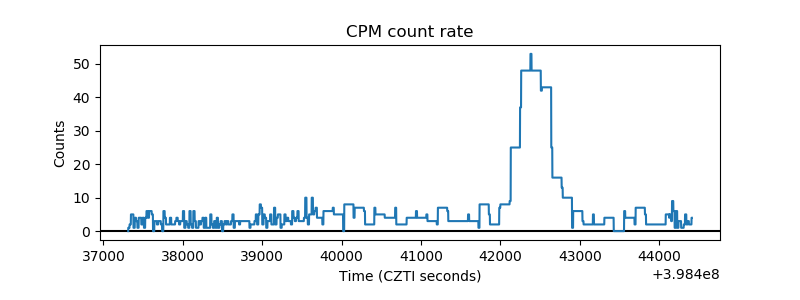 |
| CZT Counter | 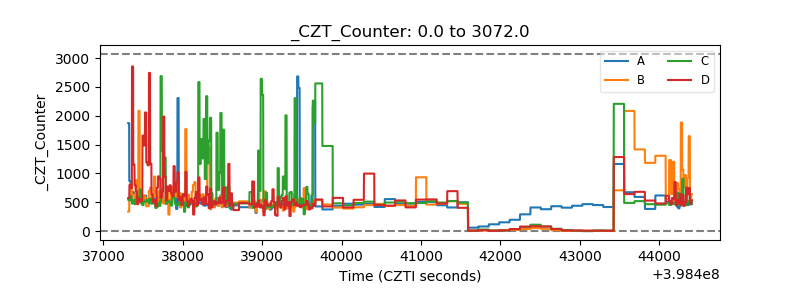 |
| +2.5 Volts monitor | 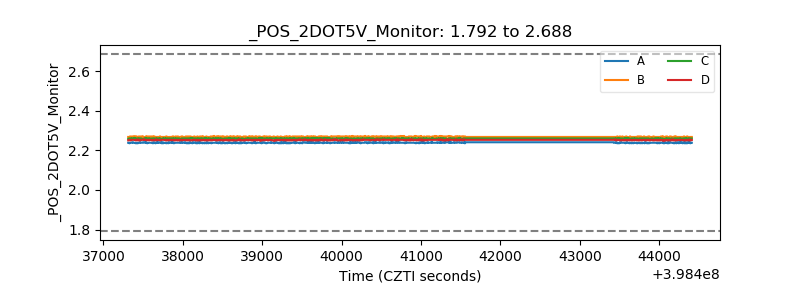 |
| +5 Volts monitor |  |
| _ROLL_ROT | 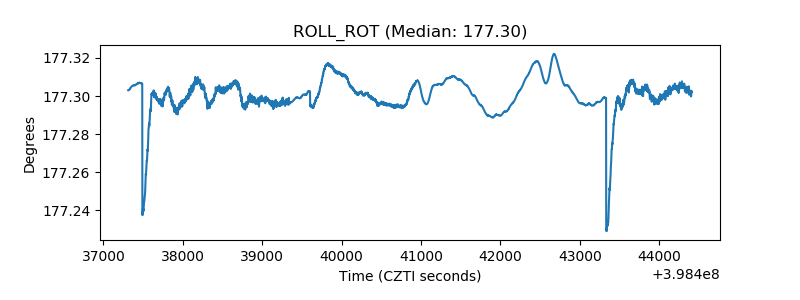 |
| _Roll_DEC | 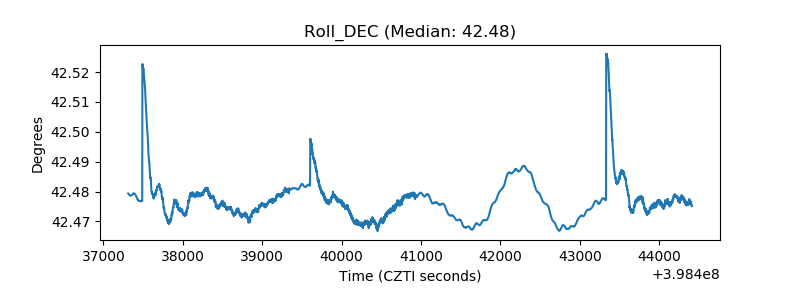 |
| _Roll_RA | 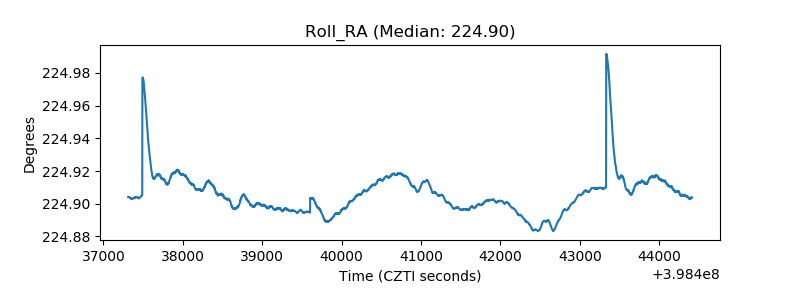 |
| Veto Counter | 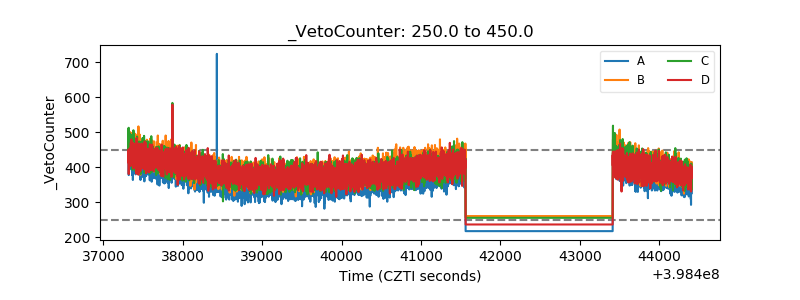 |