| Param | Original file | Final file |
|---|---|---|
| Filename | modeM0/AS1A10_123T11_9000005286_37235cztM0_level2.evt | modeM0/AS1A10_123T11_9000005286_37235cztM0_level2_quad_clean.evt |
| Size (bytes) | 429,618,240 | 63,504,000 |
| Size | 409.7 MB | 60.6 MB |
| Events in quadrant A | 3,148,390 | 402,011 |
| Events in quadrant B | 3,316,593 | 390,283 |
| Events in quadrant C | 2,713,048 | 386,541 |
| Events in quadrant D | 3,473,707 | 373,562 |
| Mode M0 | |||
|---|---|---|---|
| Quadrant | BADHDUFLAG | Total packets | Discarded packets |
| A | 0 | 12591 | 2 |
| B | 0 | 13293 | 1 |
| C | 0 | 11270 | 1 |
| D | 0 | 13667 | 1 |
| Mode M9 | |||
|---|---|---|---|
| Quadrant | BADHDUFLAG | Total packets | Discarded packets |
| A | 0 | 15 | 0 |
| B | 0 | 15 | 0 |
| C | 0 | 15 | 0 |
| D | 0 | 15 | 0 |
| Mode SS | |||
|---|---|---|---|
| Quadrant | BADHDUFLAG | Total packets | Discarded packets |
| A | 0 | 108 | 0 |
| B | 0 | 108 | 0 |
| C | 0 | 108 | 0 |
| D | 0 | 108 | 0 |
| Quadrant | Total seconds | Saturated seconds | Saturation percentage |
|---|---|---|---|
| A | 5287 | 203 | 3.839607% |
| B | 5287 | 135 | 2.553433% |
| C | 5287 | 73 | 1.380745% |
| D | 5287 | 102 | 1.929260% |
Noise dominated data is calculated using 1-second bins in cleaned event files. If a bin has >2000 counts, and if more than 50% of those come from <1% of pixels, then it is considered to be noise-dominated and hence unusable.
| Quadrant | # 1 sec bins | Bins with >0 counts | Bins with >2000 counts | High rate bins dominated by noise | Noise dominated (total time) | Noise dominated (detector-on time) | Marked lightcurve |
|---|---|---|---|---|---|---|---|
| A | 6779 | 5288 | 176 | 176 | 2.60% | 3.33% | 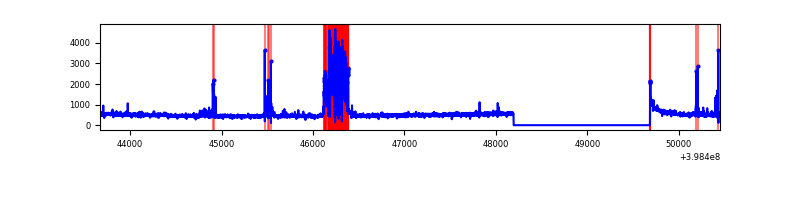 |
| B | 6779 | 5288 | 83 | 83 | 1.22% | 1.57% | 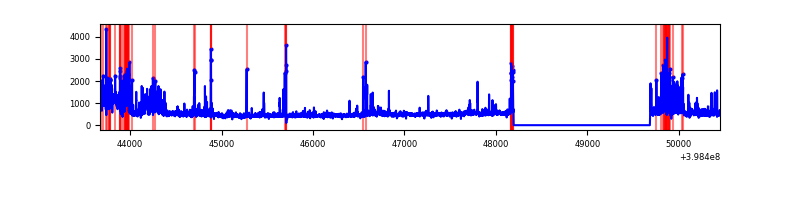 |
| C | 6779 | 5288 | 56 | 56 | 0.83% | 1.06% |  |
| D | 6779 | 5288 | 97 | 97 | 1.43% | 1.83% | 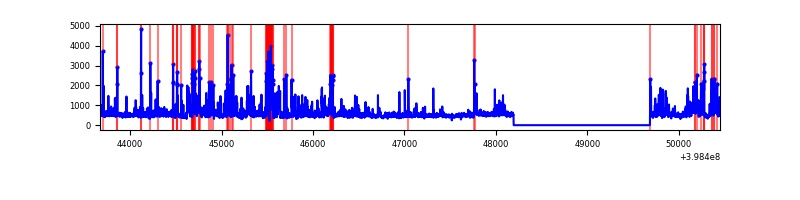 |
Top three noisy pixels from each quadrant. If the there are fewer than three noisy pixels in the level2.evt file, extra rows are filled as -1
| Pixel properties | Quadrant properties | ||||||
|---|---|---|---|---|---|---|---|
| Quadrant | DetID | PixID | Counts | Sigma | Mean | Median | Sigma |
| A | 15 | 237 | 553451 | 4640.69 | 586 | 574 | 119.1 |
| A | 10 | 83 | 235175 | 1969.17 | 586 | 574 | 119.1 |
| A | 9 | 143 | 35999 | 297.35 | 586 | 574 | 119.1 |
| B | 5 | 172 | 386207 | 3373.86 | 592 | 576 | 114.3 |
| B | 4 | 232 | 218598 | 1907.46 | 592 | 576 | 114.3 |
| B | 0 | 213 | 74001 | 642.39 | 592 | 576 | 114.3 |
| C | 15 | 214 | 220277 | 1609.54 | 580 | 583 | 136.5 |
| C | 0 | 10 | 128849 | 939.71 | 580 | 583 | 136.5 |
| C | 14 | 254 | 88132 | 641.41 | 580 | 583 | 136.5 |
| D | 2 | 249 | 399572 | 2761.82 | 584 | 567 | 144.5 |
| D | 2 | 250 | 146018 | 1006.78 | 584 | 567 | 144.5 |
| D | 12 | 233 | 114981 | 791.95 | 584 | 567 | 144.5 |
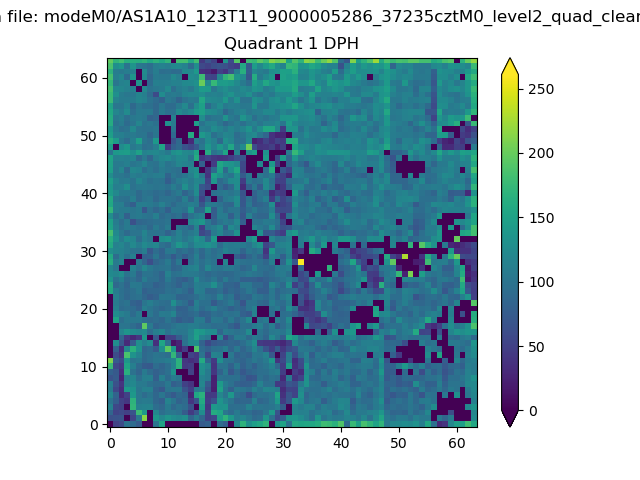
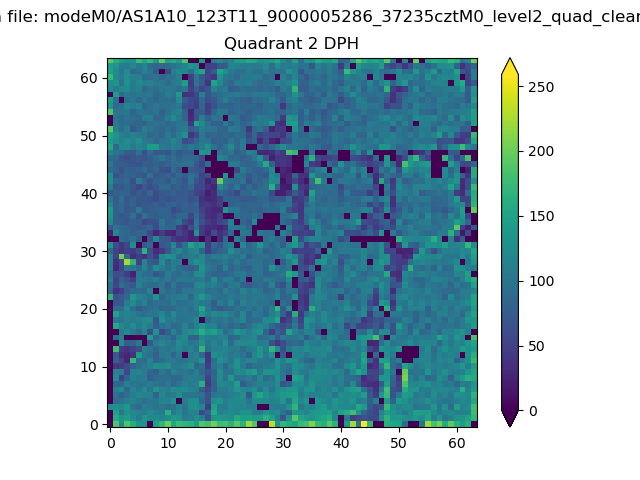
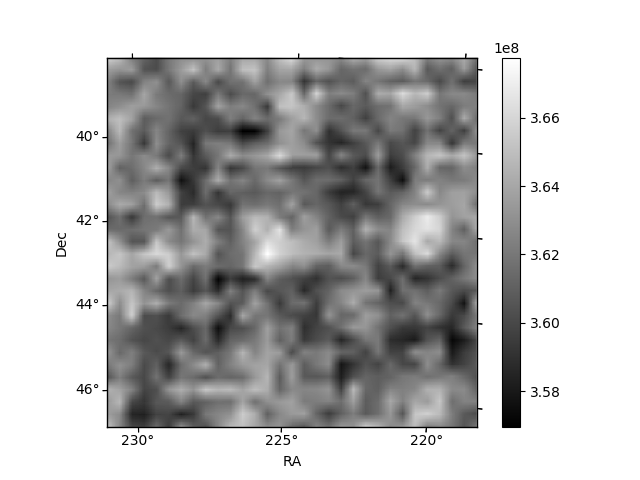
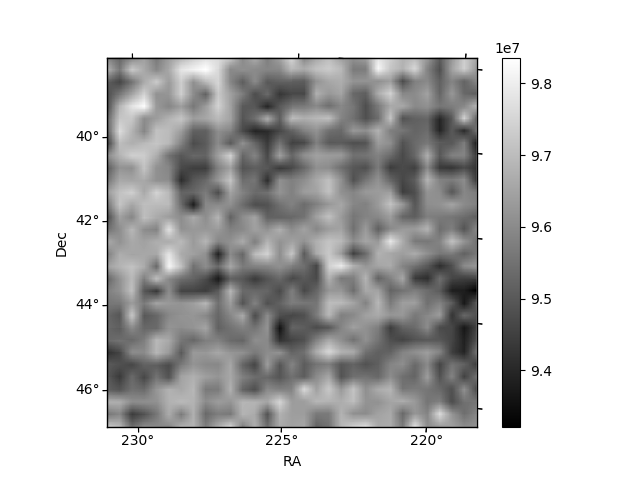
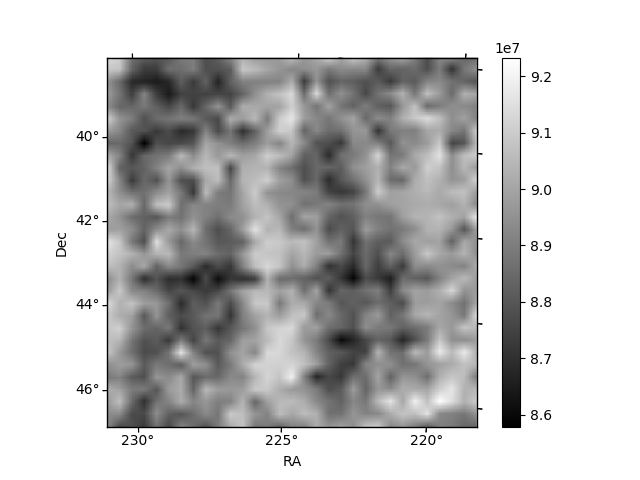
Histogram calculated using DETX and DETY for each event in the final _common_clean file
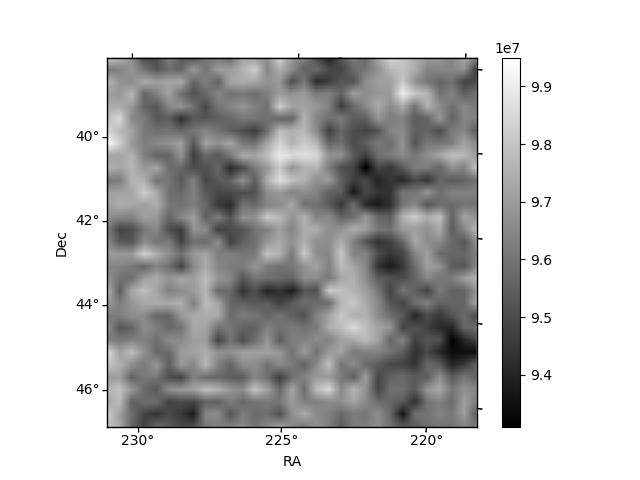
| Quadrant A | 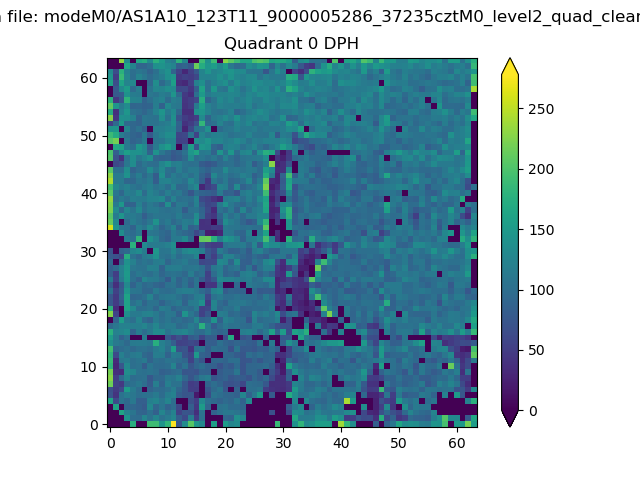 |
 |
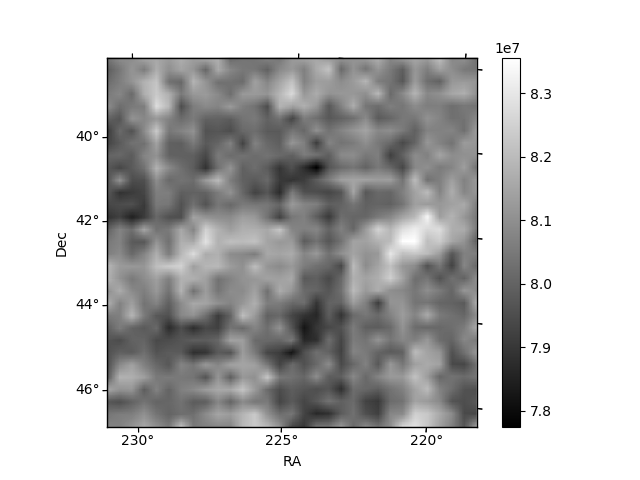
Quadrant B |
|---|---|---|---|
| Quadrant D | 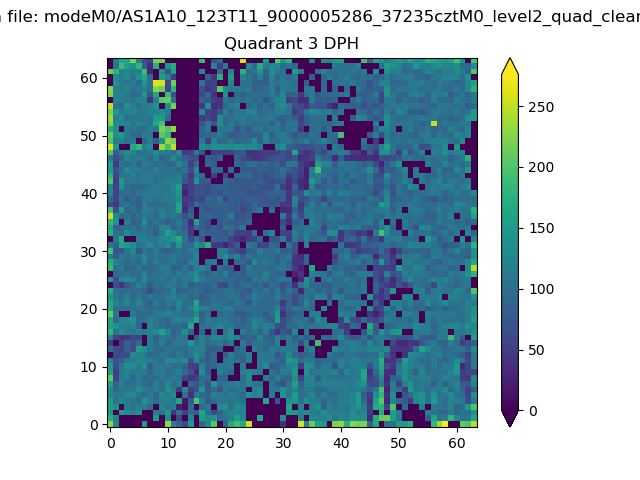 |
 |
Quadrant C |
| Plot type | Count rate plots | Images |
|---|---|---|
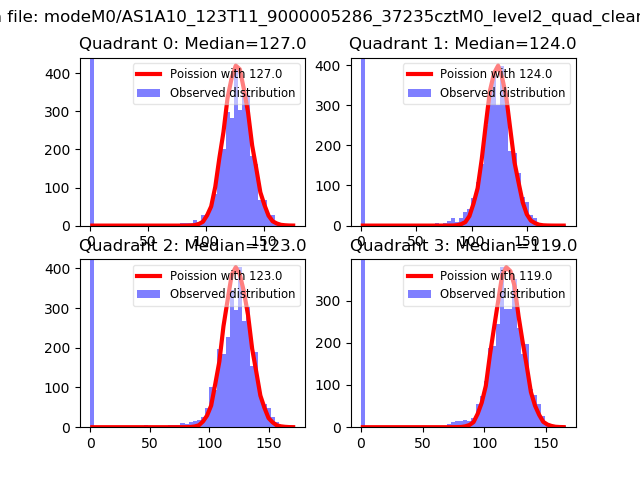
| Comparison with Poisson distribution Blue bars denote a histogram of data divided into 1 sec bins. Red curve is a Poisson curve with rate = median count rate of data. |
 |
 |
| Quadrant-wise count rates Data is divided into 100 sec bins |
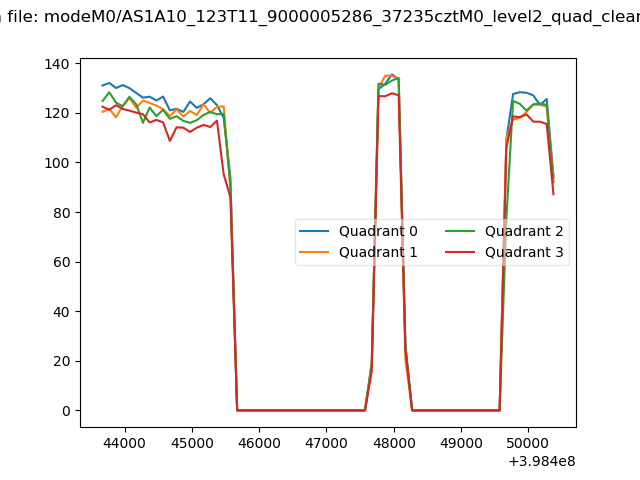 |
|
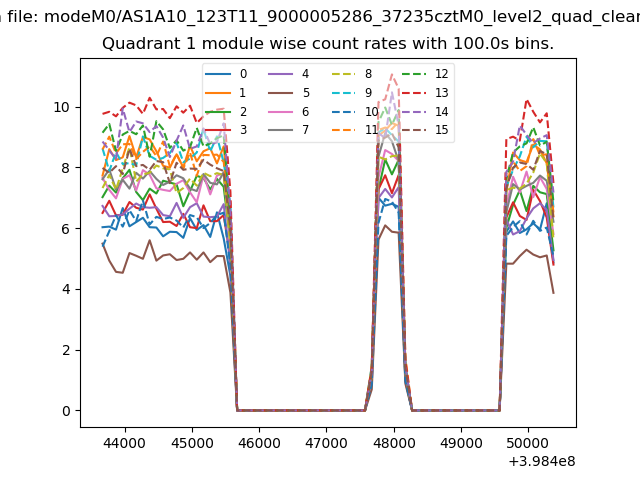
| Module-wise count rates for Quadrant A Data is divided into 100 sec bins |
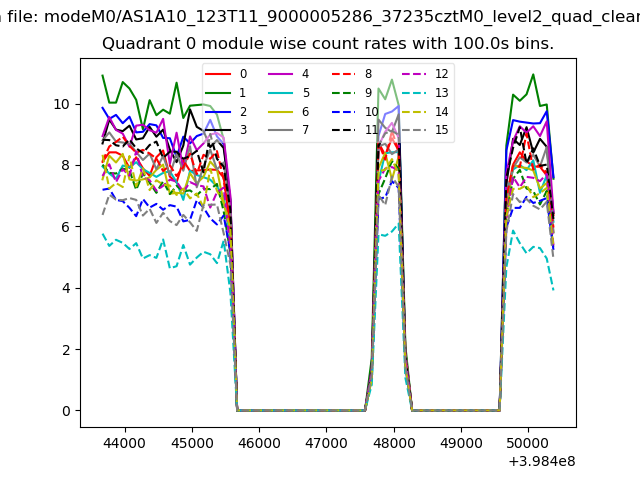 |
 |
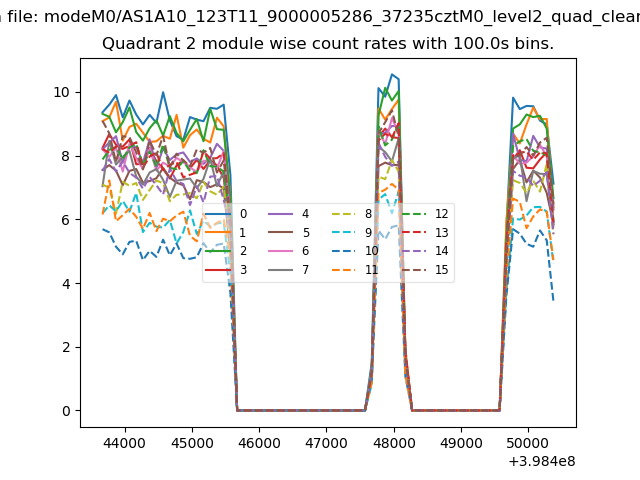
| Module-wise count rates for Quadrant B Data is divided into 100 sec bins |
 |
 |
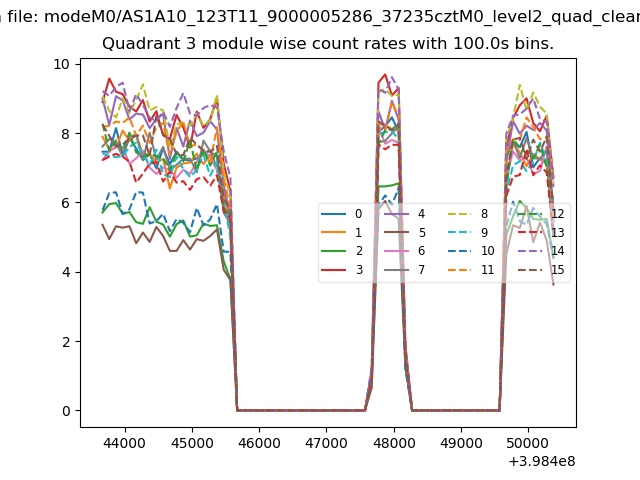
| Module-wise count rates for Quadrant C Data is divided into 100 sec bins |
 |
 |
| Module-wise count rates for Quadrant D Data is divided into 100 sec bins |
 |
 |
| Parameter | Plot |
|---|---|
| CZT HV Monitor | 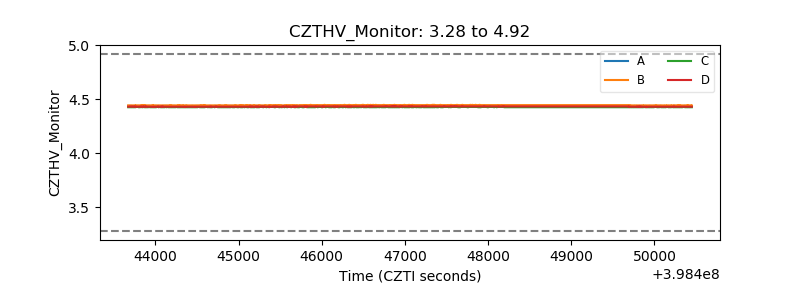 |
| D_VDD | 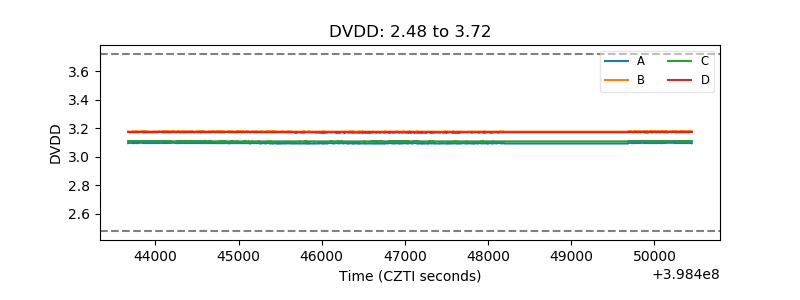 |
| Temperature 1 | 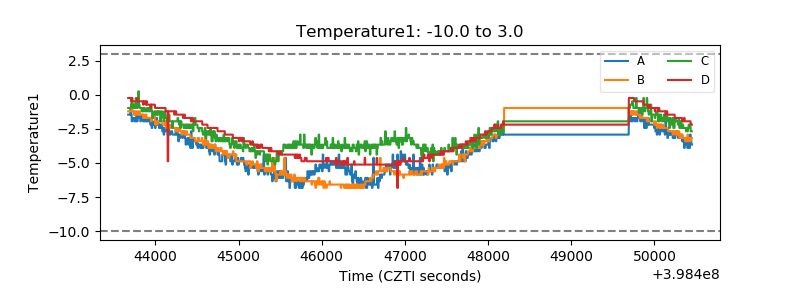 |
| Veto HV Monitor | 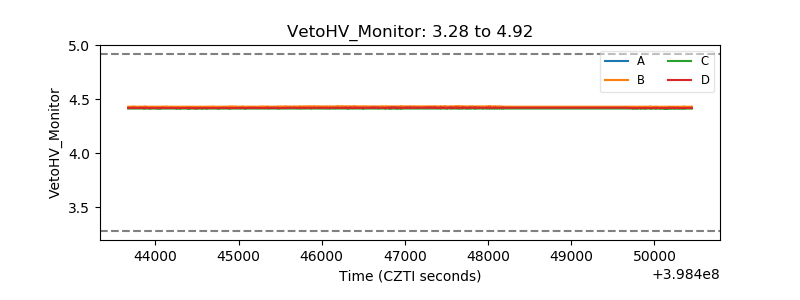 |
| Veto LLD | 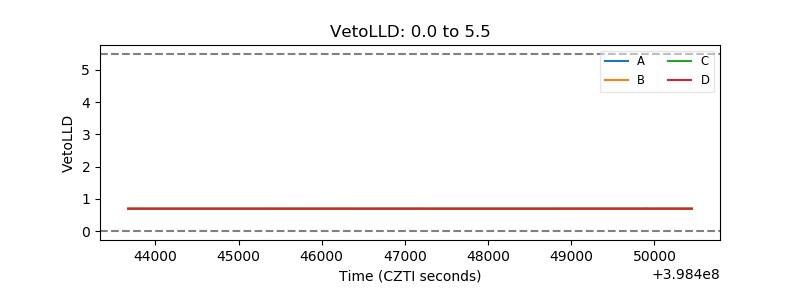 |
| Alpha Counter | 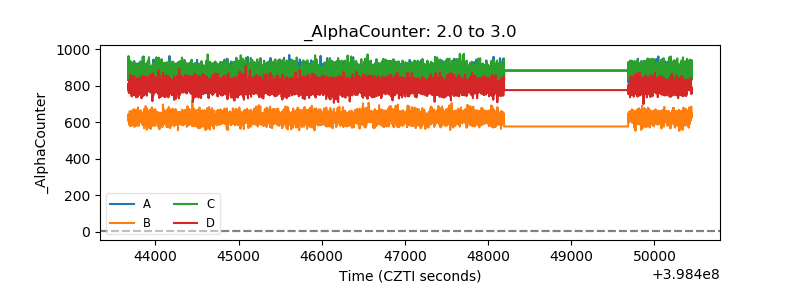 |
| _CPM_Rate | 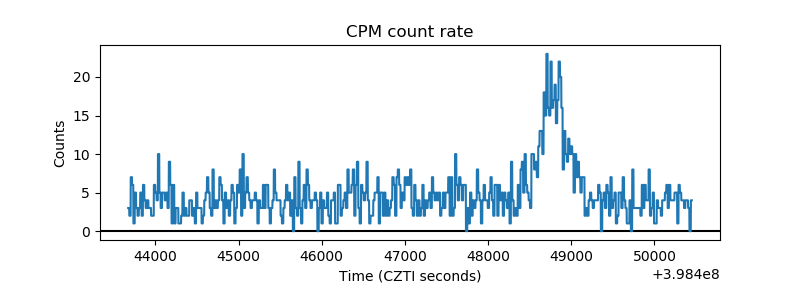 |
| CZT Counter | 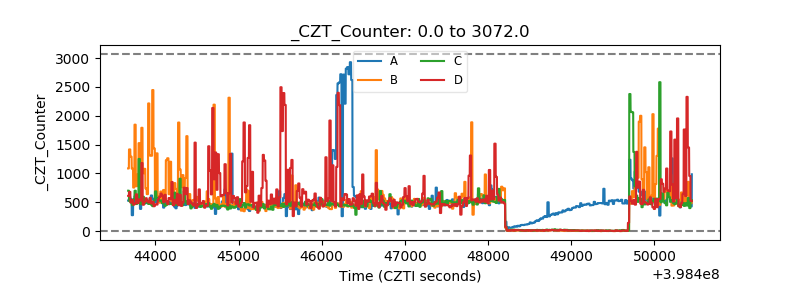 |
| +2.5 Volts monitor | 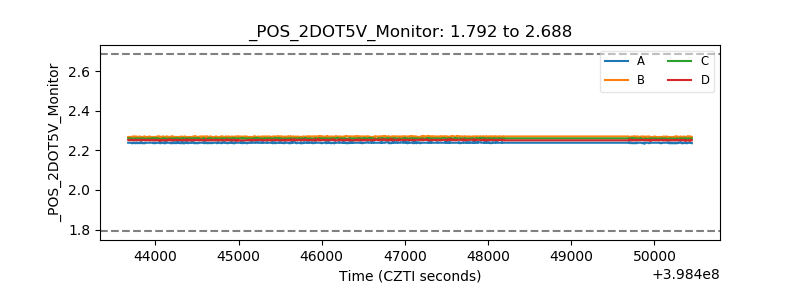 |
| +5 Volts monitor | 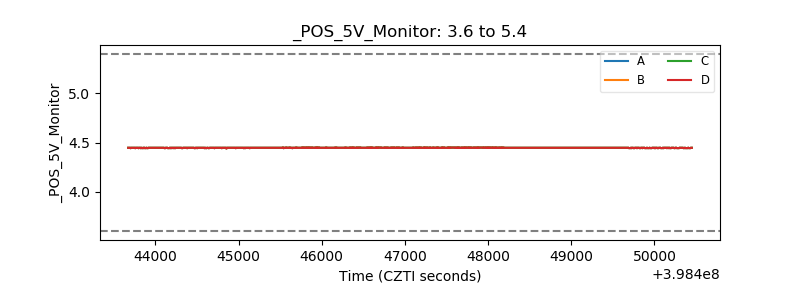 |
| _ROLL_ROT |  |
| _Roll_DEC | 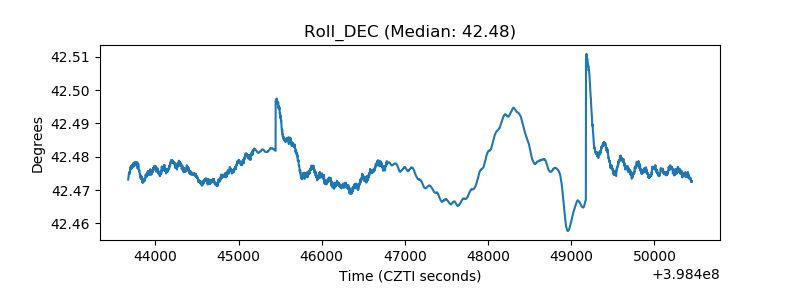 |
| _Roll_RA | 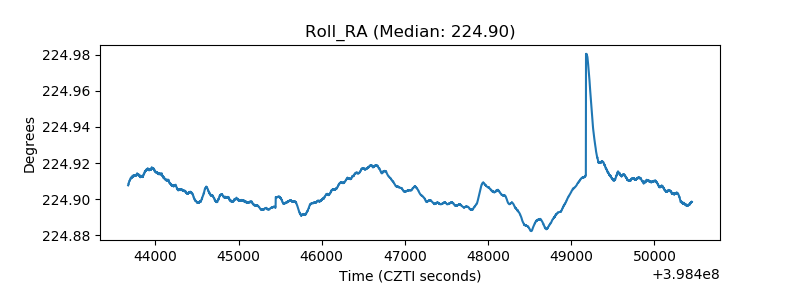 |
| Veto Counter | 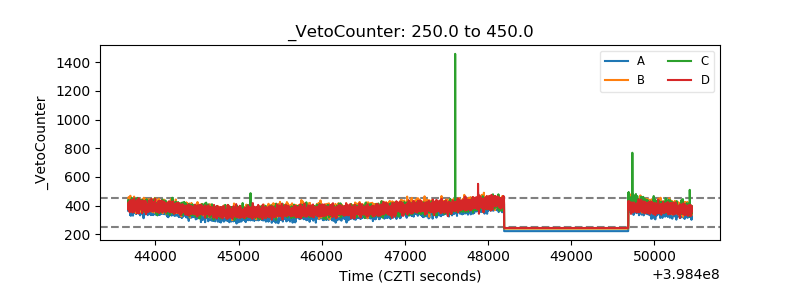 |