| Param | Original file | Final file |
|---|---|---|
| Filename | modeM0/AS1A10_123T11_9000005286_37237cztM0_level2.evt | modeM0/AS1A10_123T11_9000005286_37237cztM0_level2_quad_clean.evt |
| Size (bytes) | 506,773,440 | 76,625,280 |
| Size | 483.3 MB | 73.1 MB |
| Events in quadrant A | 3,698,245 | 488,733 |
| Events in quadrant B | 3,899,176 | 479,603 |
| Events in quadrant C | 3,127,867 | 473,338 |
| Events in quadrant D | 4,213,850 | 457,727 |
| Mode M0 | |||
|---|---|---|---|
| Quadrant | BADHDUFLAG | Total packets | Discarded packets |
| A | 0 | 14929 | 3 |
| B | 0 | 15658 | 2 |
| C | 0 | 13039 | 2 |
| D | 0 | 16677 | 2 |
| Mode M9 | |||
|---|---|---|---|
| Quadrant | BADHDUFLAG | Total packets | Discarded packets |
| A | 0 | 19 | 0 |
| B | 0 | 19 | 0 |
| C | 0 | 19 | 0 |
| D | 0 | 20 | 0 |
| Mode SS | |||
|---|---|---|---|
| Quadrant | BADHDUFLAG | Total packets | Discarded packets |
| A | 0 | 120 | 0 |
| B | 0 | 120 | 0 |
| C | 0 | 120 | 0 |
| D | 0 | 120 | 0 |
| Quadrant | Total seconds | Saturated seconds | Saturation percentage |
|---|---|---|---|
| A | 6033 | 157 | 2.602354% |
| B | 6033 | 138 | 2.287419% |
| C | 6033 | 61 | 1.011106% |
| D | 6033 | 279 | 4.624565% |
Noise dominated data is calculated using 1-second bins in cleaned event files. If a bin has >2000 counts, and if more than 50% of those come from <1% of pixels, then it is considered to be noise-dominated and hence unusable.
| Quadrant | # 1 sec bins | Bins with >0 counts | Bins with >2000 counts | High rate bins dominated by noise | Noise dominated (total time) | Noise dominated (detector-on time) | Marked lightcurve |
|---|---|---|---|---|---|---|---|
| A | 7346 | 6034 | 134 | 134 | 1.82% | 2.22% | 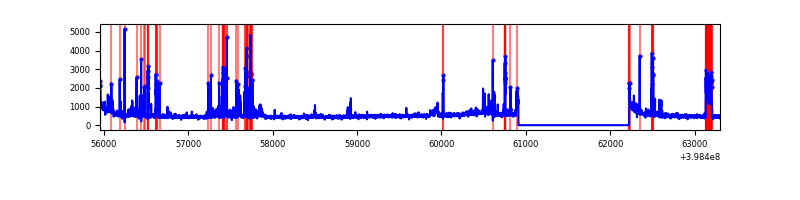 |
| B | 7346 | 6034 | 72 | 72 | 0.98% | 1.19% | 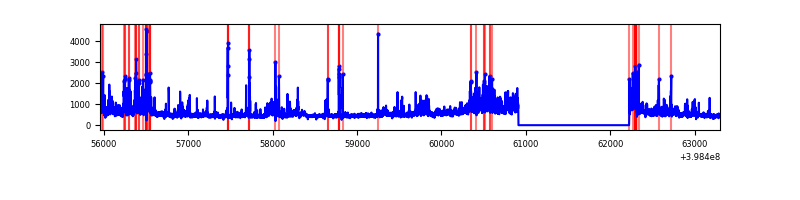 |
| C | 7346 | 6034 | 47 | 47 | 0.64% | 0.78% | 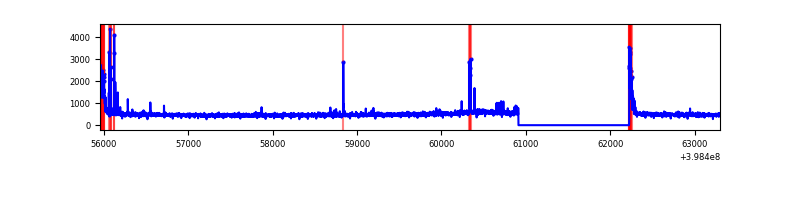 |
| D | 7346 | 6034 | 228 | 228 | 3.10% | 3.78% | 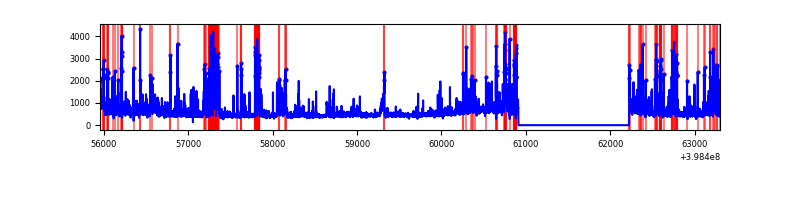 |
Top three noisy pixels from each quadrant. If the there are fewer than three noisy pixels in the level2.evt file, extra rows are filled as -1
| Pixel properties | Quadrant properties | ||||||
|---|---|---|---|---|---|---|---|
| Quadrant | DetID | PixID | Counts | Sigma | Mean | Median | Sigma |
| A | 15 | 237 | 435647 | 3131.1 | 685 | 672 | 138.9 |
| A | 10 | 83 | 311031 | 2234.07 | 685 | 672 | 138.9 |
| A | 9 | 143 | 125224 | 896.57 | 685 | 672 | 138.9 |
| B | 0 | 190 | 249731 | 1884.28 | 682 | 664 | 132.2 |
| B | 5 | 172 | 211424 | 1594.48 | 682 | 664 | 132.2 |
| B | 0 | 155 | 156302 | 1177.46 | 682 | 664 | 132.2 |
| C | 15 | 214 | 252438 | 1600.71 | 668 | 674 | 157.3 |
| C | 0 | 10 | 162085 | 1026.25 | 668 | 674 | 157.3 |
| C | 14 | 254 | 62528 | 393.27 | 668 | 674 | 157.3 |
| D | 2 | 249 | 955776 | 5790.53 | 664 | 644 | 164.9 |
| D | 2 | 153 | 157455 | 950.67 | 664 | 644 | 164.9 |
| D | 13 | 249 | 103889 | 625.93 | 664 | 644 | 164.9 |
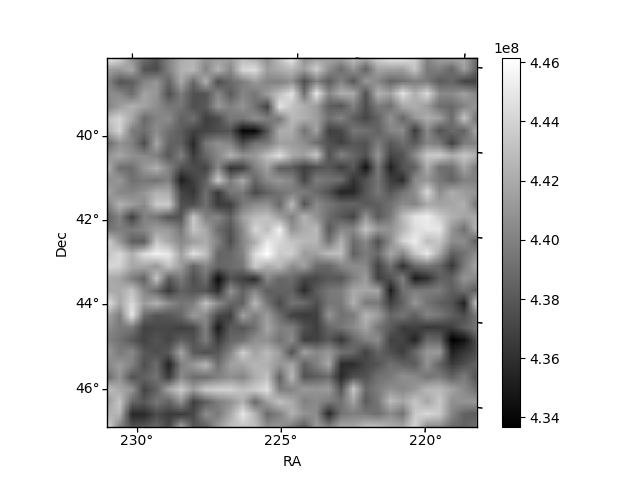
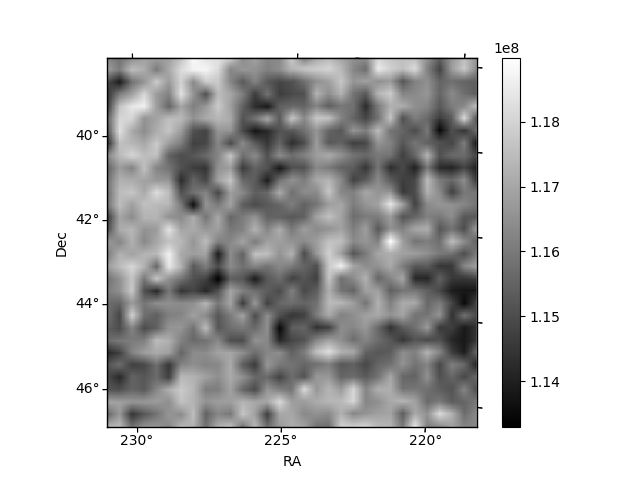
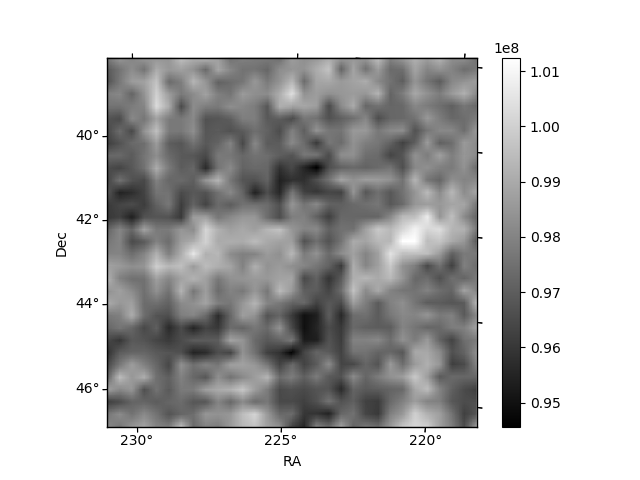
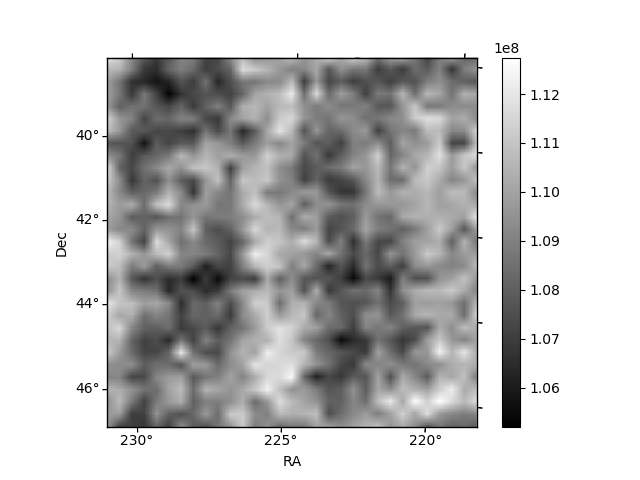
Histogram calculated using DETX and DETY for each event in the final _common_clean file
| Quadrant A | 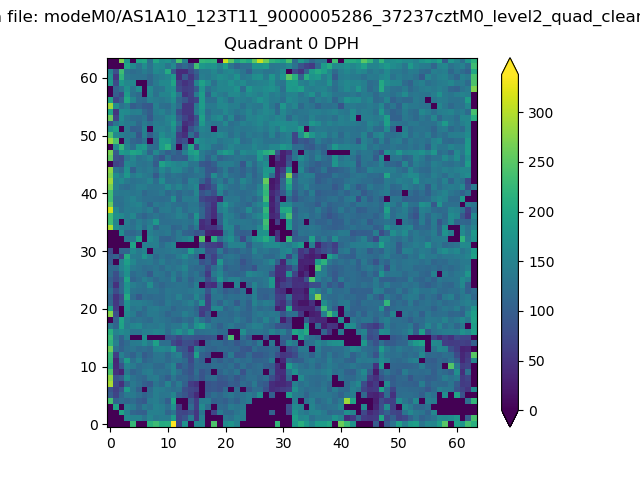 |
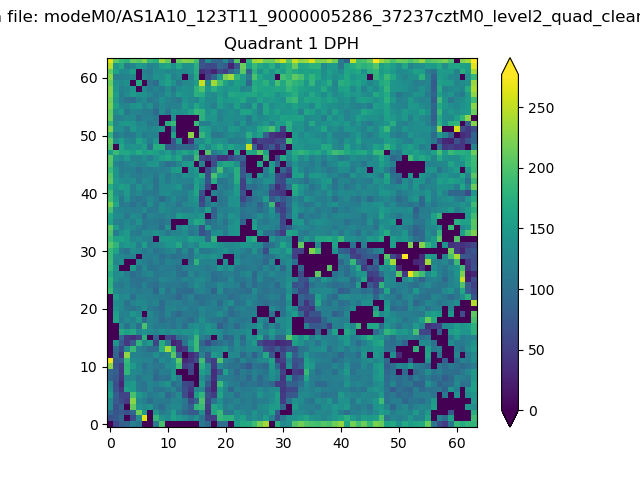 |
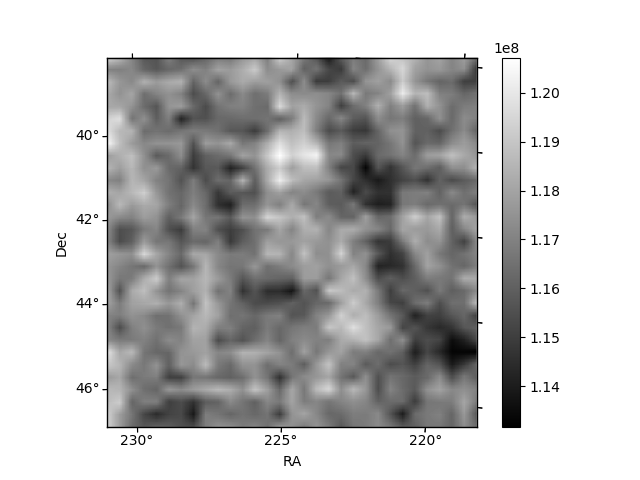
Quadrant B |
|---|---|---|---|
| Quadrant D | 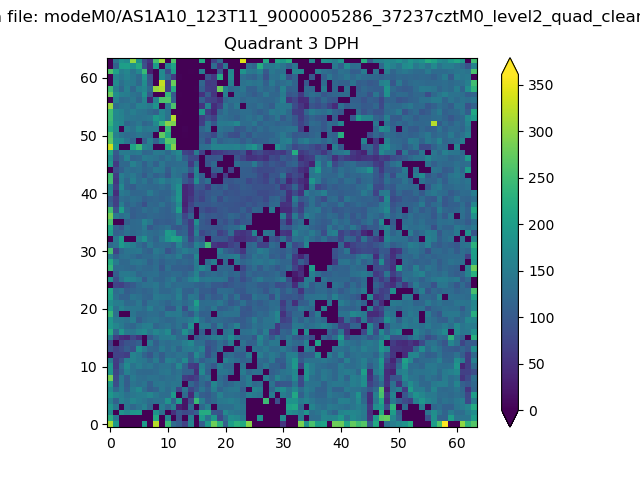 |
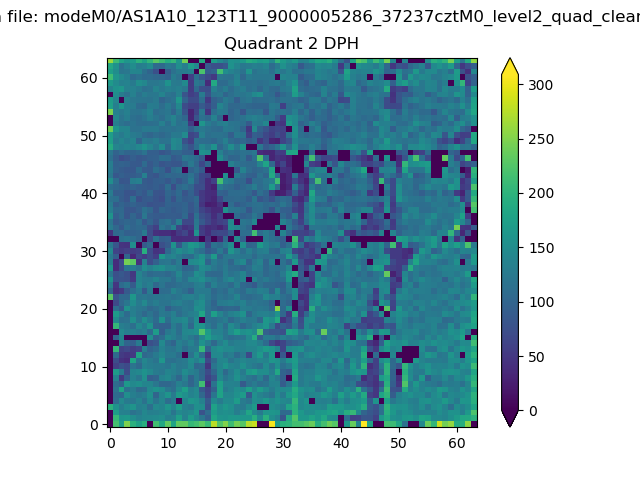 |
Quadrant C |
| Plot type | Count rate plots | Images |
|---|---|---|
| Comparison with Poisson distribution Blue bars denote a histogram of data divided into 1 sec bins. Red curve is a Poisson curve with rate = median count rate of data. |
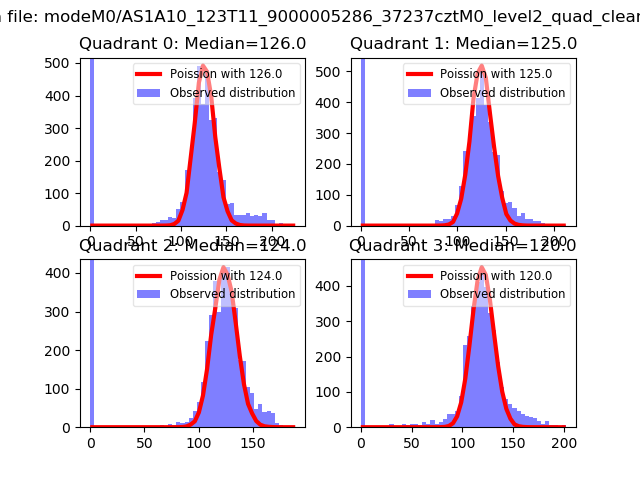 |
 |
| Quadrant-wise count rates Data is divided into 100 sec bins |
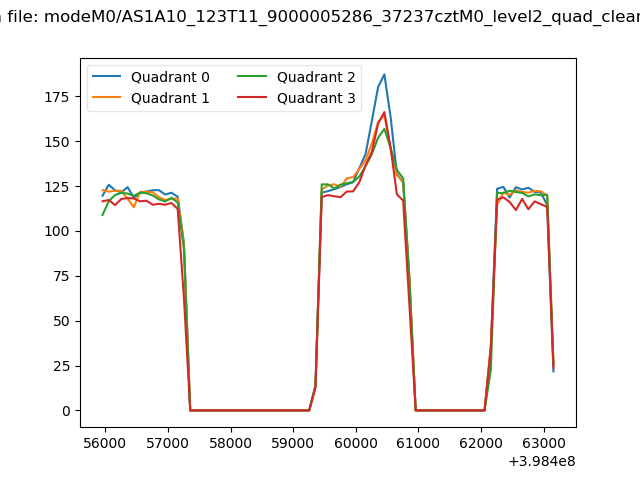 |
|
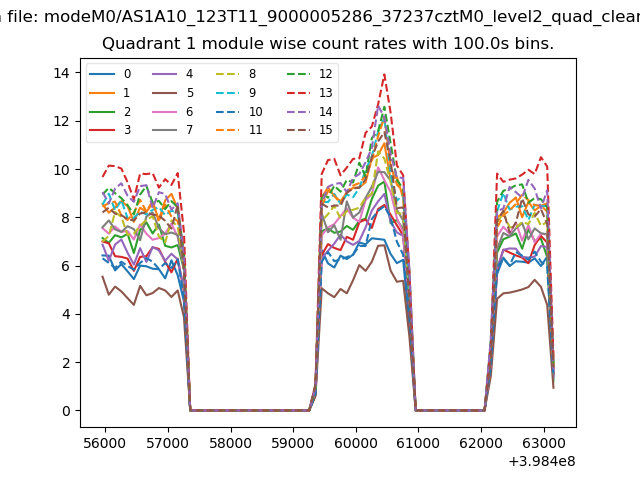
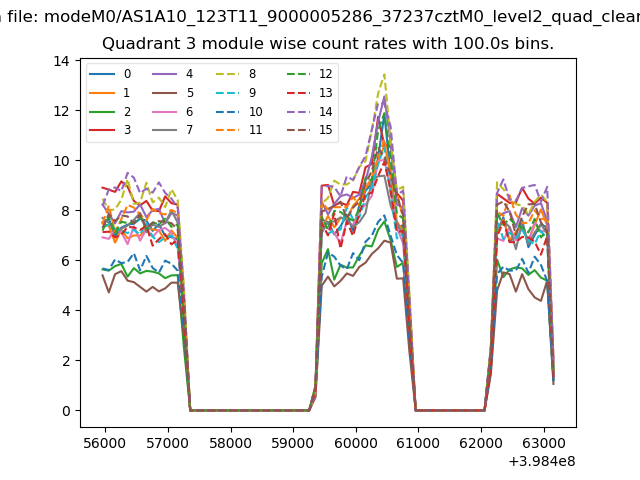
| Module-wise count rates for Quadrant A Data is divided into 100 sec bins |
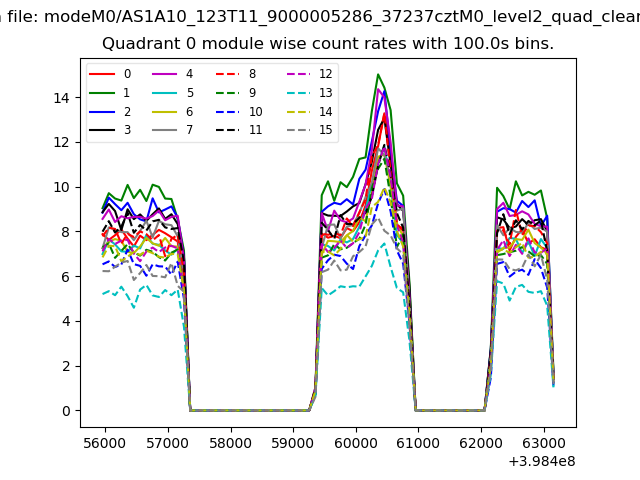 |
 |
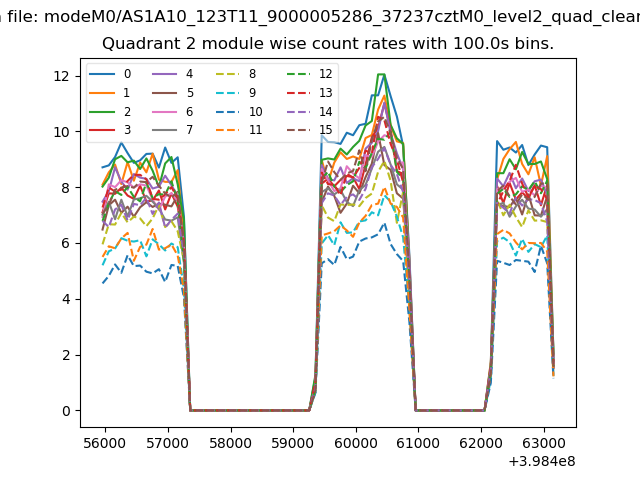
| Module-wise count rates for Quadrant B Data is divided into 100 sec bins |
 |
 |
| Module-wise count rates for Quadrant C Data is divided into 100 sec bins |
 |
 |
| Module-wise count rates for Quadrant D Data is divided into 100 sec bins |
 |
 |
| Parameter | Plot |
|---|---|
| CZT HV Monitor | 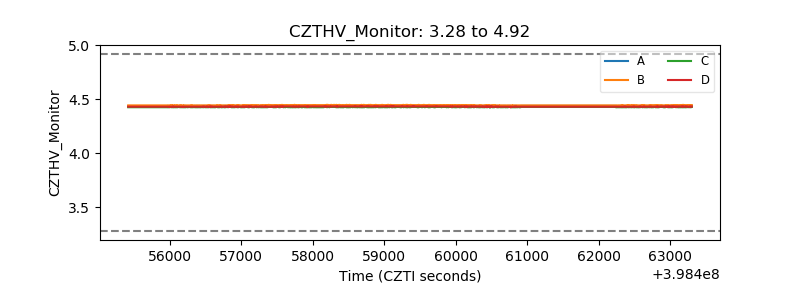 |
| D_VDD | 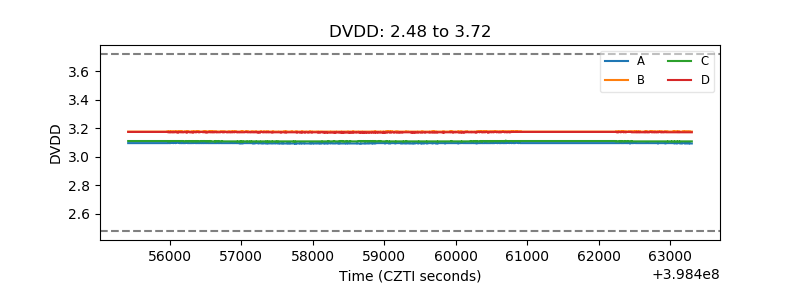 |
| Temperature 1 |  |
| Veto HV Monitor |  |
| Veto LLD | 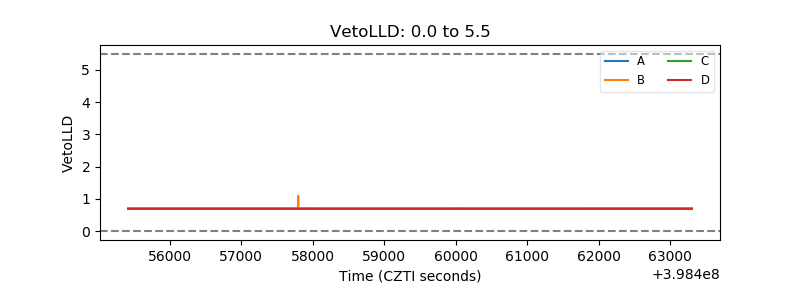 |
| Alpha Counter | 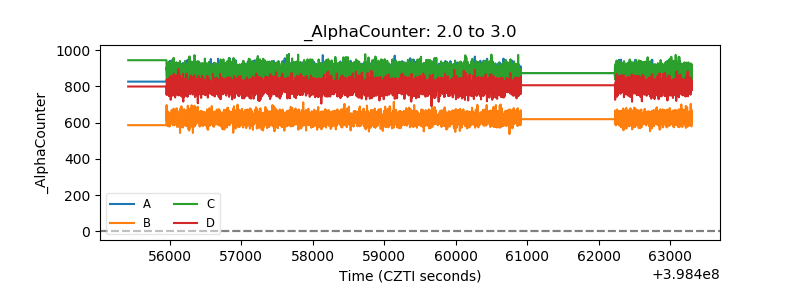 |
| _CPM_Rate | 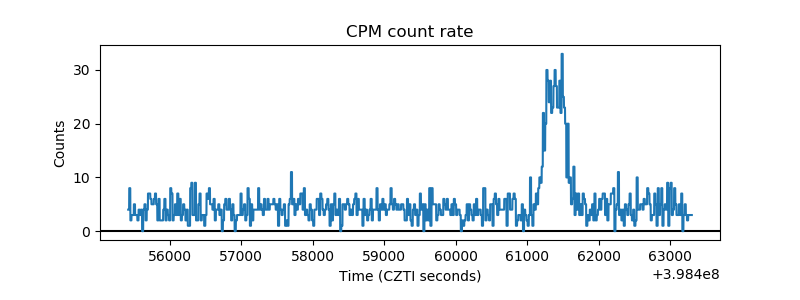 |
| CZT Counter | 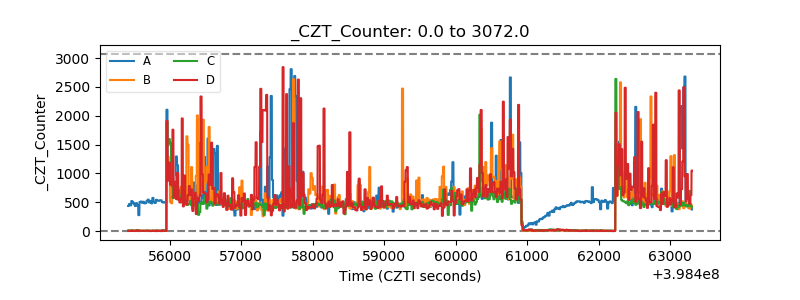 |
| +2.5 Volts monitor | 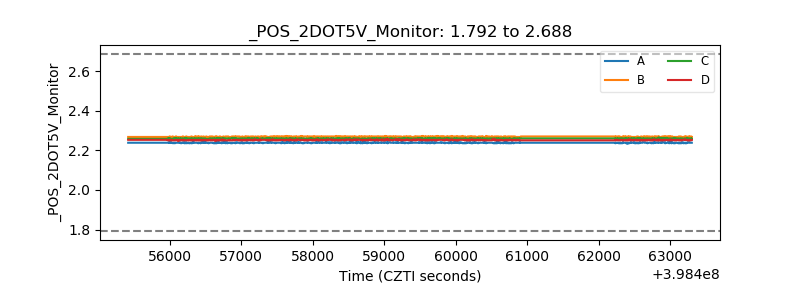 |
| +5 Volts monitor | 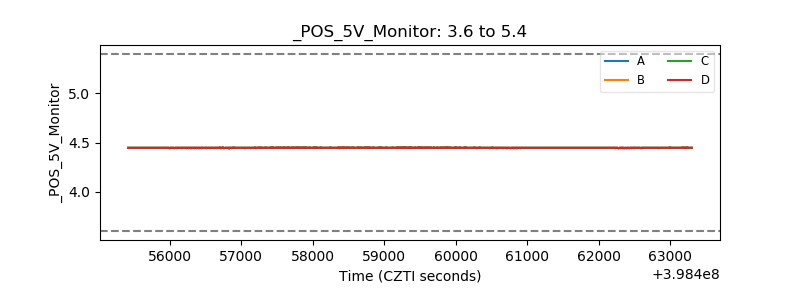 |
| _ROLL_ROT | 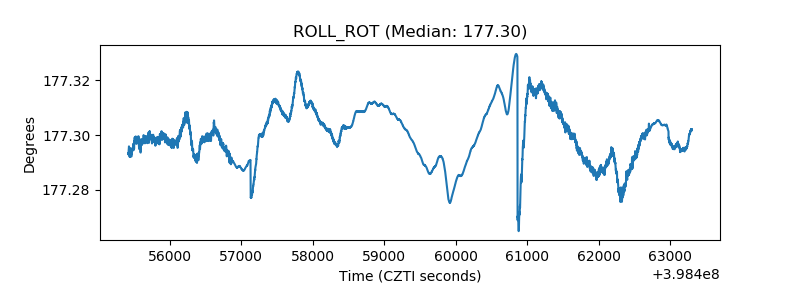 |
| _Roll_DEC | 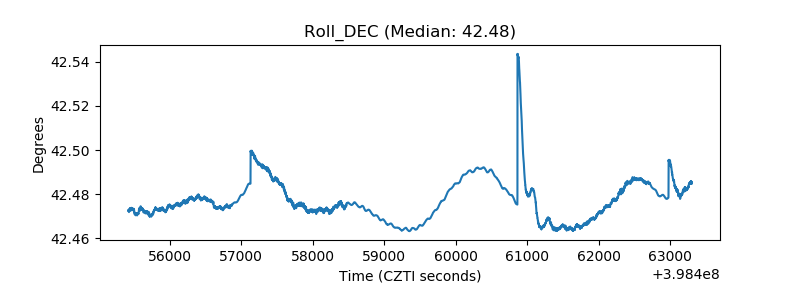 |
| _Roll_RA | 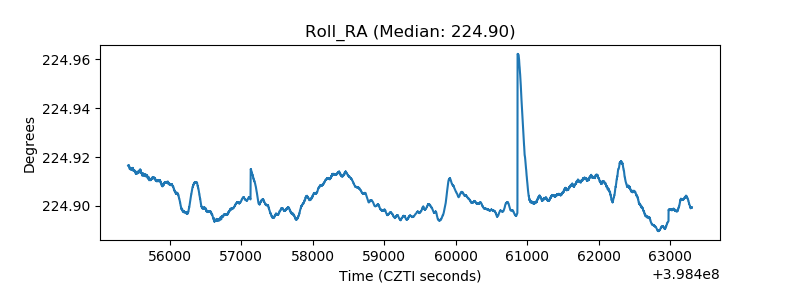 |
| Veto Counter | 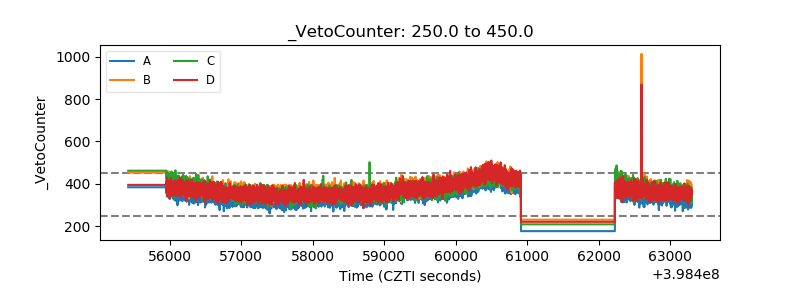 |