| Param | Original file | Final file |
|---|---|---|
| Filename | modeM0/AS1A10_123T11_9000005286_37239cztM0_level2.evt | modeM0/AS1A10_123T11_9000005286_37239cztM0_level2_quad_clean.evt |
| Size (bytes) | 771,068,160 | 101,041,920 |
| Size | 735.3 MB | 96.4 MB |
| Events in quadrant A | 6,079,823 | 624,082 |
| Events in quadrant B | 5,795,834 | 618,611 |
| Events in quadrant C | 4,705,313 | 606,936 |
| Events in quadrant D | 6,156,861 | 579,679 |
| Mode M0 | |||
|---|---|---|---|
| Quadrant | BADHDUFLAG | Total packets | Discarded packets |
| A | 0 | 24047 | 3 |
| B | 0 | 23385 | 2 |
| C | 0 | 19655 | 2 |
| D | 0 | 24675 | 2 |
| Mode M9 | |||
|---|---|---|---|
| Quadrant | BADHDUFLAG | Total packets | Discarded packets |
| A | 0 | 20 | 0 |
| B | 0 | 20 | 0 |
| C | 0 | 20 | 0 |
| D | 0 | 21 | 0 |
| Mode SS | |||
|---|---|---|---|
| Quadrant | BADHDUFLAG | Total packets | Discarded packets |
| A | 0 | 184 | 0 |
| B | 0 | 184 | 0 |
| C | 0 | 184 | 0 |
| D | 0 | 184 | 0 |
| Quadrant | Total seconds | Saturated seconds | Saturation percentage |
|---|---|---|---|
| A | 9080 | 480 | 5.286344% |
| B | 9080 | 173 | 1.905286% |
| C | 9080 | 78 | 0.859031% |
| D | 9080 | 394 | 4.339207% |
Noise dominated data is calculated using 1-second bins in cleaned event files. If a bin has >2000 counts, and if more than 50% of those come from <1% of pixels, then it is considered to be noise-dominated and hence unusable.
| Quadrant | # 1 sec bins | Bins with >0 counts | Bins with >2000 counts | High rate bins dominated by noise | Noise dominated (total time) | Noise dominated (detector-on time) | Marked lightcurve |
|---|---|---|---|---|---|---|---|
| A | 10452 | 9081 | 394 | 394 | 3.77% | 4.34% | 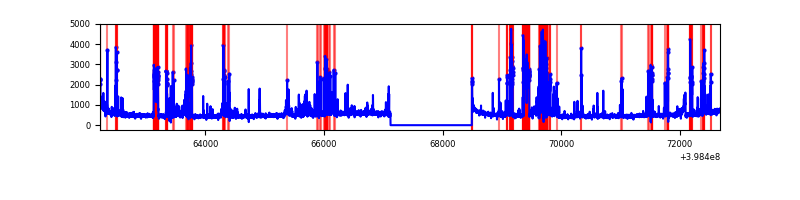 |
| B | 10452 | 9081 | 61 | 61 | 0.58% | 0.67% | 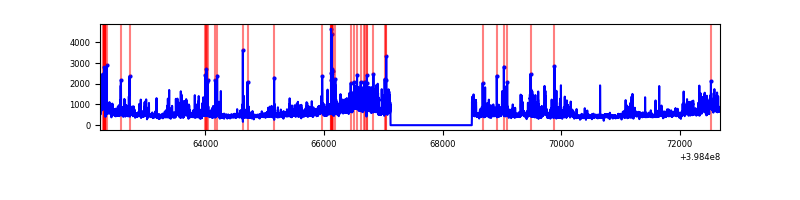 |
| C | 10452 | 9081 | 55 | 55 | 0.53% | 0.61% | 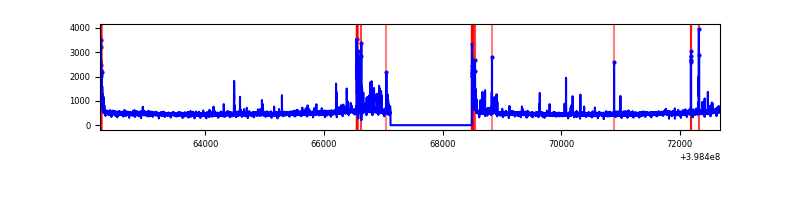 |
| D | 10451 | 9080 | 304 | 304 | 2.91% | 3.35% | 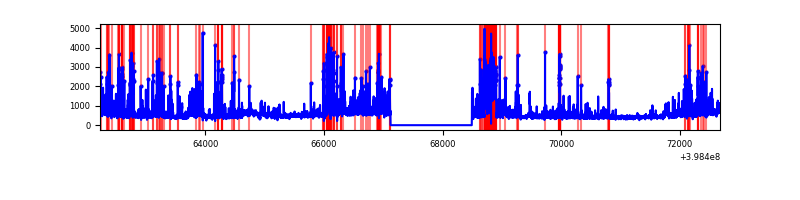 |
Top three noisy pixels from each quadrant. If the there are fewer than three noisy pixels in the level2.evt file, extra rows are filled as -1
| Pixel properties | Quadrant properties | ||||||
|---|---|---|---|---|---|---|---|
| Quadrant | DetID | PixID | Counts | Sigma | Mean | Median | Sigma |
| A | 15 | 237 | 1510288 | 7291.53 | 1021 | 1000 | 207.0 |
| A | 10 | 83 | 382030 | 1840.8 | 1021 | 1000 | 207.0 |
| A | 13 | 248 | 103199 | 493.73 | 1021 | 1000 | 207.0 |
| B | 0 | 190 | 438239 | 2195.43 | 1028 | 1001 | 199.2 |
| B | 0 | 155 | 403422 | 2020.61 | 1028 | 1001 | 199.2 |
| B | 4 | 232 | 165546 | 826.2 | 1028 | 1001 | 199.2 |
| C | 15 | 214 | 380884 | 1636.86 | 1002 | 1011 | 232.1 |
| C | 0 | 10 | 139500 | 596.75 | 1002 | 1011 | 232.1 |
| C | 14 | 254 | 87913 | 374.46 | 1002 | 1011 | 232.1 |
| D | 2 | 249 | 984697 | 4036.85 | 997 | 970 | 243.7 |
| D | 13 | 249 | 217028 | 886.62 | 997 | 970 | 243.7 |
| D | 13 | 171 | 196280 | 801.48 | 997 | 970 | 243.7 |
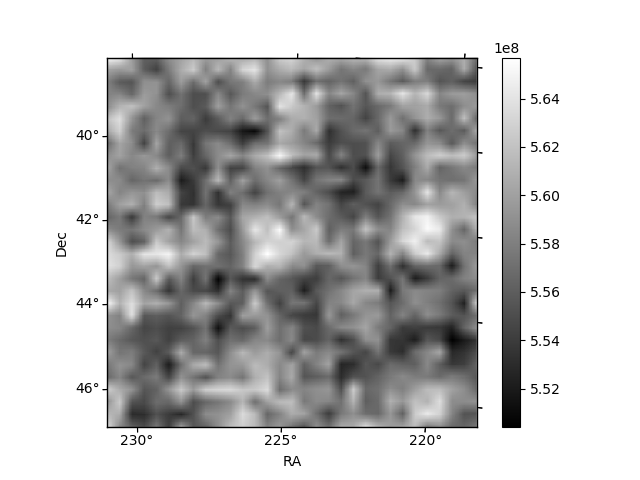
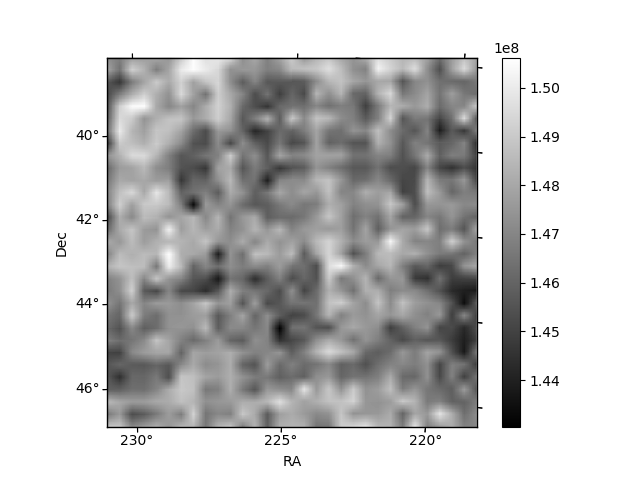
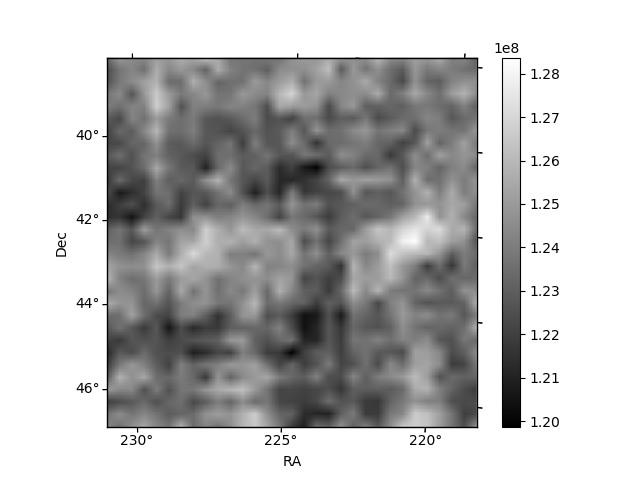
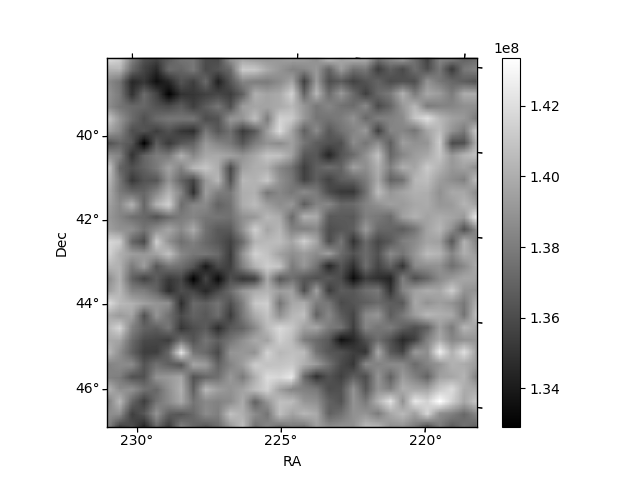
Histogram calculated using DETX and DETY for each event in the final _common_clean file
| Quadrant A | 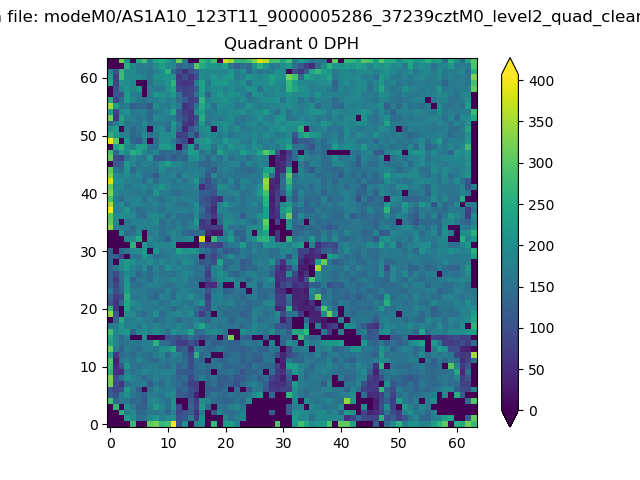 |
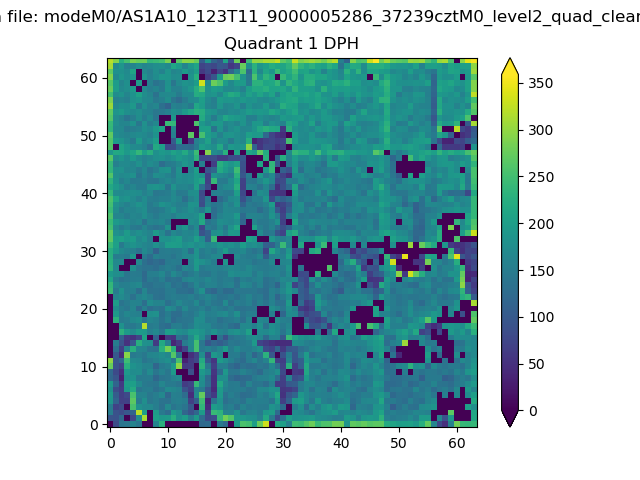 |
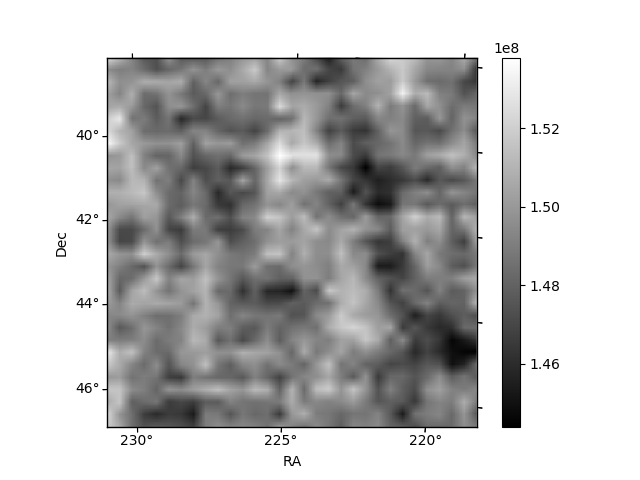
Quadrant B |
|---|---|---|---|
| Quadrant D | 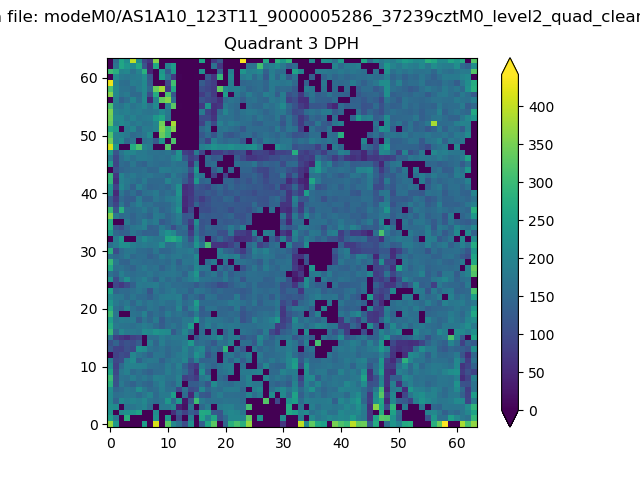 |
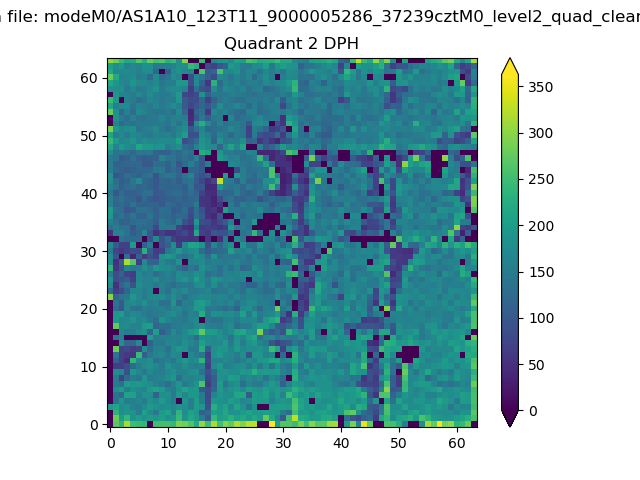 |
Quadrant C |
| Plot type | Count rate plots | Images |
|---|---|---|
| Comparison with Poisson distribution Blue bars denote a histogram of data divided into 1 sec bins. Red curve is a Poisson curve with rate = median count rate of data. |
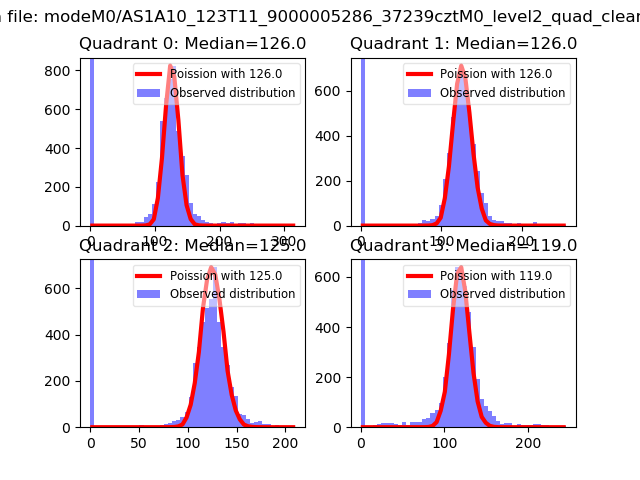 |
 |
| Quadrant-wise count rates Data is divided into 100 sec bins |
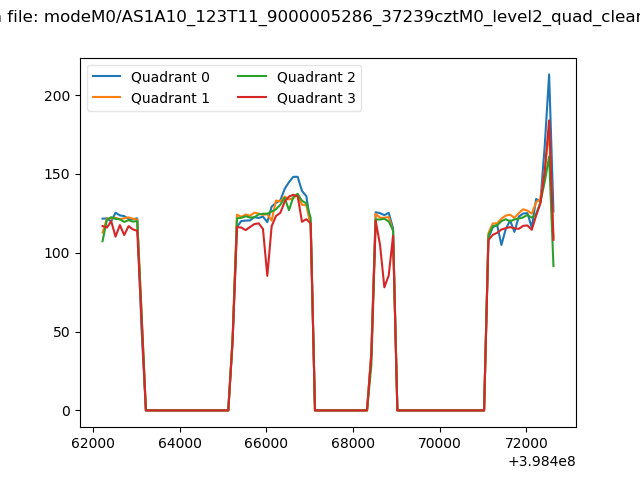 |
|
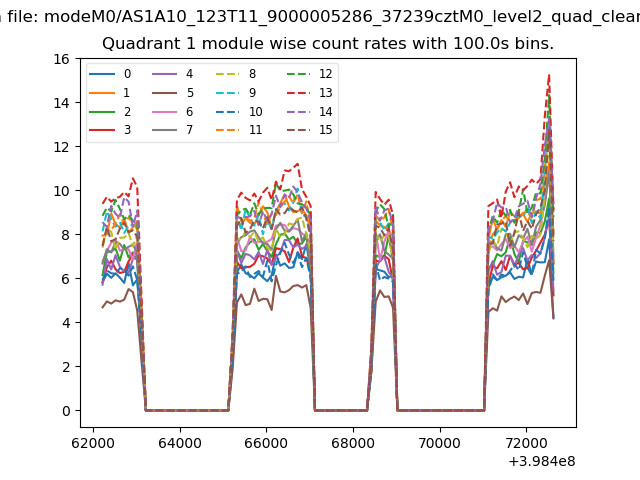
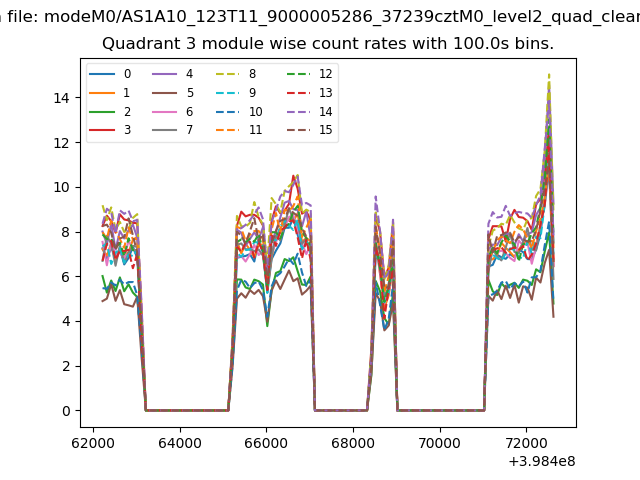
| Module-wise count rates for Quadrant A Data is divided into 100 sec bins |
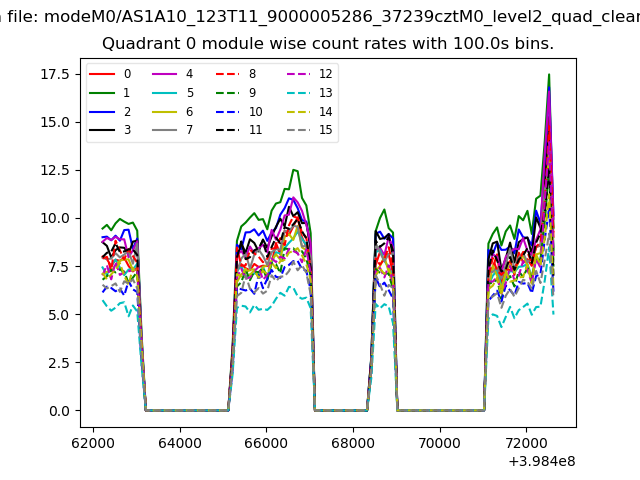 |
 |
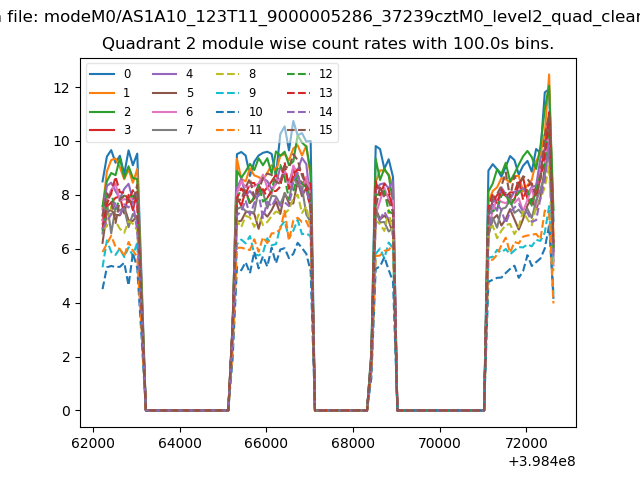
| Module-wise count rates for Quadrant B Data is divided into 100 sec bins |
 |
 |
| Module-wise count rates for Quadrant C Data is divided into 100 sec bins |
 |
 |
| Module-wise count rates for Quadrant D Data is divided into 100 sec bins |
 |
 |
| Parameter | Plot |
|---|---|
| CZT HV Monitor | 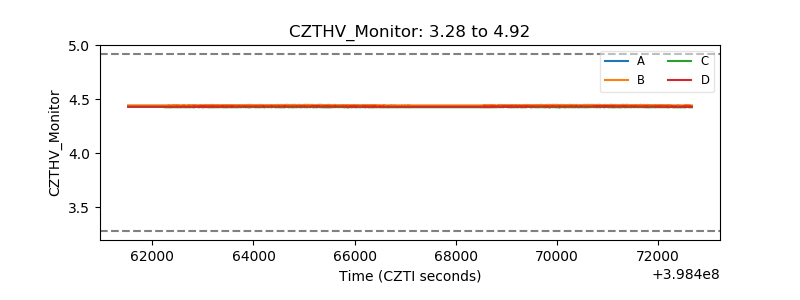 |
| D_VDD | 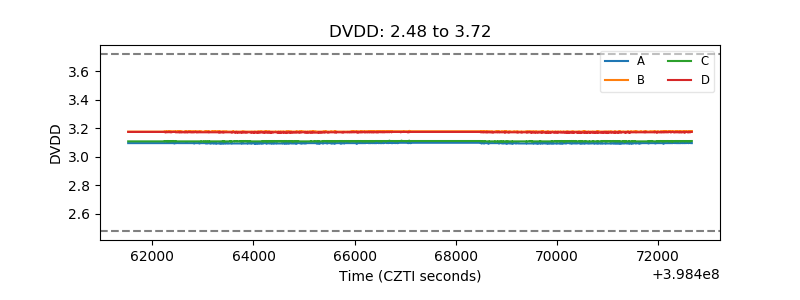 |
| Temperature 1 | 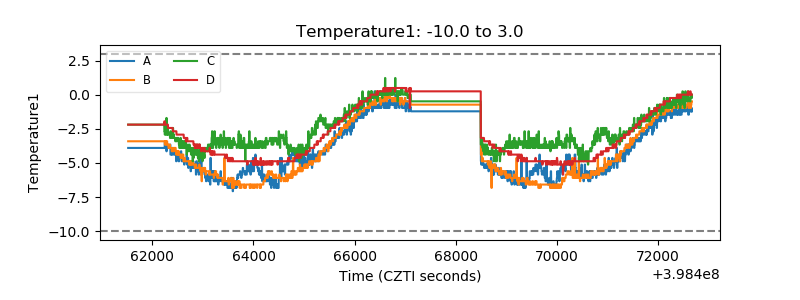 |
| Veto HV Monitor | 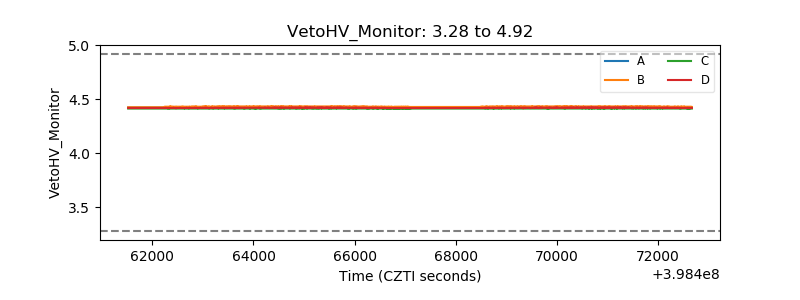 |
| Veto LLD |  |
| Alpha Counter | 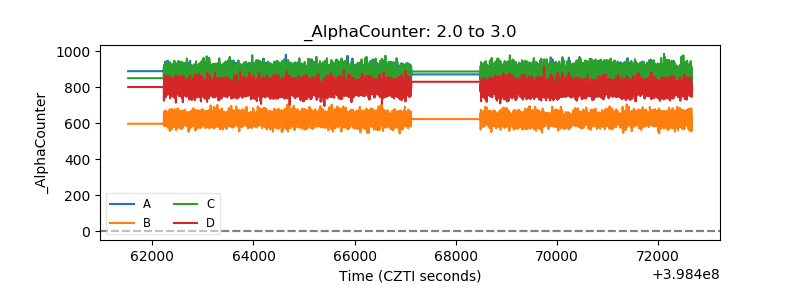 |
| _CPM_Rate | 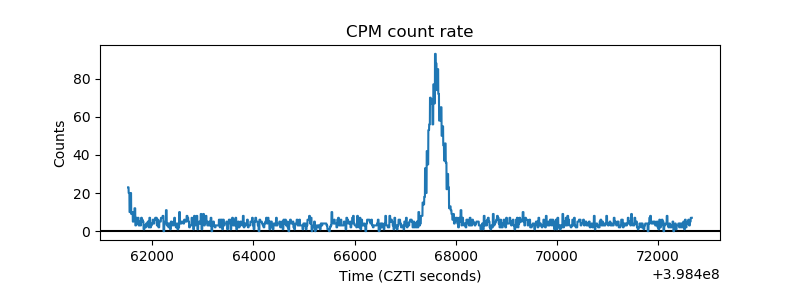 |
| CZT Counter | 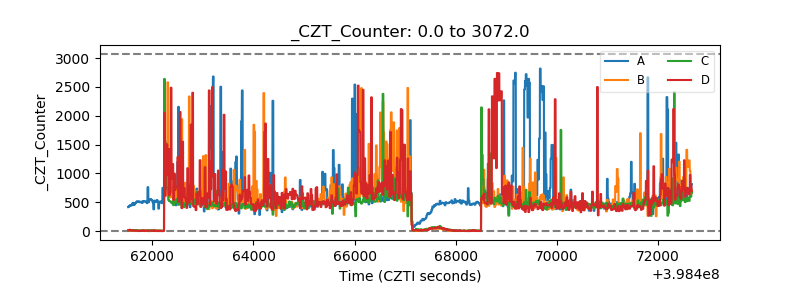 |
| +2.5 Volts monitor | 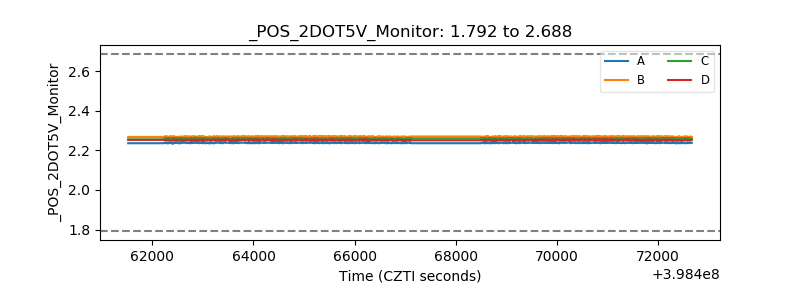 |
| +5 Volts monitor | 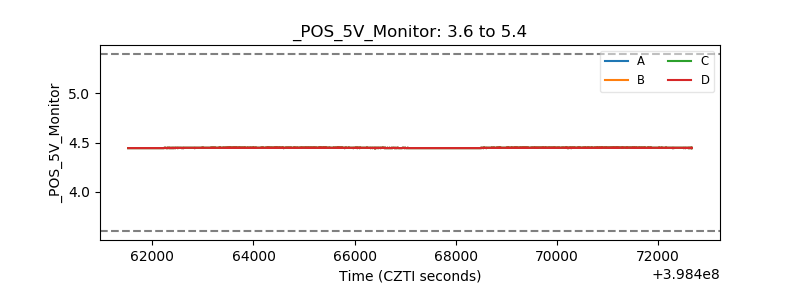 |
| _ROLL_ROT | 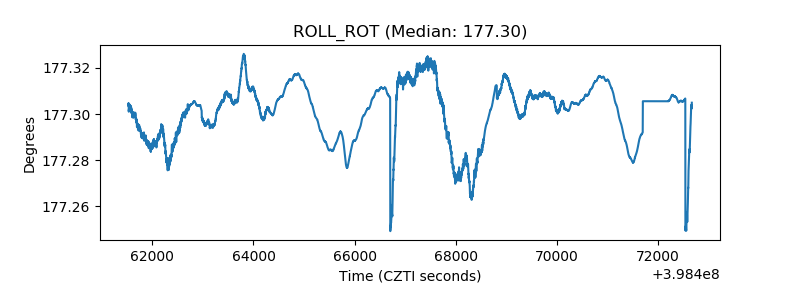 |
| _Roll_DEC | 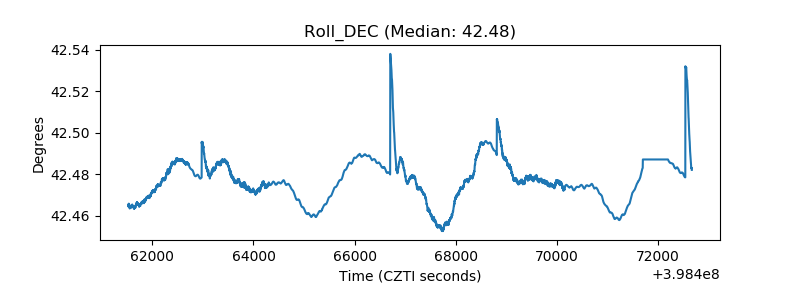 |
| _Roll_RA | 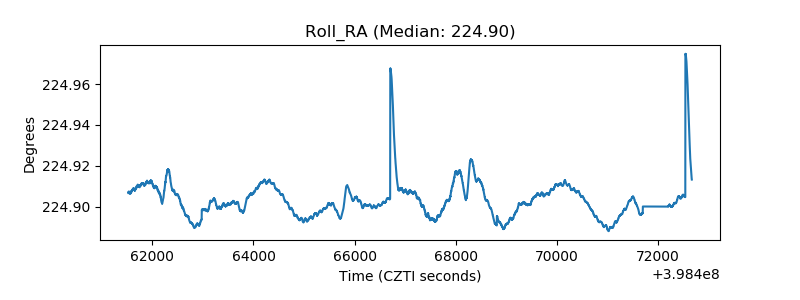 |
| Veto Counter | 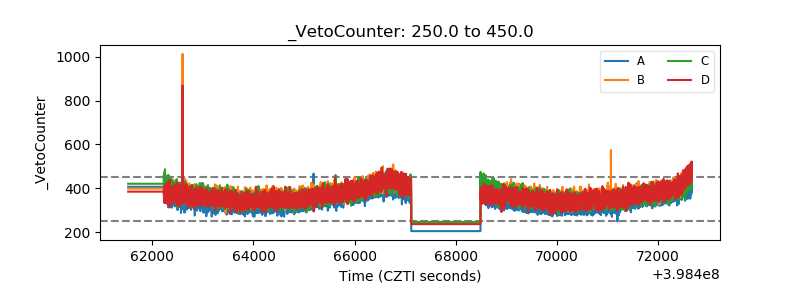 |