| Param | Original file | Final file |
|---|---|---|
| Filename | modeM0/AS1A10_123T11_9000005286_37240cztM0_level2.evt | modeM0/AS1A10_123T11_9000005286_37240cztM0_level2_quad_clean.evt |
| Size (bytes) | 641,174,400 | 80,971,200 |
| Size | 611.5 MB | 77.2 MB |
| Events in quadrant A | 4,967,853 | 480,565 |
| Events in quadrant B | 4,426,010 | 511,064 |
| Events in quadrant C | 3,798,856 | 512,877 |
| Events in quadrant D | 5,762,276 | 470,080 |
| Mode M0 | |||
|---|---|---|---|
| Quadrant | BADHDUFLAG | Total packets | Discarded packets |
| A | 0 | 19266 | 3 |
| B | 0 | 17749 | 2 |
| C | 0 | 15516 | 2 |
| D | 0 | 21896 | 2 |
| Mode M9 | |||
|---|---|---|---|
| Quadrant | BADHDUFLAG | Total packets | Discarded packets |
| A | 0 | 31 | 0 |
| B | 0 | 31 | 0 |
| C | 0 | 31 | 0 |
| D | 0 | 31 | 0 |
| Mode SS | |||
|---|---|---|---|
| Quadrant | BADHDUFLAG | Total packets | Discarded packets |
| A | 0 | 140 | 0 |
| B | 0 | 140 | 0 |
| C | 0 | 140 | 0 |
| D | 0 | 140 | 0 |
| Quadrant | Total seconds | Saturated seconds | Saturation percentage |
|---|---|---|---|
| A | 6849 | 459 | 6.701708% |
| B | 6849 | 182 | 2.657322% |
| C | 6849 | 65 | 0.949044% |
| D | 6849 | 550 | 8.030369% |
Noise dominated data is calculated using 1-second bins in cleaned event files. If a bin has >2000 counts, and if more than 50% of those come from <1% of pixels, then it is considered to be noise-dominated and hence unusable.
| Quadrant | # 1 sec bins | Bins with >0 counts | Bins with >2000 counts | High rate bins dominated by noise | Noise dominated (total time) | Noise dominated (detector-on time) | Marked lightcurve |
|---|---|---|---|---|---|---|---|
| A | 9896 | 6851 | 278 | 278 | 2.81% | 4.06% | 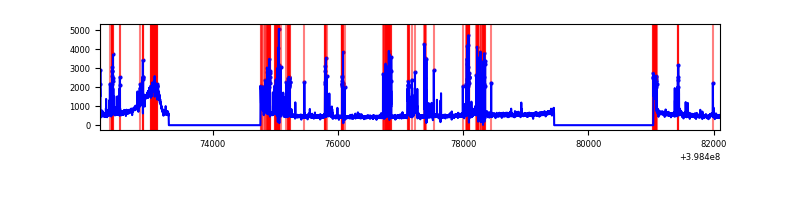 |
| B | 9896 | 6851 | 83 | 83 | 0.84% | 1.21% | 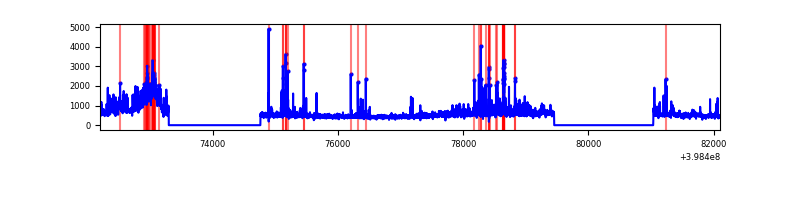 |
| C | 9896 | 6851 | 45 | 45 | 0.45% | 0.66% | 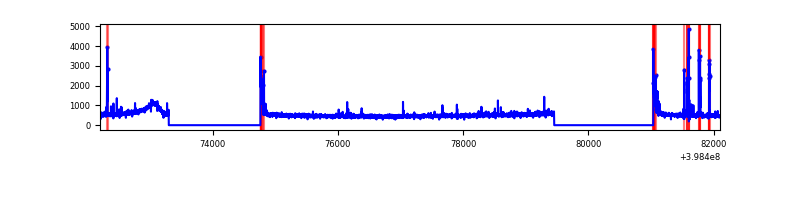 |
| D | 9896 | 6850 | 429 | 429 | 4.34% | 6.26% | 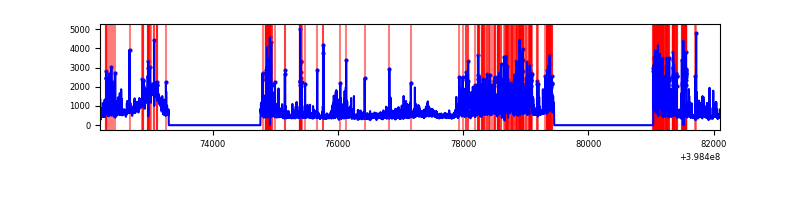 |
Top three noisy pixels from each quadrant. If the there are fewer than three noisy pixels in the level2.evt file, extra rows are filled as -1
| Pixel properties | Quadrant properties | ||||||
|---|---|---|---|---|---|---|---|
| Quadrant | DetID | PixID | Counts | Sigma | Mean | Median | Sigma |
| A | 15 | 237 | 1033444 | 5384.4 | 909 | 894 | 191.8 |
| A | 10 | 83 | 317983 | 1653.51 | 909 | 894 | 191.8 |
| A | 13 | 248 | 50777 | 260.12 | 909 | 894 | 191.8 |
| B | 0 | 190 | 285297 | 1716.47 | 860 | 839 | 165.7 |
| B | 5 | 172 | 191415 | 1149.97 | 860 | 839 | 165.7 |
| B | 0 | 155 | 166019 | 996.73 | 860 | 839 | 165.7 |
| C | 15 | 214 | 291834 | 1498.45 | 821 | 829 | 194.2 |
| C | 0 | 10 | 141958 | 726.71 | 821 | 829 | 194.2 |
| C | 14 | 254 | 110093 | 562.63 | 821 | 829 | 194.2 |
| D | 2 | 249 | 834453 | 3888.93 | 853 | 831 | 214.4 |
| D | 10 | 253 | 462929 | 2155.73 | 853 | 831 | 214.4 |
| D | 12 | 235 | 145852 | 676.54 | 853 | 831 | 214.4 |
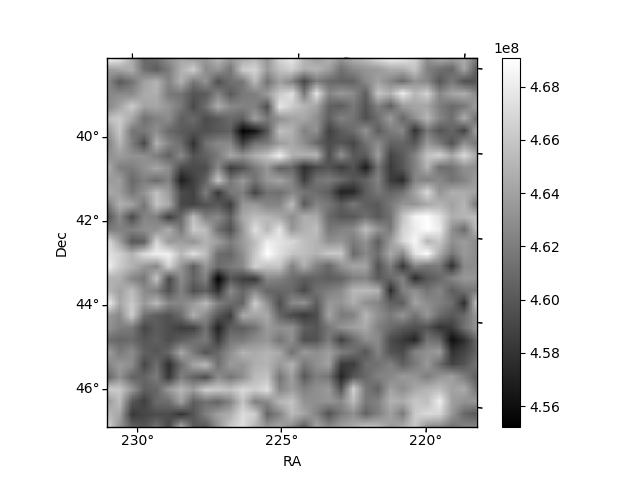
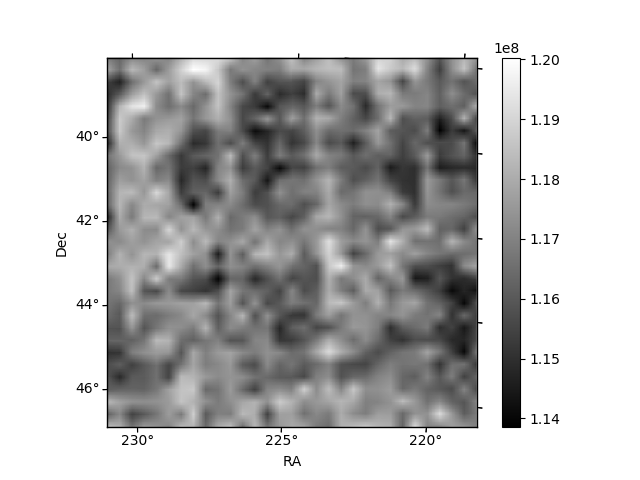
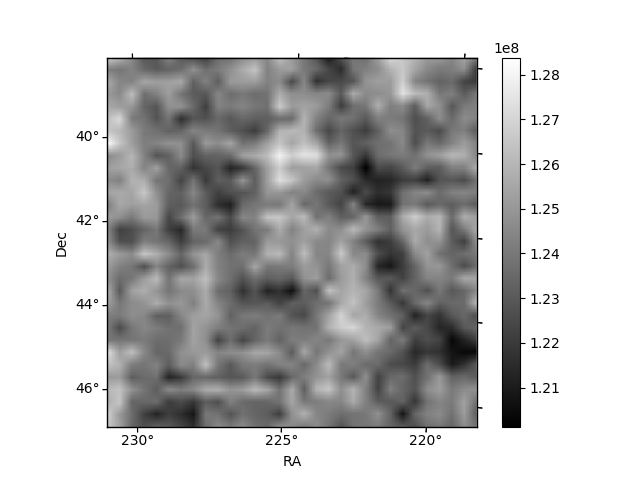
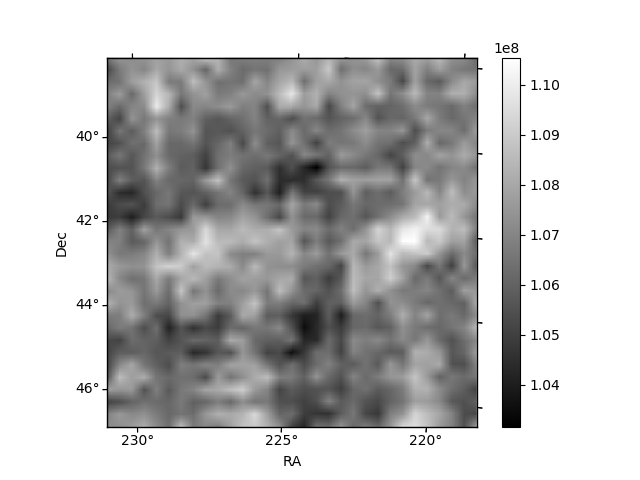
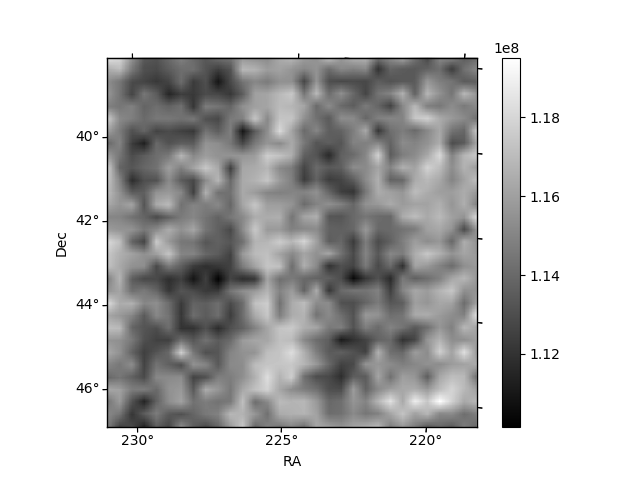
Histogram calculated using DETX and DETY for each event in the final _common_clean file
| Quadrant A | 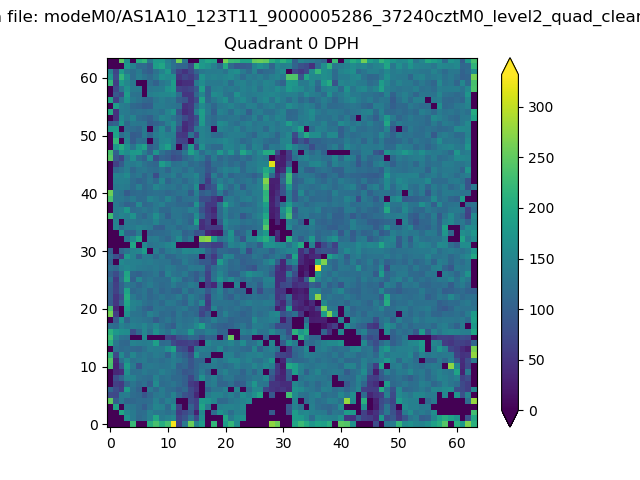 |
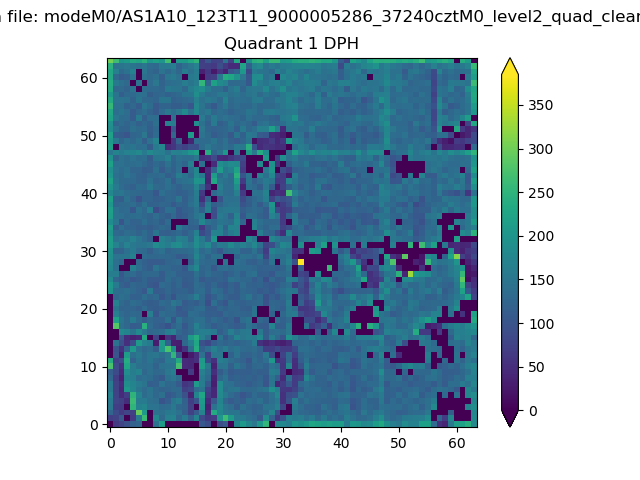 |
Quadrant B |
|---|---|---|---|
| Quadrant D | 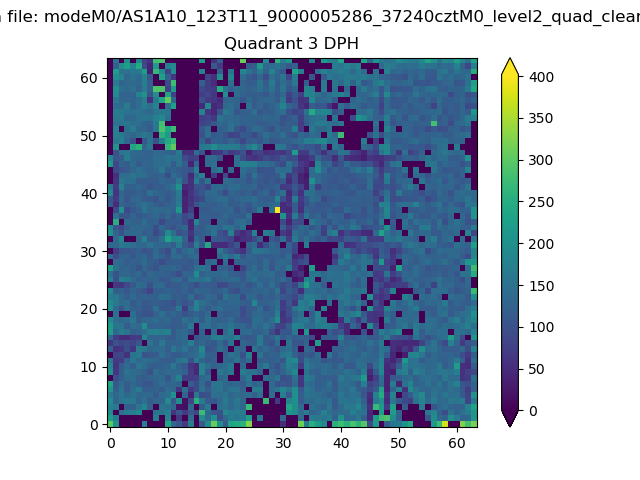 |
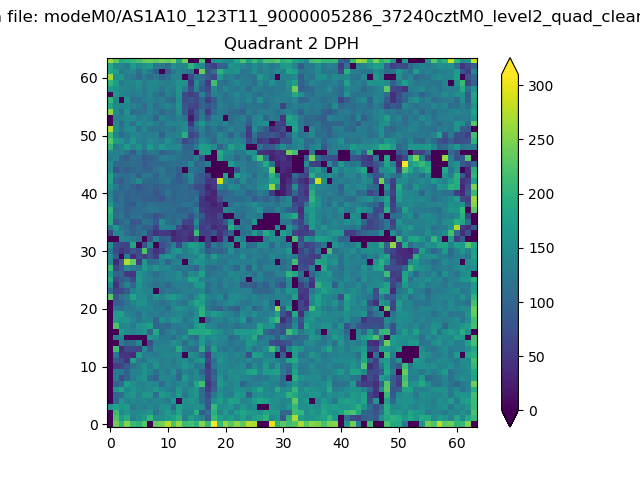 |
Quadrant C |
| Plot type | Count rate plots | Images |
|---|---|---|
| Comparison with Poisson distribution Blue bars denote a histogram of data divided into 1 sec bins. Red curve is a Poisson curve with rate = median count rate of data. |
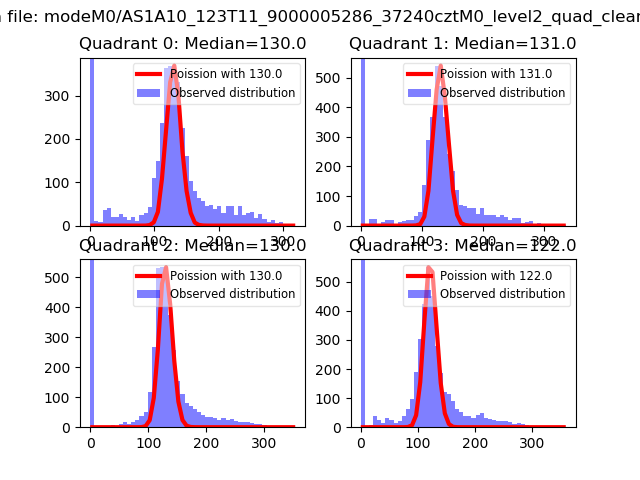 |
 |
| Quadrant-wise count rates Data is divided into 100 sec bins |
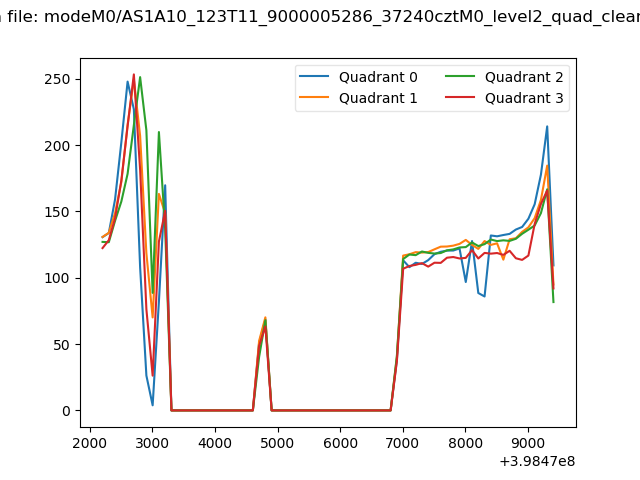 |
|
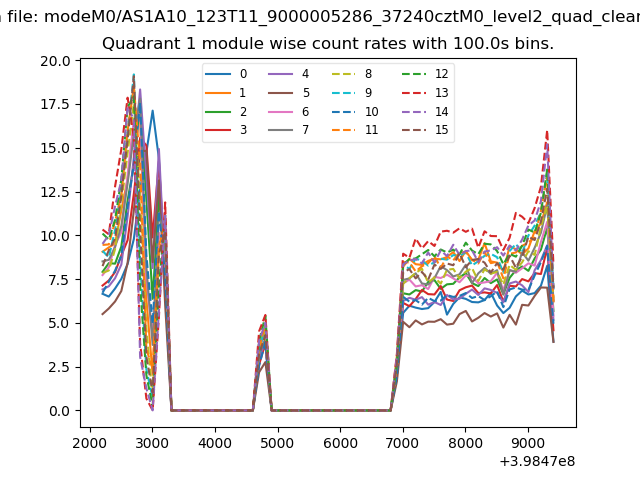
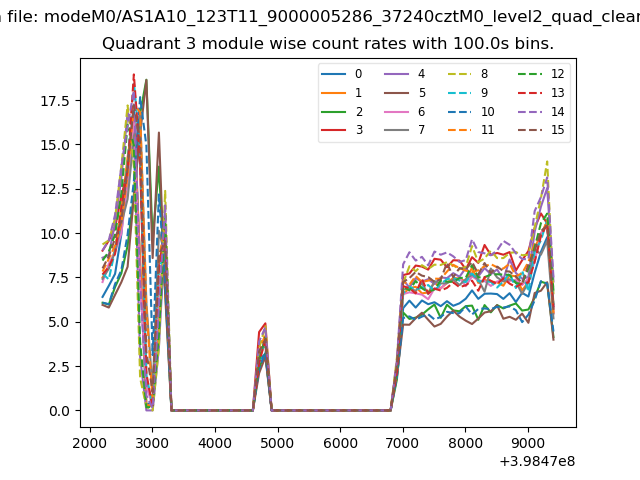
| Module-wise count rates for Quadrant A Data is divided into 100 sec bins |
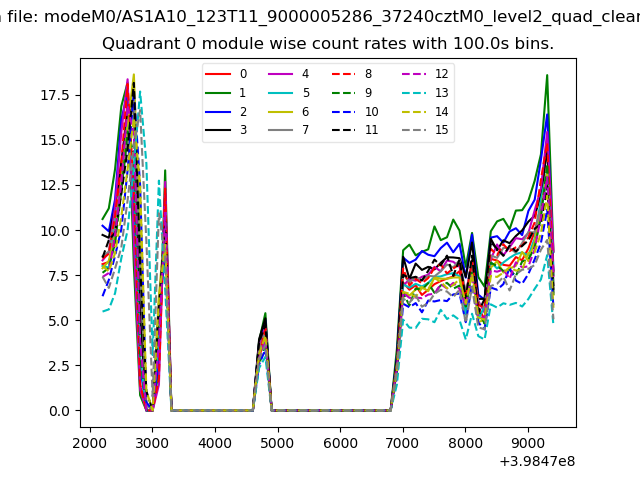 |
 |
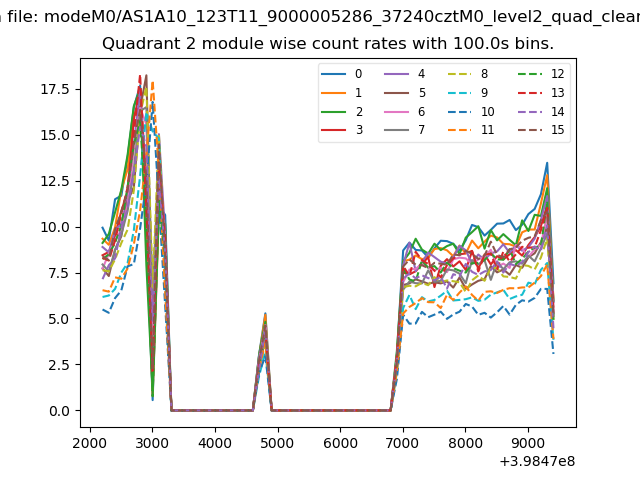
| Module-wise count rates for Quadrant B Data is divided into 100 sec bins |
 |
 |
| Module-wise count rates for Quadrant C Data is divided into 100 sec bins |
 |
 |
| Module-wise count rates for Quadrant D Data is divided into 100 sec bins |
 |
 |
| Parameter | Plot |
|---|---|
| CZT HV Monitor | 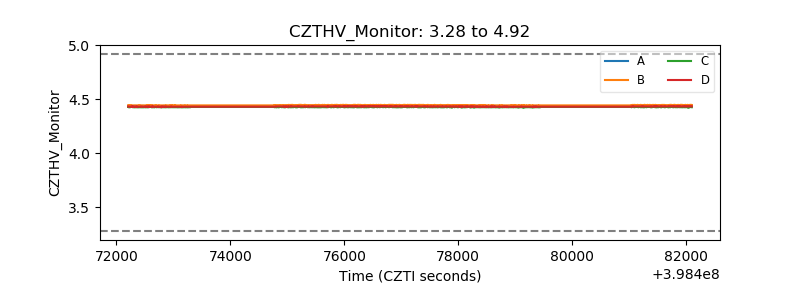 |
| D_VDD | 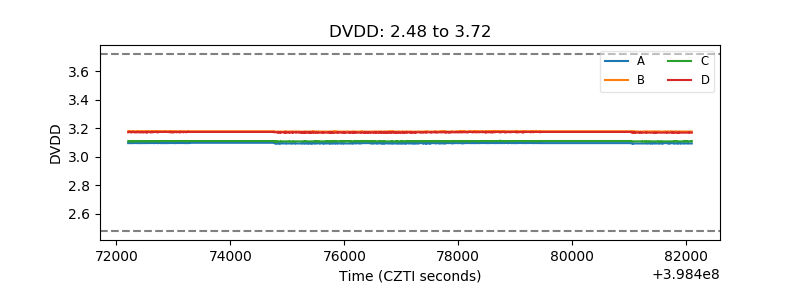 |
| Temperature 1 | 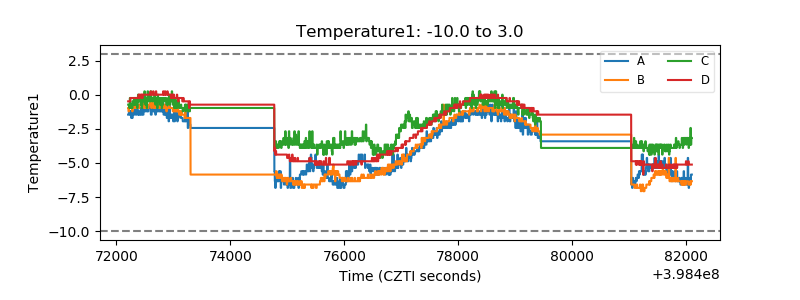 |
| Veto HV Monitor | 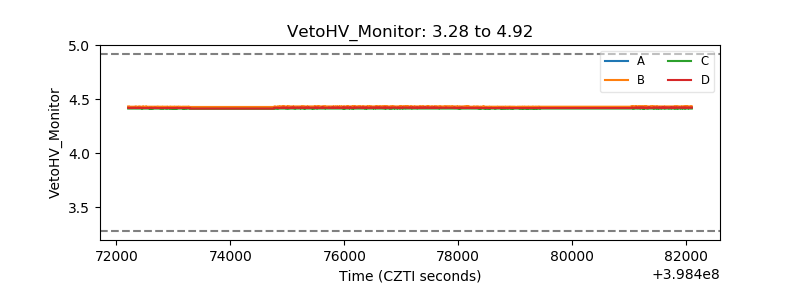 |
| Veto LLD |  |
| Alpha Counter | 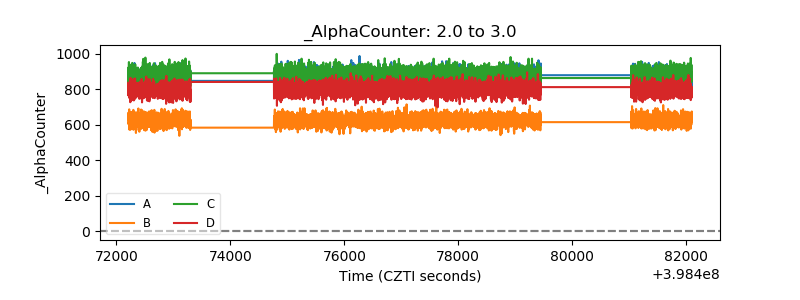 |
| _CPM_Rate | 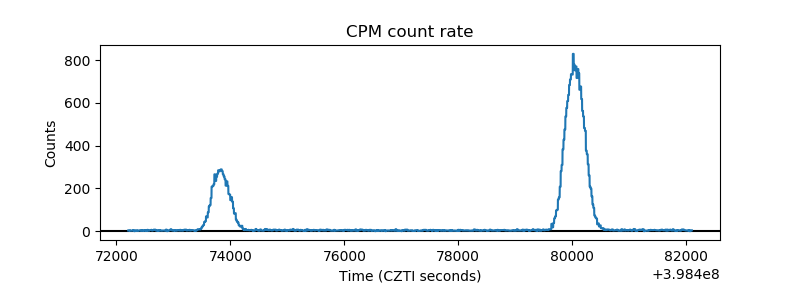 |
| CZT Counter | 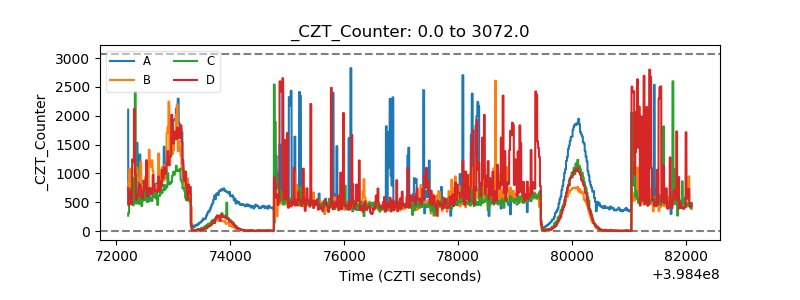 |
| +2.5 Volts monitor | 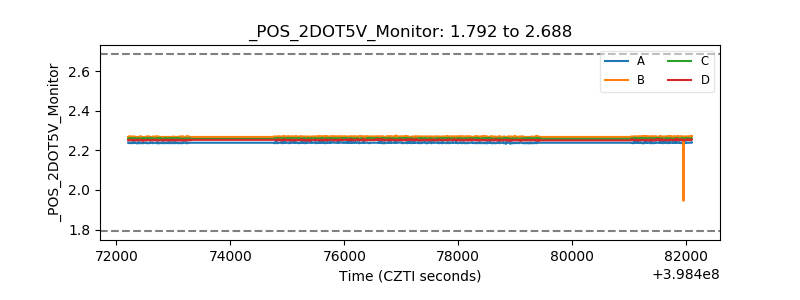 |
| +5 Volts monitor | 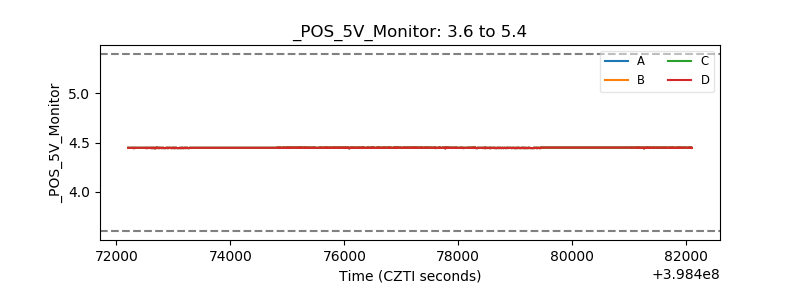 |
| _ROLL_ROT | 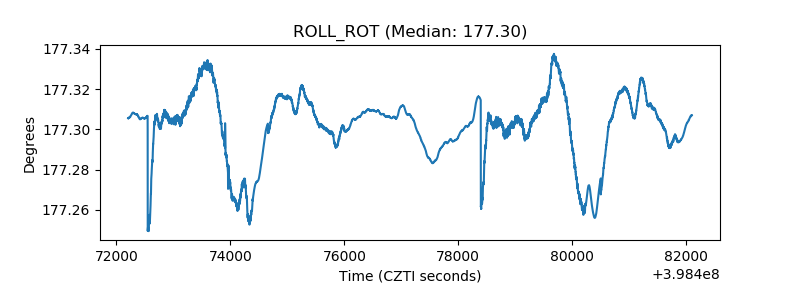 |
| _Roll_DEC | 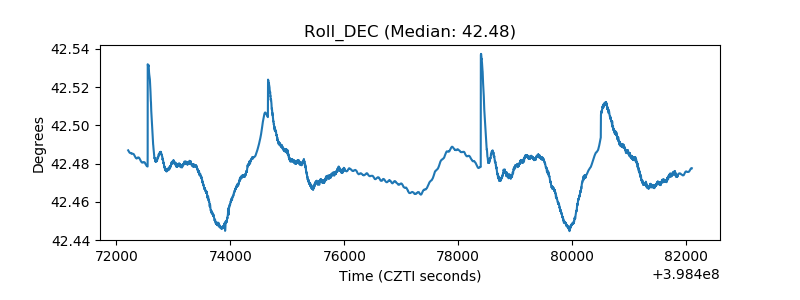 |
| _Roll_RA | 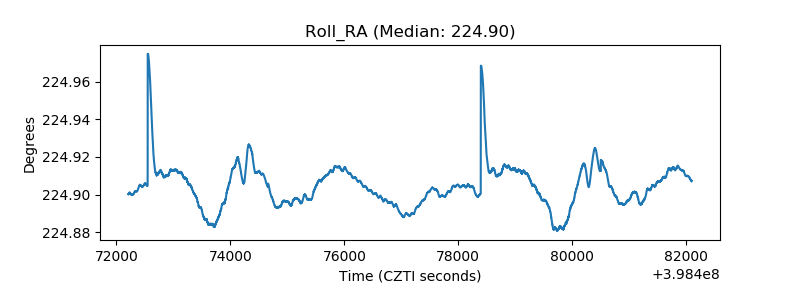 |
| Veto Counter | 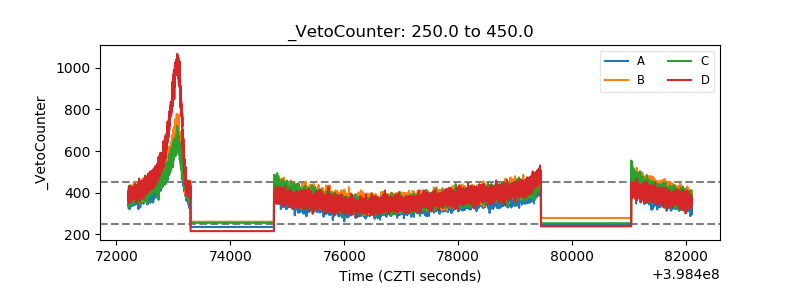 |