| Param | Original file | Final file |
|---|---|---|
| Filename | modeM0/AS1A10_123T11_9000005286_37241cztM0_level2.evt | modeM0/AS1A10_123T11_9000005286_37241cztM0_level2_quad_clean.evt |
| Size (bytes) | 469,103,040 | 57,666,240 |
| Size | 447.4 MB | 55.0 MB |
| Events in quadrant A | 3,815,011 | 337,319 |
| Events in quadrant B | 3,186,958 | 350,563 |
| Events in quadrant C | 2,844,829 | 347,432 |
| Events in quadrant D | 3,987,571 | 326,484 |
| Mode M0 | |||
|---|---|---|---|
| Quadrant | BADHDUFLAG | Total packets | Discarded packets |
| A | 0 | 14748 | 3 |
| B | 0 | 13004 | 2 |
| C | 0 | 11709 | 2 |
| D | 0 | 15574 | 2 |
| Mode M9 | |||
|---|---|---|---|
| Quadrant | BADHDUFLAG | Total packets | Discarded packets |
| A | 0 | 17 | 0 |
| B | 0 | 17 | 0 |
| C | 0 | 17 | 0 |
| D | 0 | 17 | 0 |
| Mode SS | |||
|---|---|---|---|
| Quadrant | BADHDUFLAG | Total packets | Discarded packets |
| A | 0 | 112 | 0 |
| B | 0 | 112 | 0 |
| C | 0 | 112 | 0 |
| D | 0 | 112 | 0 |
| Quadrant | Total seconds | Saturated seconds | Saturation percentage |
|---|---|---|---|
| A | 5484 | 442 | 8.059810% |
| B | 5484 | 68 | 1.239971% |
| C | 5484 | 49 | 0.893508% |
| D | 5484 | 387 | 7.056893% |
Noise dominated data is calculated using 1-second bins in cleaned event files. If a bin has >2000 counts, and if more than 50% of those come from <1% of pixels, then it is considered to be noise-dominated and hence unusable.
| Quadrant | # 1 sec bins | Bins with >0 counts | Bins with >2000 counts | High rate bins dominated by noise | Noise dominated (total time) | Noise dominated (detector-on time) | Marked lightcurve |
|---|---|---|---|---|---|---|---|
| A | 7186 | 5485 | 337 | 337 | 4.69% | 6.14% | 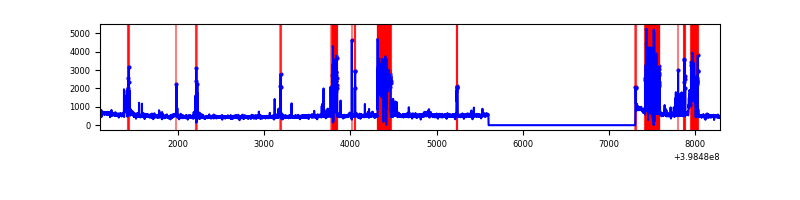 |
| B | 7186 | 5485 | 40 | 40 | 0.56% | 0.73% | 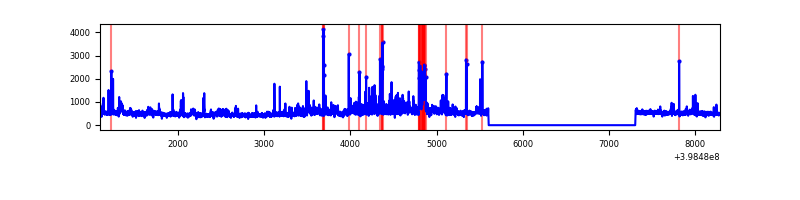 |
| C | 7186 | 5485 | 36 | 36 | 0.50% | 0.66% | 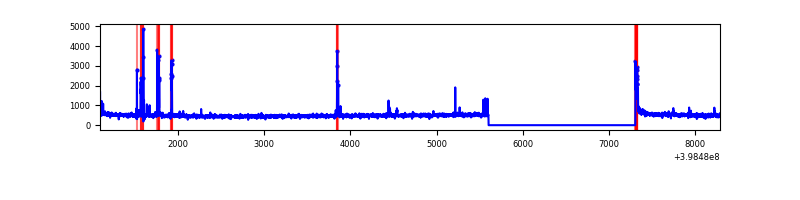 |
| D | 7186 | 5485 | 307 | 307 | 4.27% | 5.60% | 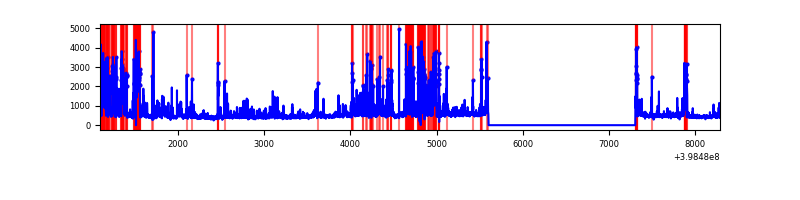 |
Top three noisy pixels from each quadrant. If the there are fewer than three noisy pixels in the level2.evt file, extra rows are filled as -1
| Pixel properties | Quadrant properties | ||||||
|---|---|---|---|---|---|---|---|
| Quadrant | DetID | PixID | Counts | Sigma | Mean | Median | Sigma |
| A | 15 | 237 | 778697 | 6212.23 | 609 | 597 | 125.3 |
| A | 9 | 143 | 400774 | 3194.95 | 609 | 597 | 125.3 |
| A | 10 | 83 | 242314 | 1929.83 | 609 | 597 | 125.3 |
| B | 0 | 190 | 156787 | 1283.14 | 633 | 615 | 121.7 |
| B | 0 | 155 | 149898 | 1226.54 | 633 | 615 | 121.7 |
| B | 5 | 172 | 125232 | 1023.88 | 633 | 615 | 121.7 |
| C | 15 | 214 | 230043 | 1588.14 | 617 | 622 | 144.5 |
| C | 14 | 254 | 101563 | 698.75 | 617 | 622 | 144.5 |
| C | 0 | 10 | 76955 | 528.41 | 617 | 622 | 144.5 |
| D | 2 | 249 | 830734 | 5569.57 | 602 | 585 | 149.1 |
| D | 10 | 253 | 369486 | 2475.0 | 602 | 585 | 149.1 |
| D | 13 | 249 | 100296 | 668.97 | 602 | 585 | 149.1 |
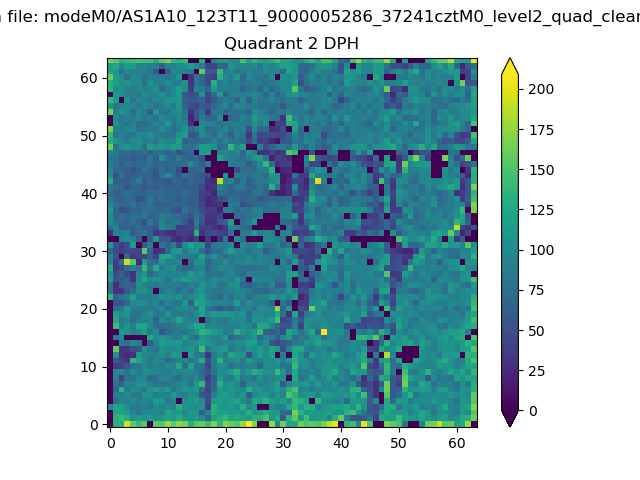
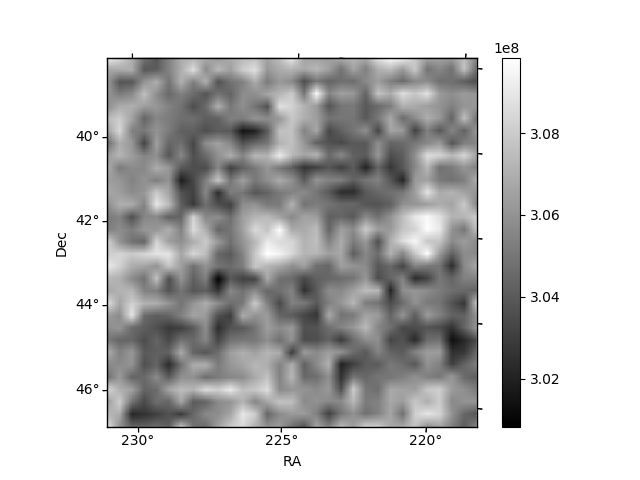
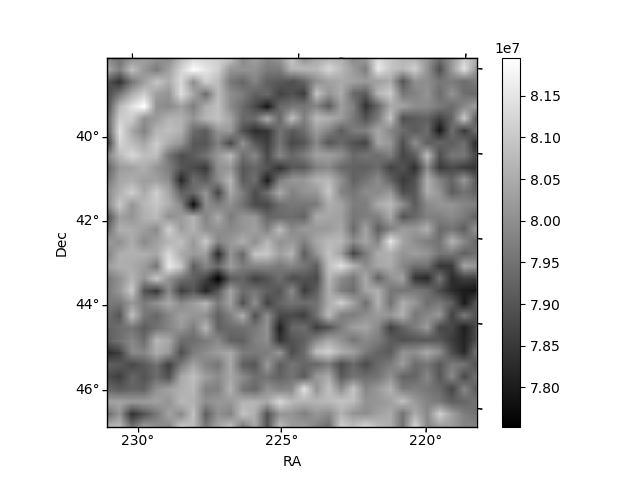
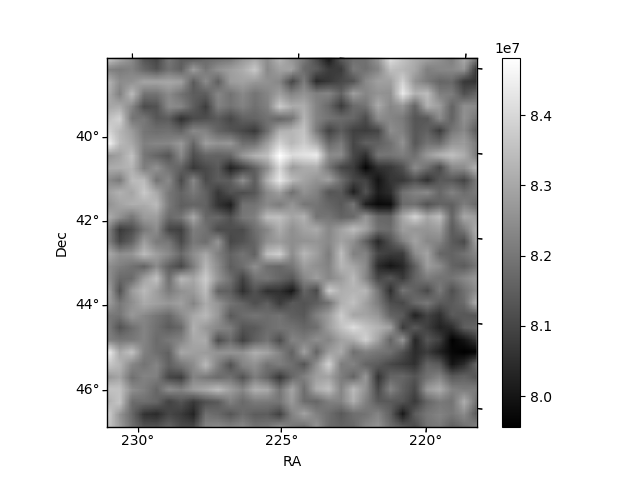
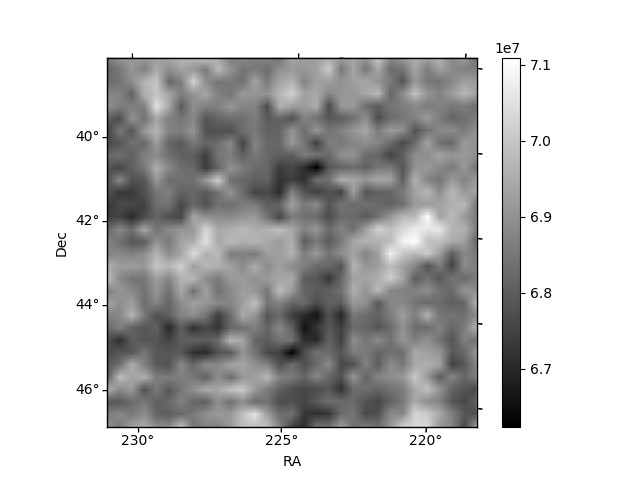
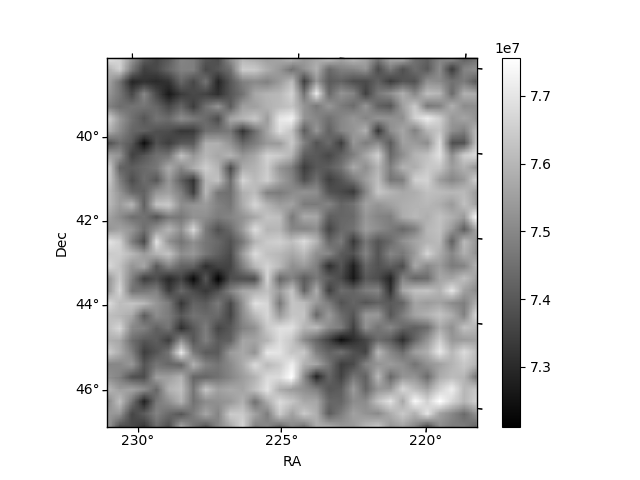
Histogram calculated using DETX and DETY for each event in the final _common_clean file
| Quadrant A | 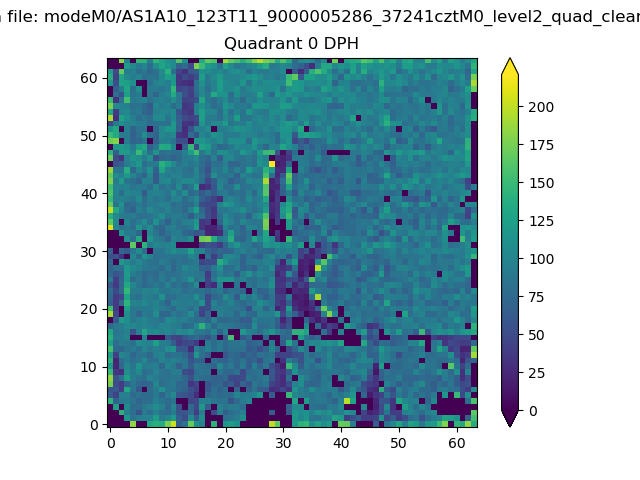 |
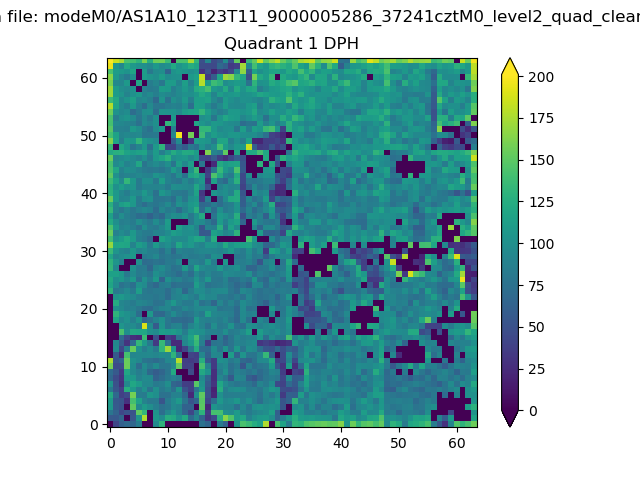 |
Quadrant B |
|---|---|---|---|
| Quadrant D | 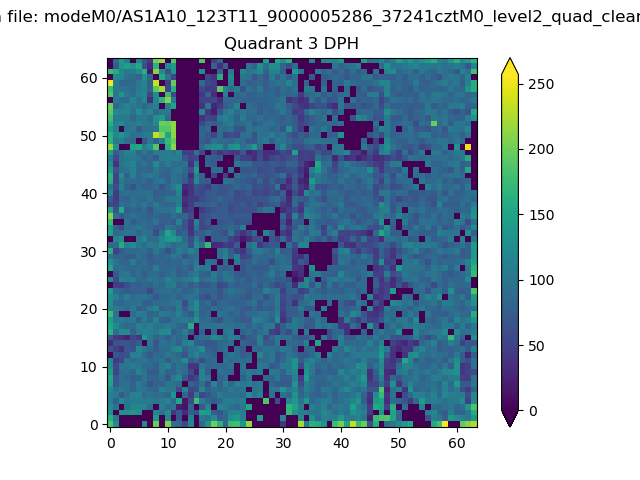 |
 |
Quadrant C |
| Plot type | Count rate plots | Images |
|---|---|---|
| Comparison with Poisson distribution Blue bars denote a histogram of data divided into 1 sec bins. Red curve is a Poisson curve with rate = median count rate of data. |
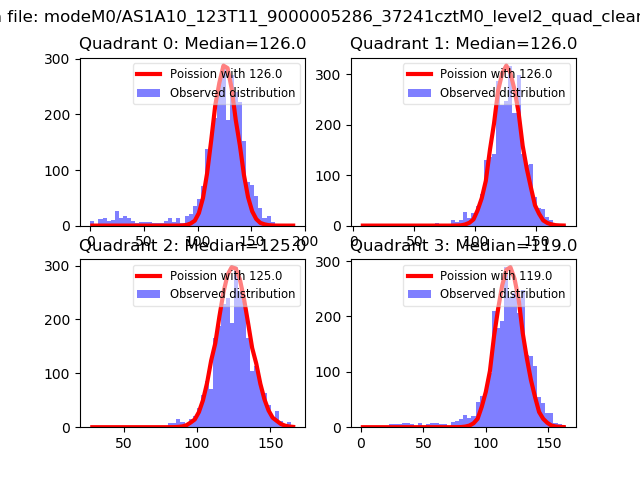 |
 |
| Quadrant-wise count rates Data is divided into 100 sec bins |
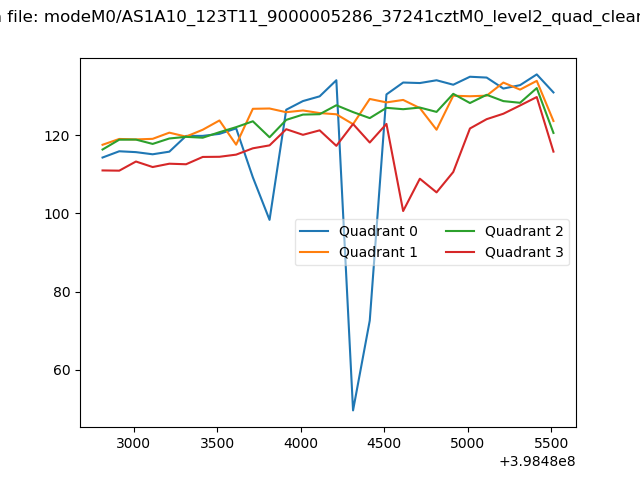 |
|
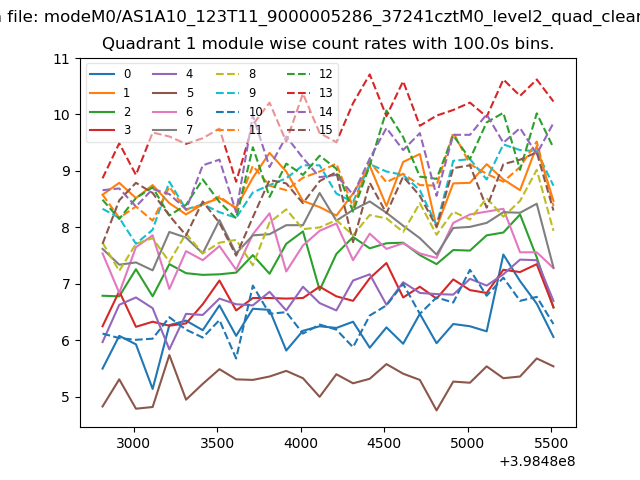
| Module-wise count rates for Quadrant A Data is divided into 100 sec bins |
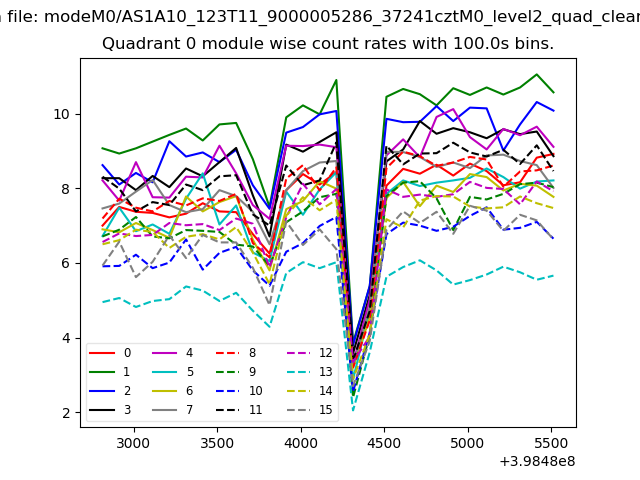 |
 |
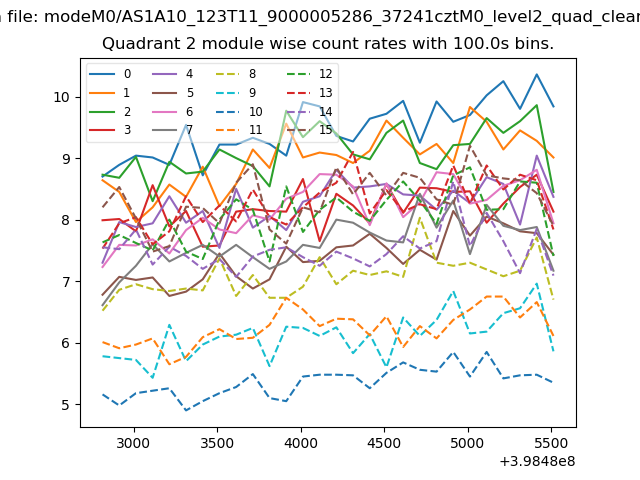
| Module-wise count rates for Quadrant B Data is divided into 100 sec bins |
 |
 |
| Module-wise count rates for Quadrant C Data is divided into 100 sec bins |
 |
 |
| Module-wise count rates for Quadrant D Data is divided into 100 sec bins |
 |
 |
| Parameter | Plot |
|---|---|
| CZT HV Monitor | 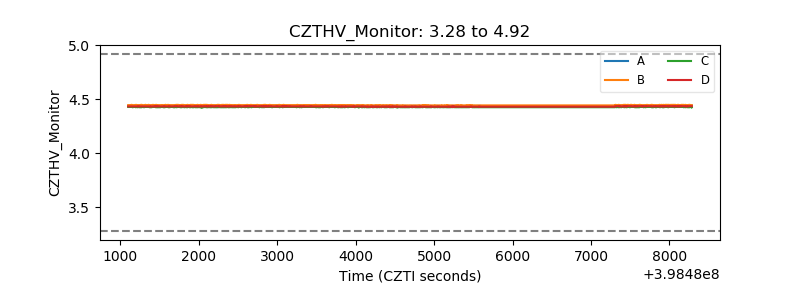 |
| D_VDD | 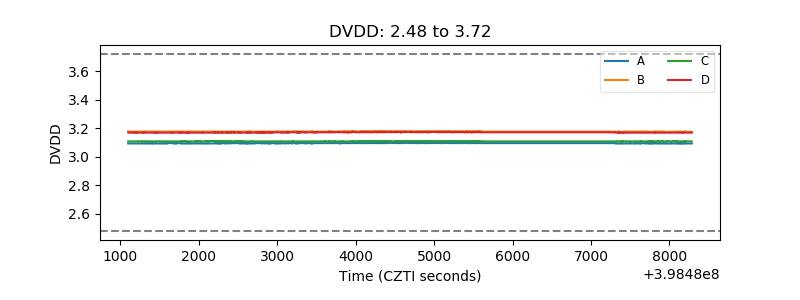 |
| Temperature 1 | 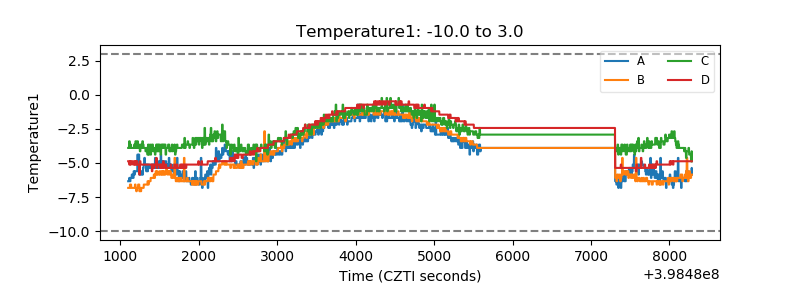 |
| Veto HV Monitor | 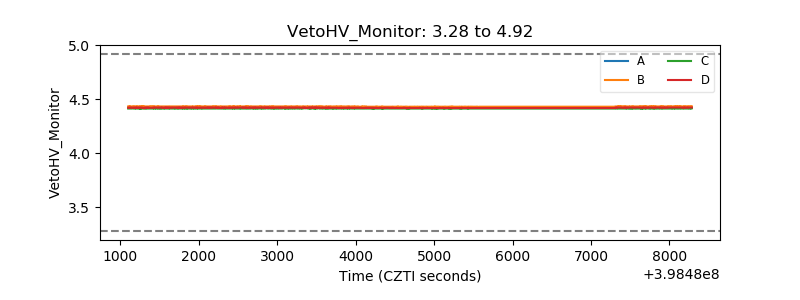 |
| Veto LLD | 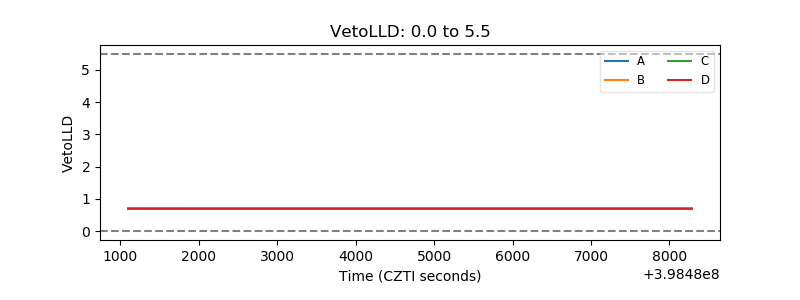 |
| Alpha Counter | 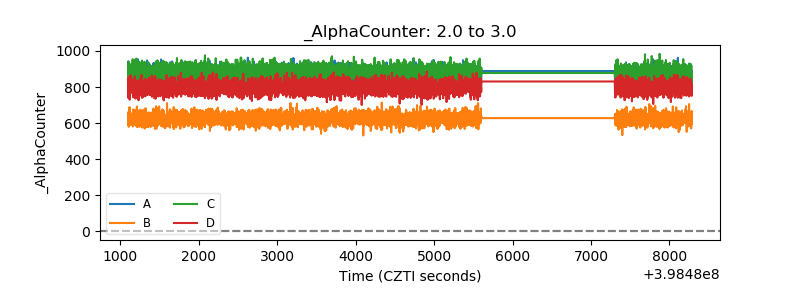 |
| _CPM_Rate | 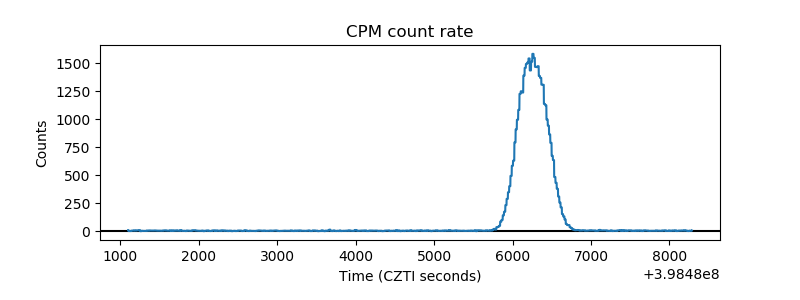 |
| CZT Counter | 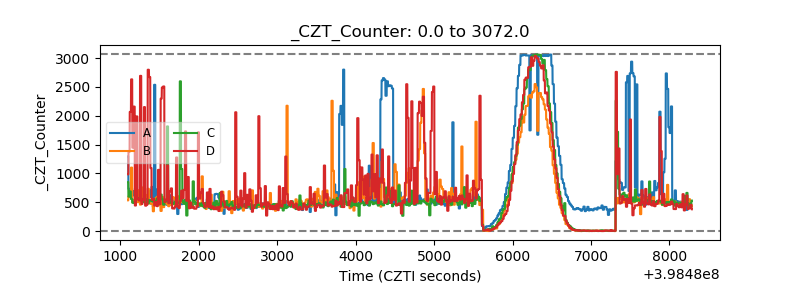 |
| +2.5 Volts monitor | 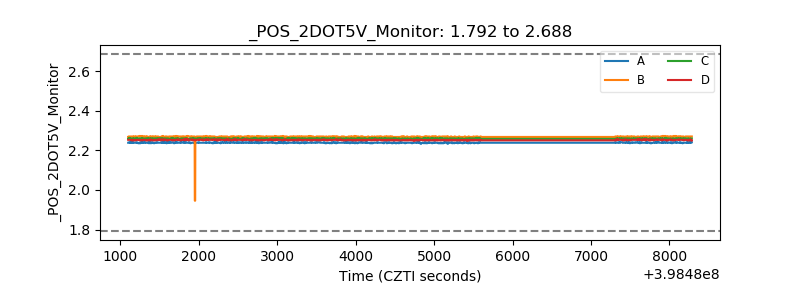 |
| +5 Volts monitor | 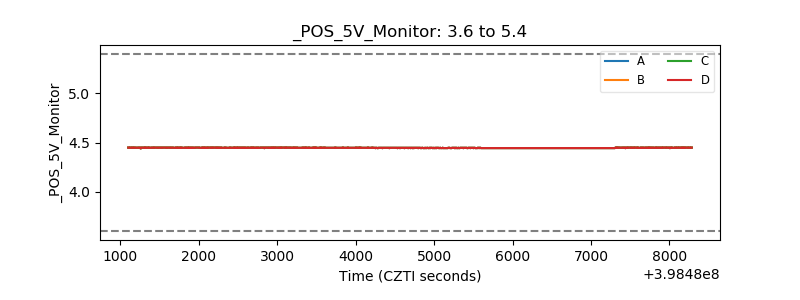 |
| _ROLL_ROT | 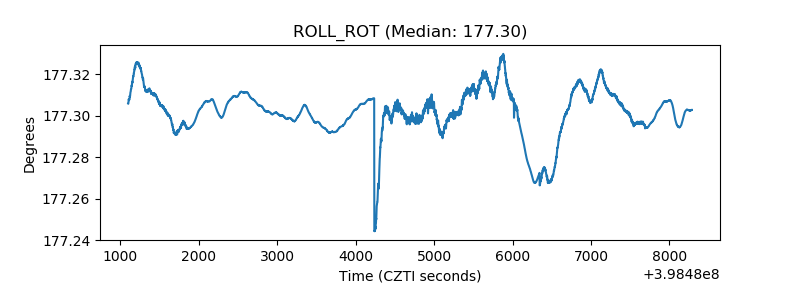 |
| _Roll_DEC | 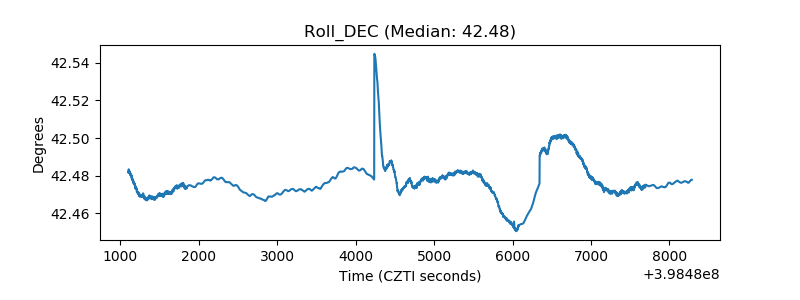 |
| _Roll_RA | 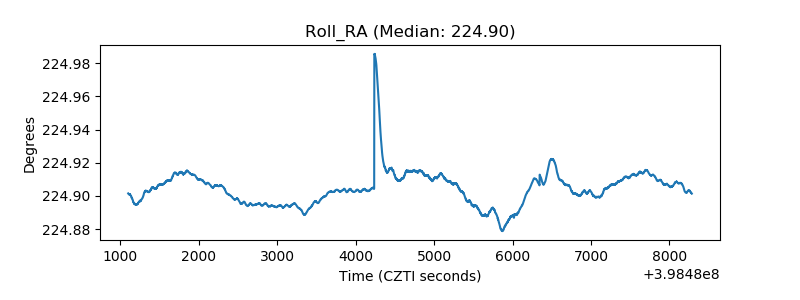 |
| Veto Counter | 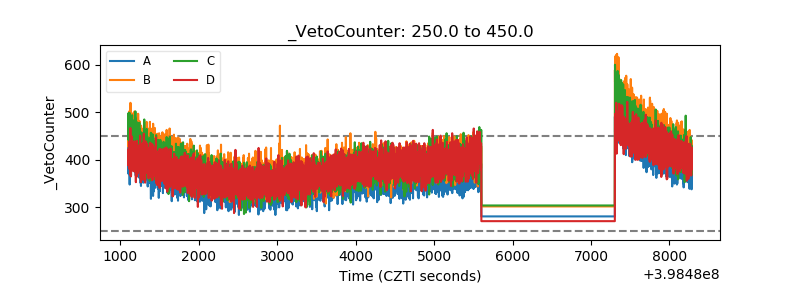 |