| Param | Original file | Final file |
|---|---|---|
| Filename | modeM0/AS1A10_123T11_9000005286_37244cztM0_level2.evt | modeM0/AS1A10_123T11_9000005286_37244cztM0_level2_quad_clean.evt |
| Size (bytes) | 188,602,560 | 39,945,600 |
| Size | 179.9 MB | 38.1 MB |
| Events in quadrant A | 1,558,836 | 263,207 |
| Events in quadrant B | 1,198,097 | 277,873 |
| Events in quadrant C | 1,211,359 | 265,849 |
| Events in quadrant D | 1,604,777 | 256,216 |
| Mode M0 | |||
|---|---|---|---|
| Quadrant | BADHDUFLAG | Total packets | Discarded packets |
| A | 0 | 5764 | 6 |
| B | 0 | 4842 | 5 |
| C | 0 | 4760 | 5 |
| D | 0 | 6222 | 23 |
| Mode M9 | |||
|---|---|---|---|
| Quadrant | BADHDUFLAG | Total packets | Discarded packets |
| A | 0 | 13 | 0 |
| B | 0 | 12 | 0 |
| C | 0 | 12 | 0 |
| D | 0 | 12 | 0 |
| Mode SS | |||
|---|---|---|---|
| Quadrant | BADHDUFLAG | Total packets | Discarded packets |
| A | 0 | 42 | 0 |
| B | 0 | 42 | 0 |
| C | 0 | 42 | 0 |
| D | 0 | 42 | 0 |
| Quadrant | Total seconds | Saturated seconds | Saturation percentage |
|---|---|---|---|
| A | 2014 | 232 | 11.519364% |
| B | 2013 | 6 | 0.298063% |
| C | 2014 | 30 | 1.489573% |
| D | 2010 | 71 | 3.532338% |
Noise dominated data is calculated using 1-second bins in cleaned event files. If a bin has >2000 counts, and if more than 50% of those come from <1% of pixels, then it is considered to be noise-dominated and hence unusable.
| Quadrant | # 1 sec bins | Bins with >0 counts | Bins with >2000 counts | High rate bins dominated by noise | Noise dominated (total time) | Noise dominated (detector-on time) | Marked lightcurve |
|---|---|---|---|---|---|---|---|
| A | 2016 | 2016 | 181 | 181 | 8.98% | 8.98% | 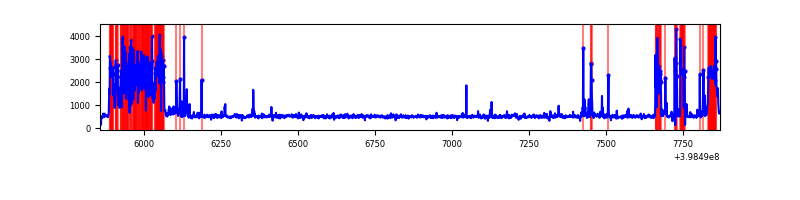 |
| B | 2013 | 2013 | 4 | 4 | 0.20% | 0.20% | 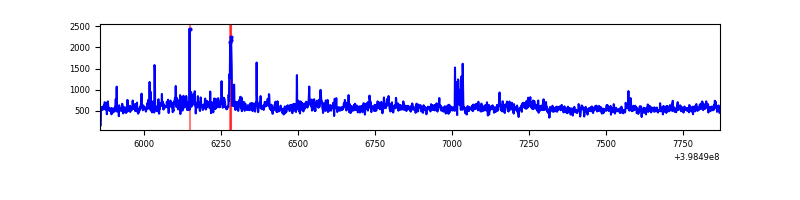 |
| C | 2016 | 2016 | 26 | 26 | 1.29% | 1.29% |  |
| D | 2015 | 2014 | 64 | 64 | 3.18% | 3.18% | 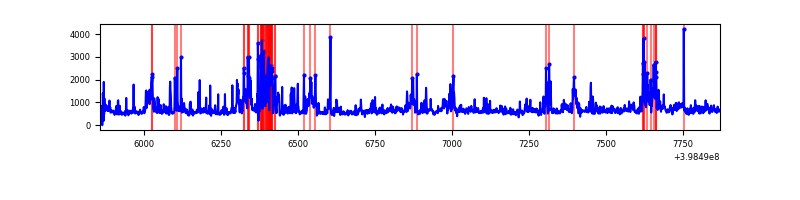 |
Top three noisy pixels from each quadrant. If the there are fewer than three noisy pixels in the level2.evt file, extra rows are filled as -1
| Pixel properties | Quadrant properties | ||||||
|---|---|---|---|---|---|---|---|
| Quadrant | DetID | PixID | Counts | Sigma | Mean | Median | Sigma |
| A | 15 | 237 | 546150 | 11330.48 | 232 | 228 | 48.2 |
| A | 10 | 83 | 62926 | 1301.27 | 232 | 228 | 48.2 |
| A | 13 | 248 | 33109 | 682.43 | 232 | 228 | 48.2 |
| B | 0 | 230 | 104629 | 2208.8 | 241 | 236 | 47.3 |
| B | 0 | 213 | 35036 | 736.32 | 241 | 236 | 47.3 |
| B | 0 | 155 | 33482 | 703.44 | 241 | 236 | 47.3 |
| C | 14 | 254 | 136627 | 2445.66 | 235 | 236 | 55.8 |
| C | 15 | 214 | 81602 | 1458.99 | 235 | 236 | 55.8 |
| C | 1 | 23 | 37381 | 666.06 | 235 | 236 | 55.8 |
| D | 2 | 249 | 280226 | 4832.81 | 235 | 229 | 57.9 |
| D | 12 | 235 | 102194 | 1759.94 | 235 | 229 | 57.9 |
| D | 1 | 52 | 97355 | 1676.42 | 235 | 229 | 57.9 |
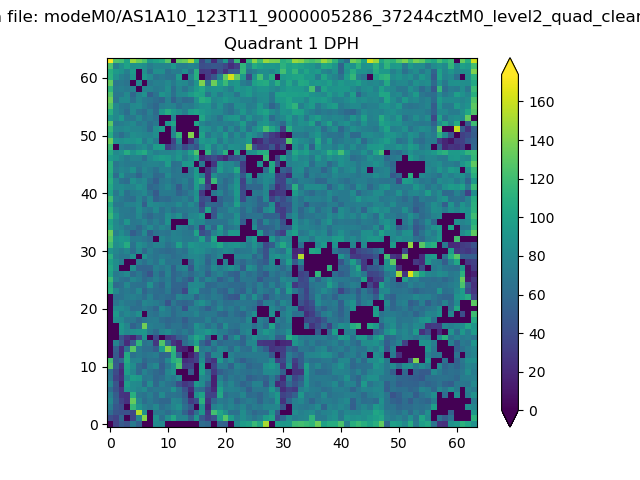
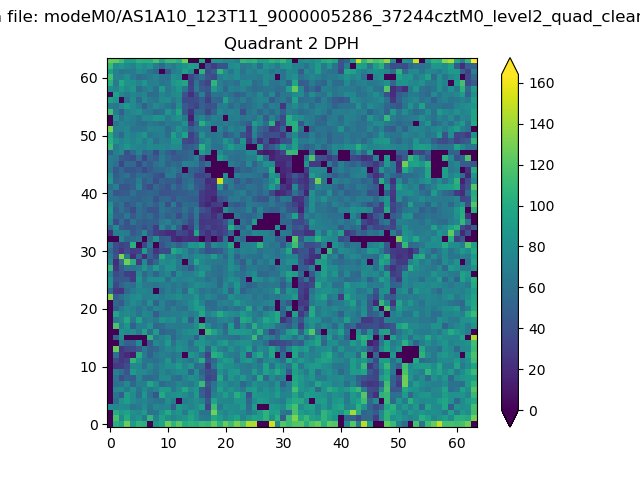
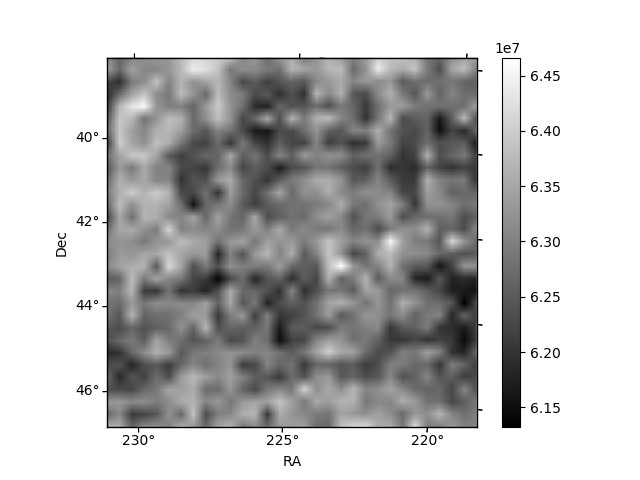
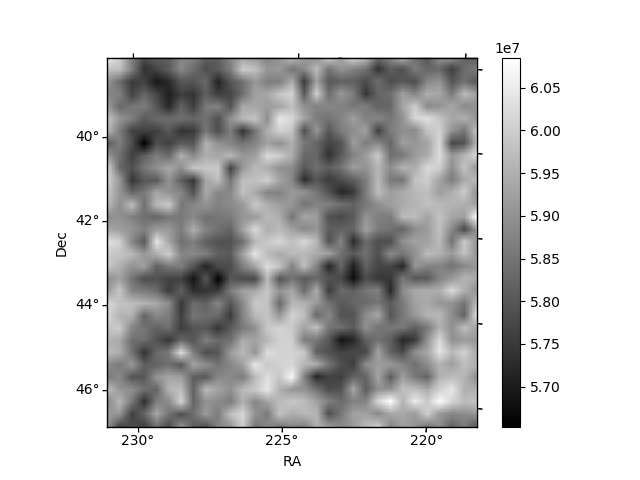
Histogram calculated using DETX and DETY for each event in the final _common_clean file
| Quadrant A | 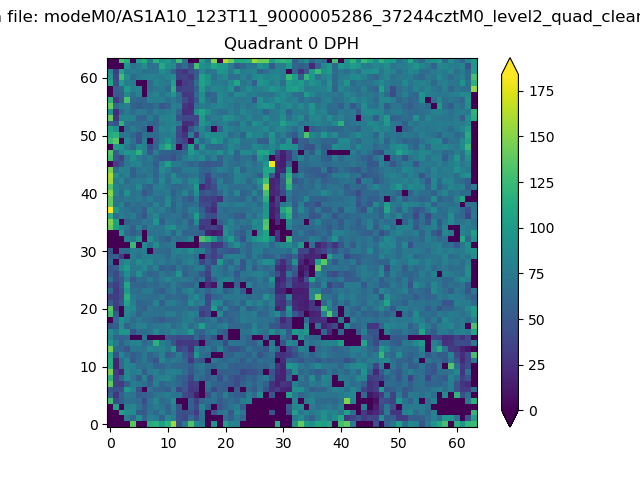 |
 |
Quadrant B |
|---|---|---|---|
| Quadrant D | 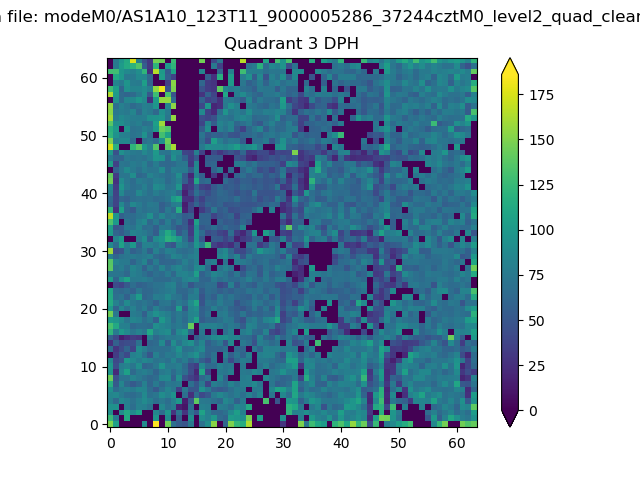 |
 |
Quadrant C |
| Plot type | Count rate plots | Images |
|---|---|---|
| Comparison with Poisson distribution Blue bars denote a histogram of data divided into 1 sec bins. Red curve is a Poisson curve with rate = median count rate of data. |
 |
 |
| Quadrant-wise count rates Data is divided into 100 sec bins |
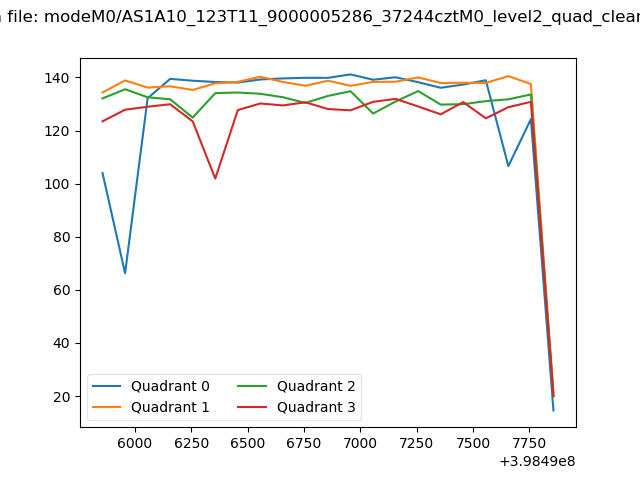 |
|
| Module-wise count rates for Quadrant A Data is divided into 100 sec bins |
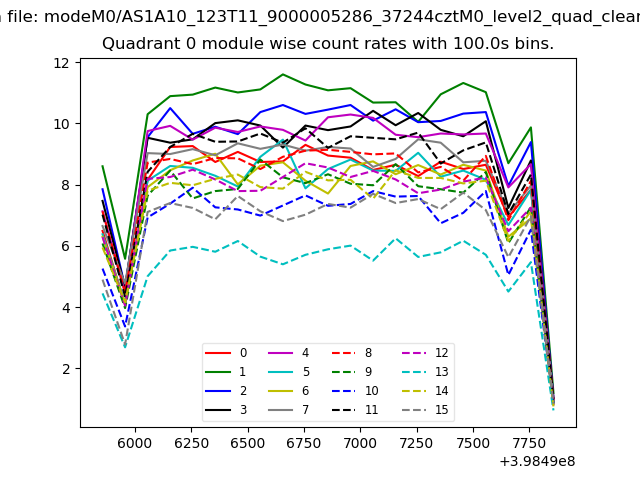 |
 |
| Module-wise count rates for Quadrant B Data is divided into 100 sec bins |
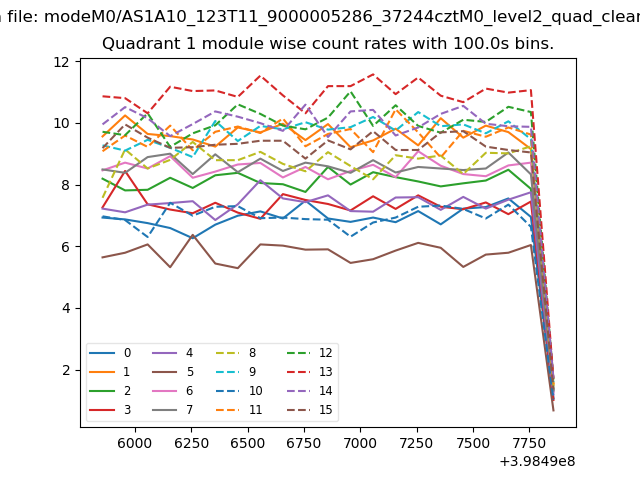 |
 |
| Module-wise count rates for Quadrant C Data is divided into 100 sec bins |
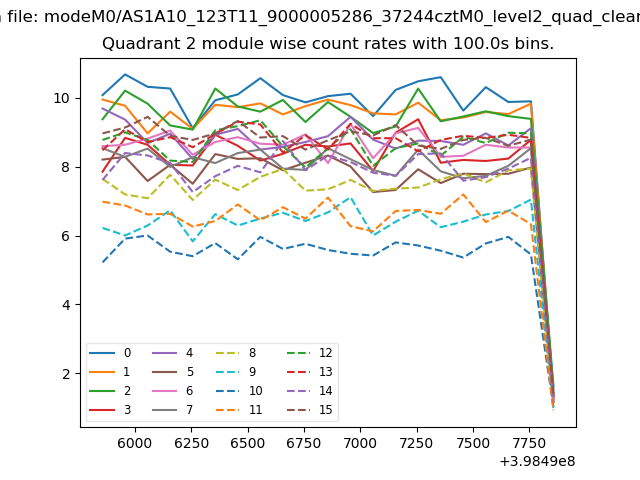 |
 |
| Module-wise count rates for Quadrant D Data is divided into 100 sec bins |
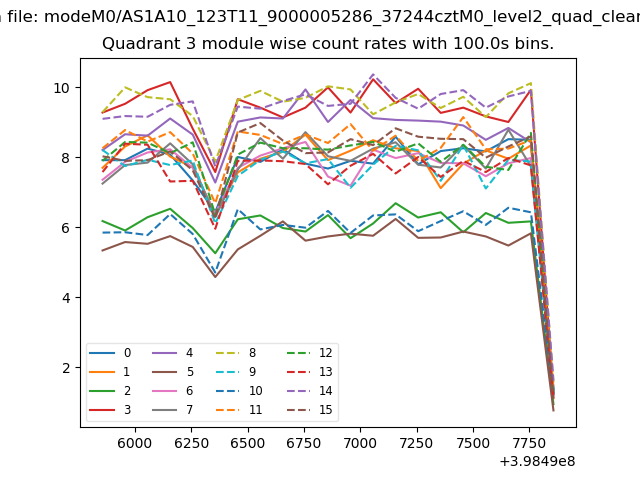 |
 |
| Parameter | Plot |
|---|---|
| CZT HV Monitor | 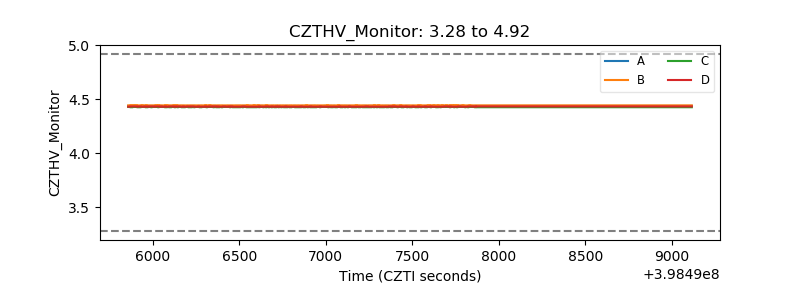 |
| D_VDD | 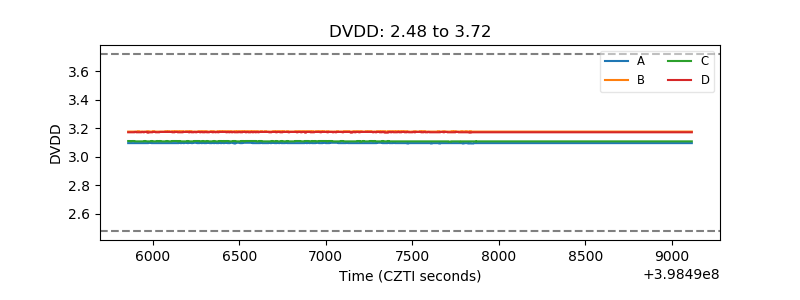 |
| Temperature 1 | 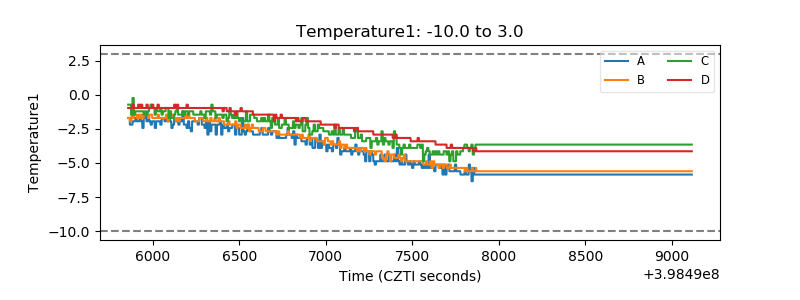 |
| Veto HV Monitor | 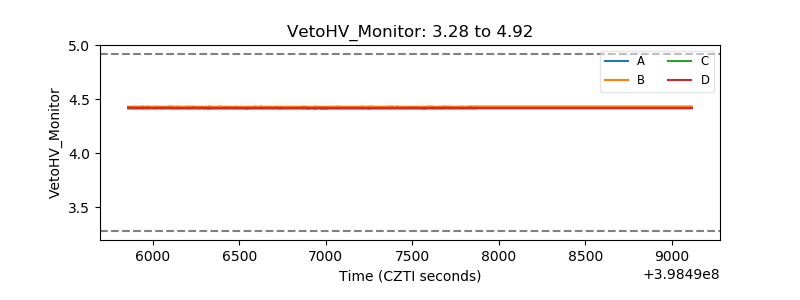 |
| Veto LLD | 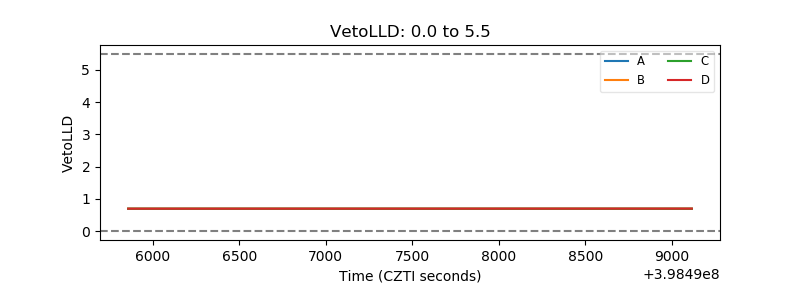 |
| Alpha Counter | 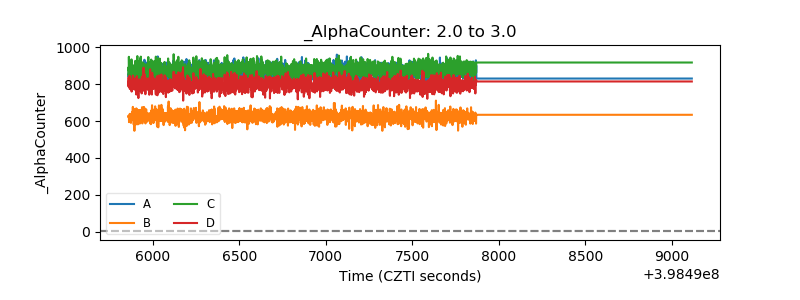 |
| _CPM_Rate | 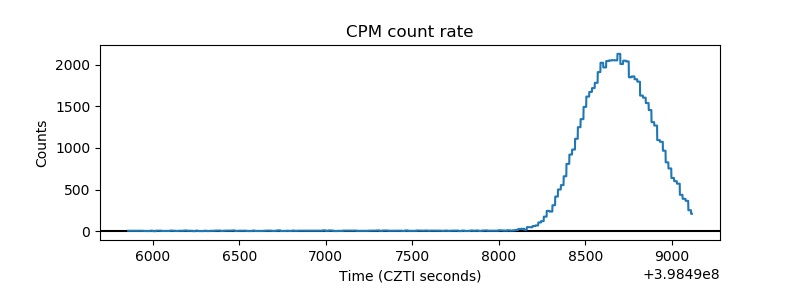 |
| CZT Counter | 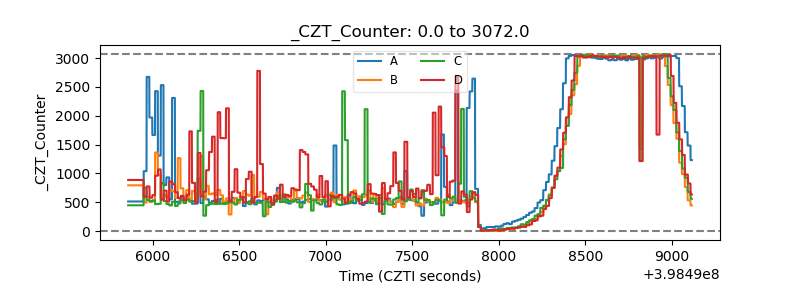 |
| +2.5 Volts monitor | 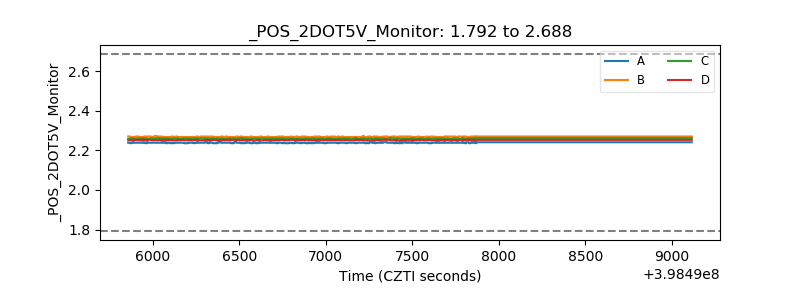 |
| +5 Volts monitor | 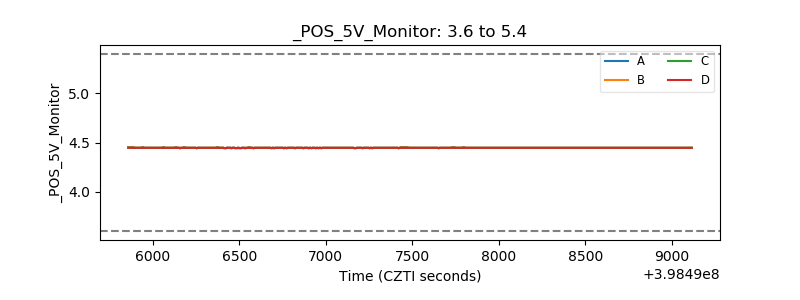 |
| _ROLL_ROT |  |
| _Roll_DEC | 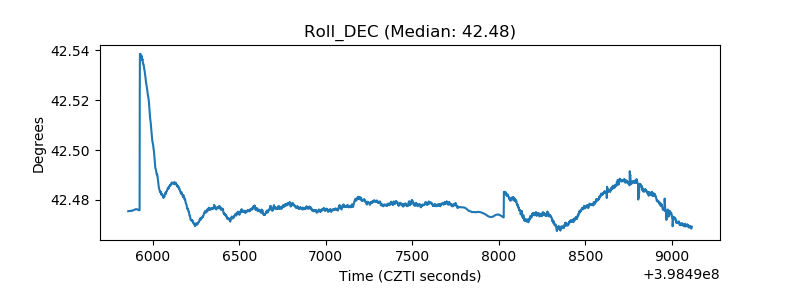 |
| _Roll_RA | 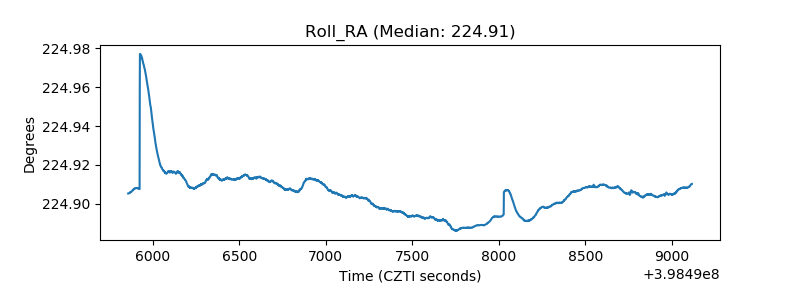 |
| Veto Counter | 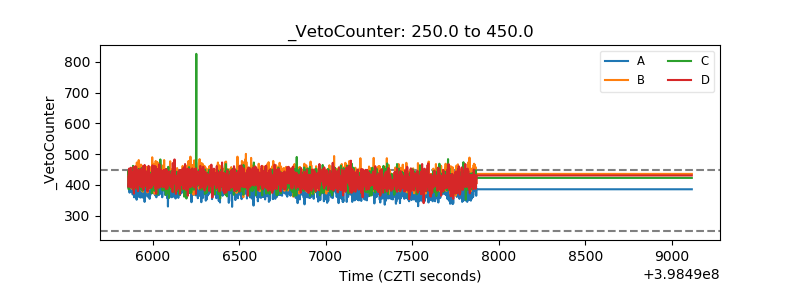 |