| Param | Original file | Final file |
|---|---|---|
| Filename | modeM0/AS1A10_094T04_9000005288cztM0_level2.fits | modeM0/AS1A10_094T04_9000005288cztM0_level2_quad_clean.evt |
| Size (bytes) | 29,753,280 | 27,195,840 |
| Size | 28.4 MB | 25.9 MB |
| Events in quadrant A | 173,290 | 143,028 |
| Events in quadrant B | 171,510 | 157,006 |
| Events in quadrant C | 170,992 | 150,974 |
| Events in quadrant D | 150,294 | 136,662 |
| Mode M9 | |||
|---|---|---|---|
| Quadrant | BADHDUFLAG | Total packets | Discarded packets |
| A | 0 | 19 | 0 |
| B | 0 | 19 | 0 |
| C | 0 | 19 | 0 |
| D | 0 | 19 | 0 |
| Mode SS | |||
|---|---|---|---|
| Quadrant | BADHDUFLAG | Total packets | Discarded packets |
| A | 0 | 70 | 0 |
| B | 0 | 70 | 0 |
| C | 0 | 70 | 0 |
| D | 0 | 70 | 0 |
| Mode M0 | |||
|---|---|---|---|
| Quadrant | BADHDUFLAG | Total packets | Discarded packets |
| A | 0 | 8475 | 0 |
| B | 0 | 7417 | 0 |
| C | 0 | 7512 | 0 |
| D | 0 | 9073 | 0 |
| Quadrant | Total seconds | Saturated seconds | Saturation percentage |
|---|---|---|---|
| A | 3304 | 178 | 5.387409% |
| B | 3304 | 12 | 0.363196% |
| C | 3304 | 45 | 1.361985% |
| D | 3304 | 141 | 4.267554% |
Noise dominated data is calculated using 1-second bins in cleaned event files. If a bin has >2000 counts, and if more than 50% of those come from <1% of pixels, then it is considered to be noise-dominated and hence unusable.
| Quadrant | # 1 sec bins | Bins with >0 counts | Bins with >2000 counts | High rate bins dominated by noise | Noise dominated (total time) | Noise dominated (detector-on time) | Marked lightcurve |
|---|---|---|---|---|---|---|---|
| A | 5277 | 3293 | 0 | 0 | 0.00% | 0.00% | 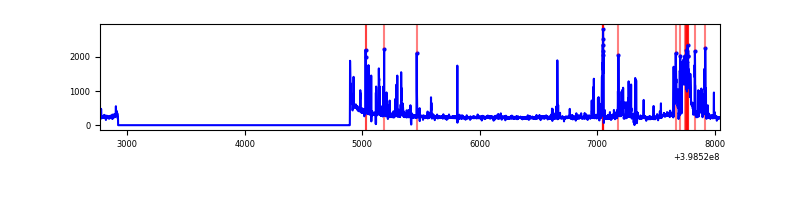 |
| B | 5277 | 3304 | 0 | 0 | 0.00% | 0.00% |  |
| C | 5277 | 3304 | 0 | 0 | 0.00% | 0.00% | 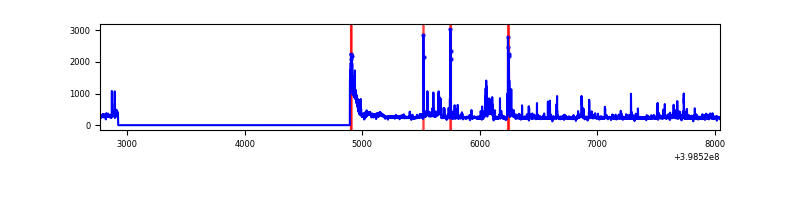 |
| D | 5277 | 3303 | 0 | 0 | 0.00% | 0.00% |  |
Top three noisy pixels from each quadrant. If the there are fewer than three noisy pixels in the level2.evt file, extra rows are filled as -1
| Pixel properties | Quadrant properties | ||||||
|---|---|---|---|---|---|---|---|
| Quadrant | DetID | PixID | Counts | Sigma | Mean | Median | Sigma |
| A | 9 | 19 | 157 | 8.78 | 45 | 43 | 13.0 |
| A | 7 | 110 | 145 | 7.86 | 45 | 43 | 13.0 |
| A | 9 | 239 | 134 | 7.01 | 45 | 43 | 13.0 |
| B | 2 | 9 | 173 | 11.81 | 45 | 43 | 11.0 |
| B | 3 | 80 | 143 | 9.09 | 45 | 43 | 11.0 |
| B | 2 | 8 | 131 | 8.0 | 45 | 43 | 11.0 |
| C | 1 | 81 | 145 | 7.61 | 45 | 43 | 13.4 |
| C | 3 | 187 | 138 | 7.09 | 45 | 43 | 13.4 |
| C | 1 | 80 | 131 | 6.57 | 45 | 43 | 13.4 |
| D | 7 | 3 | 116 | 5.82 | 43 | 39 | 13.2 |
| D | 6 | 67 | 113 | 5.59 | 43 | 39 | 13.2 |
| D | 6 | 62 | 113 | 5.59 | 43 | 39 | 13.2 |
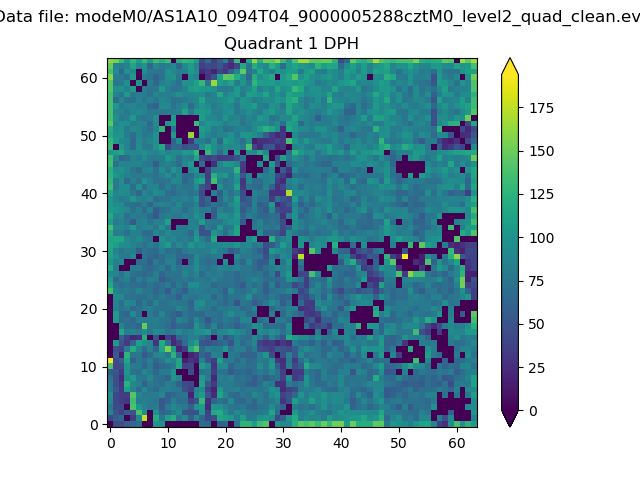
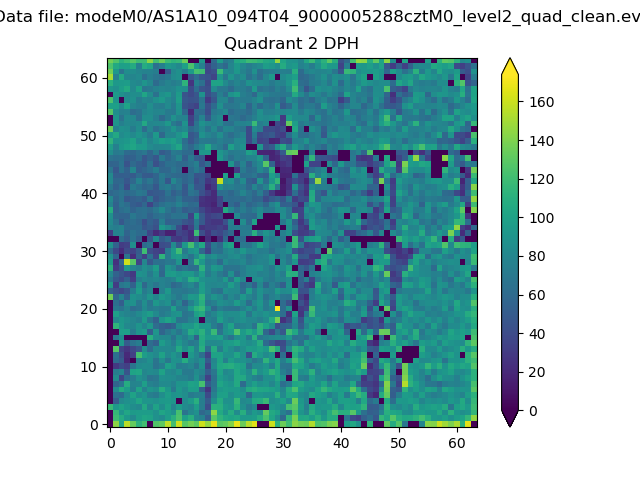
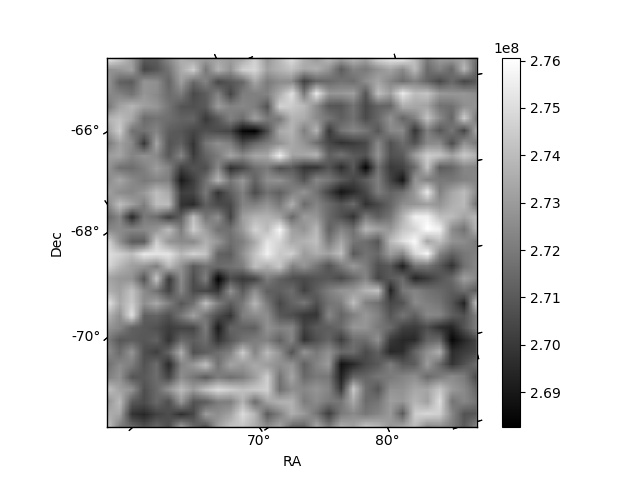
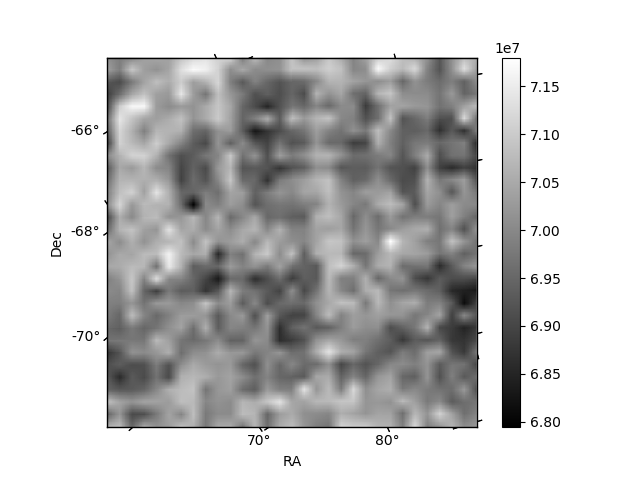
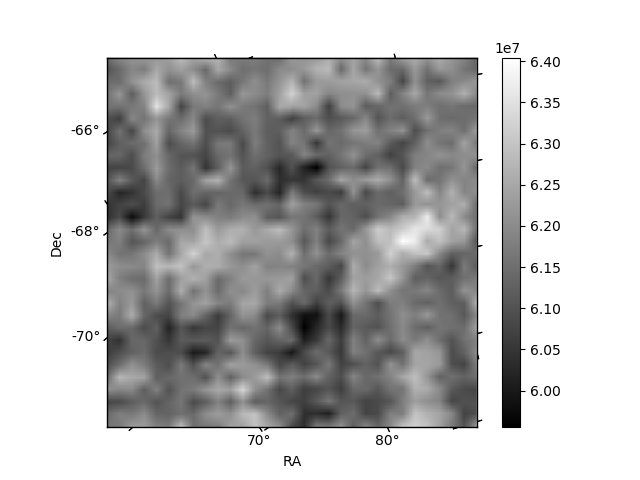
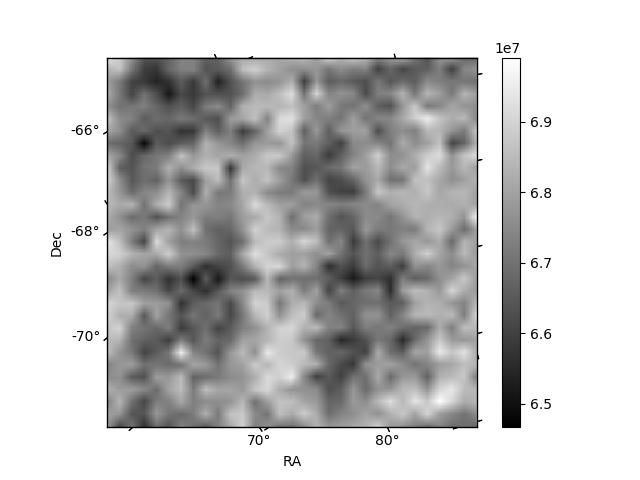
Histogram calculated using DETX and DETY for each event in the final _common_clean file
| Quadrant A |  |
 |
Quadrant B |
|---|---|---|---|
| Quadrant D |  |
 |
Quadrant C |
| Plot type | Count rate plots | Images |
|---|---|---|
| Comparison with Poisson distribution Blue bars denote a histogram of data divided into 1 sec bins. Red curve is a Poisson curve with rate = median count rate of data. |
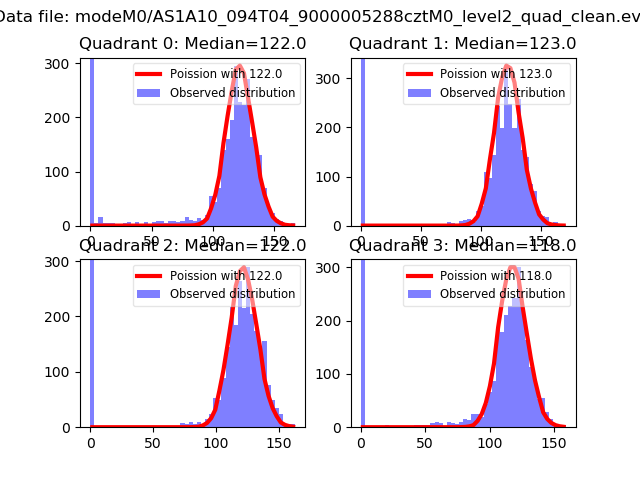 |
 |
| Quadrant-wise count rates Data is divided into 100 sec bins |
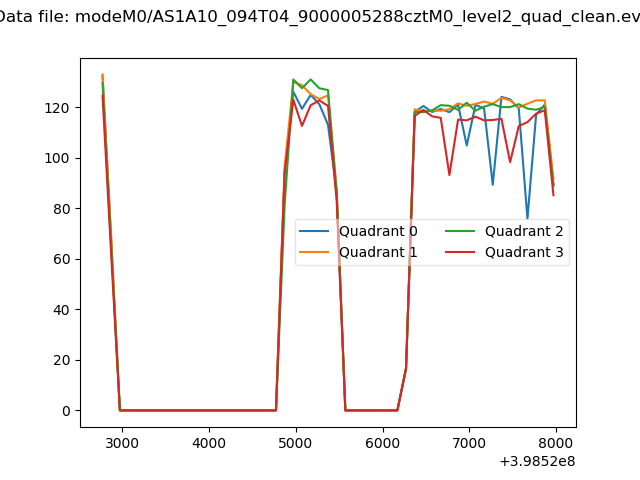 |
|
| Module-wise count rates for Quadrant A Data is divided into 100 sec bins |
 |
 |
| Module-wise count rates for Quadrant B Data is divided into 100 sec bins |
 |
 |
| Module-wise count rates for Quadrant C Data is divided into 100 sec bins |
 |
 |
| Module-wise count rates for Quadrant D Data is divided into 100 sec bins |
 |
 |
| Parameter | Plot |
|---|---|
| CZT HV Monitor |  |
| D_VDD | 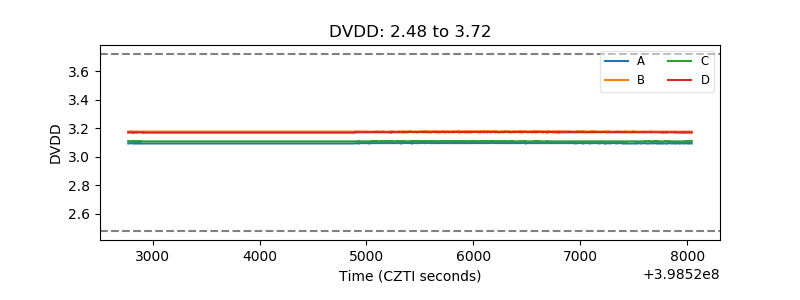 |
| Temperature 1 |  |
| Veto HV Monitor |  |
| Veto LLD | 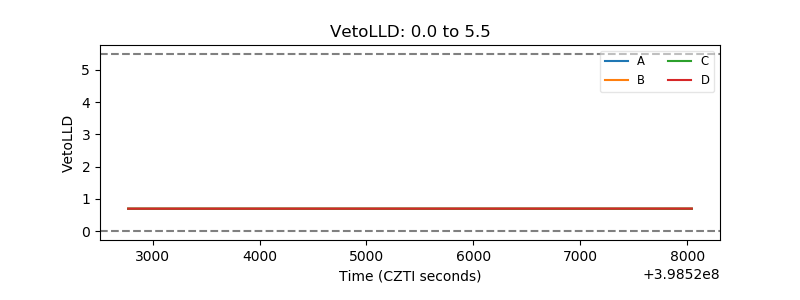 |
| Alpha Counter |  |
| _CPM_Rate |  |
| CZT Counter |  |
| +2.5 Volts monitor |  |
| +5 Volts monitor | 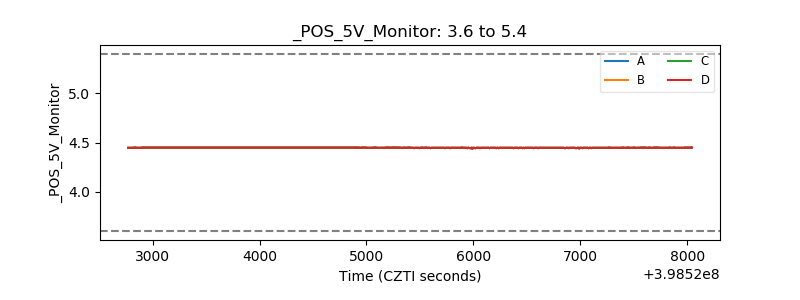 |
| _ROLL_ROT | 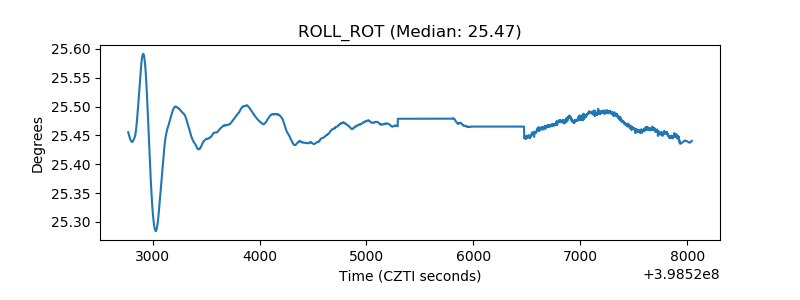 |
| _Roll_DEC |  |
| _Roll_RA |  |
| Veto Counter | 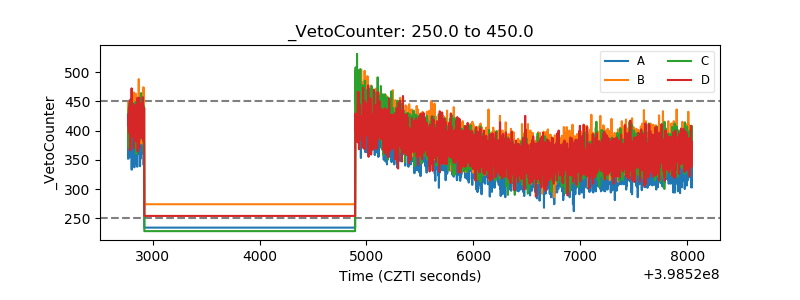 |