| Param | Original file | Final file |
|---|---|---|
| Filename | modeM0/AS1A10_094T07_9000005290cztM0_level2.fits | modeM0/AS1A10_094T07_9000005290cztM0_level2_quad_clean.evt |
| Size (bytes) | 35,017,920 | 44,084,160 |
| Size | 33.4 MB | 42.0 MB |
| Events in quadrant A | 203,602 | 265,187 |
| Events in quadrant B | 201,320 | 279,935 |
| Events in quadrant C | 202,814 | 268,162 |
| Events in quadrant D | 177,044 | 245,197 |
| Mode SS | |||
|---|---|---|---|
| Quadrant | BADHDUFLAG | Total packets | Discarded packets |
| A | 0 | 82 | 0 |
| B | 0 | 82 | 0 |
| C | 0 | 82 | 0 |
| D | 0 | 82 | 0 |
| Mode M0 | |||
|---|---|---|---|
| Quadrant | BADHDUFLAG | Total packets | Discarded packets |
| A | 0 | 9577 | 0 |
| B | 0 | 9041 | 0 |
| C | 0 | 8839 | 0 |
| D | 0 | 9893 | 0 |
| Mode M9 | |||
|---|---|---|---|
| Quadrant | BADHDUFLAG | Total packets | Discarded packets |
| A | 0 | 16 | 0 |
| B | 0 | 16 | 0 |
| C | 0 | 16 | 0 |
| D | 0 | 16 | 0 |
| Quadrant | Total seconds | Saturated seconds | Saturation percentage |
|---|---|---|---|
| A | 3900 | 217 | 5.564103% |
| B | 3900 | 24 | 0.615385% |
| C | 3900 | 64 | 1.641026% |
| D | 3900 | 147 | 3.769231% |
Noise dominated data is calculated using 1-second bins in cleaned event files. If a bin has >2000 counts, and if more than 50% of those come from <1% of pixels, then it is considered to be noise-dominated and hence unusable.
| Quadrant | # 1 sec bins | Bins with >0 counts | Bins with >2000 counts | High rate bins dominated by noise | Noise dominated (total time) | Noise dominated (detector-on time) | Marked lightcurve |
|---|---|---|---|---|---|---|---|
| A | 5543 | 3869 | 0 | 0 | 0.00% | 0.00% |  |
| B | 5543 | 3900 | 0 | 0 | 0.00% | 0.00% |  |
| C | 5543 | 3900 | 0 | 0 | 0.00% | 0.00% |  |
| D | 5543 | 3899 | 0 | 0 | 0.00% | 0.00% |  |
Top three noisy pixels from each quadrant. If the there are fewer than three noisy pixels in the level2.evt file, extra rows are filled as -1
| Pixel properties | Quadrant properties | ||||||
|---|---|---|---|---|---|---|---|
| Quadrant | DetID | PixID | Counts | Sigma | Mean | Median | Sigma |
| A | 0 | 29 | 170 | 8.05 | 53 | 50 | 14.9 |
| A | 7 | 110 | 161 | 7.45 | 53 | 50 | 14.9 |
| A | 14 | 95 | 158 | 7.25 | 53 | 50 | 14.9 |
| B | 2 | 9 | 185 | 10.64 | 53 | 51 | 12.6 |
| B | 3 | 80 | 172 | 9.61 | 53 | 51 | 12.6 |
| B | 2 | 8 | 147 | 7.63 | 53 | 51 | 12.6 |
| C | 1 | 80 | 160 | 7.1 | 53 | 50 | 15.5 |
| C | 1 | 81 | 153 | 6.65 | 53 | 50 | 15.5 |
| C | 2 | 31 | 152 | 6.58 | 53 | 50 | 15.5 |
| D | 1 | 3 | 143 | 6.28 | 50 | 46 | 15.4 |
| D | 6 | 231 | 141 | 6.15 | 50 | 46 | 15.4 |
| D | 10 | 189 | 138 | 5.96 | 50 | 46 | 15.4 |
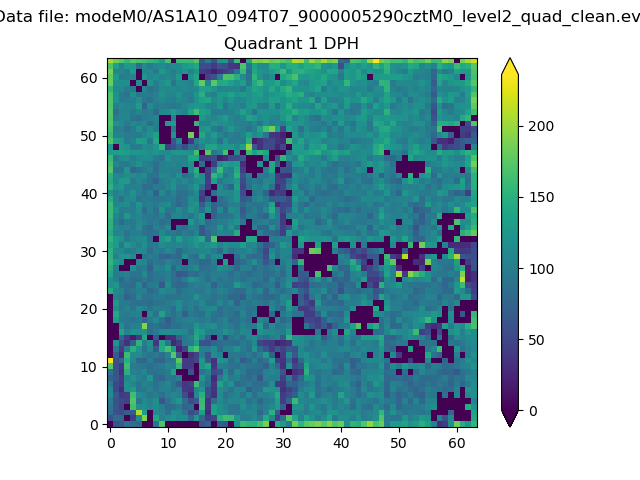
Histogram calculated using DETX and DETY for each event in the final _common_clean file
| Quadrant A |  |
 |
Quadrant B |
|---|---|---|---|
| Quadrant D | 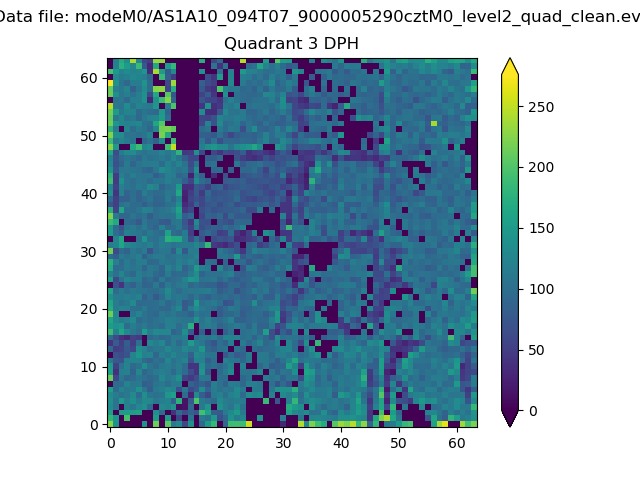 |
 |
Quadrant C |
| Plot type | Count rate plots | Images |
|---|---|---|
| Comparison with Poisson distribution Blue bars denote a histogram of data divided into 1 sec bins. Red curve is a Poisson curve with rate = median count rate of data. |
 |
 |
| Quadrant-wise count rates Data is divided into 100 sec bins |
 |
|
| Module-wise count rates for Quadrant A Data is divided into 100 sec bins |
 |
 |
| Module-wise count rates for Quadrant B Data is divided into 100 sec bins |
 |
 |
| Module-wise count rates for Quadrant C Data is divided into 100 sec bins |
 |
 |
| Module-wise count rates for Quadrant D Data is divided into 100 sec bins |
 |
 |
| Parameter | Plot |
|---|---|
| CZT HV Monitor |  |
| D_VDD |  |
| Temperature 1 |  |
| Veto HV Monitor |  |
| Veto LLD |  |
| Alpha Counter |  |
| _CPM_Rate |  |
| CZT Counter |  |
| +2.5 Volts monitor |  |
| +5 Volts monitor |  |
| _ROLL_ROT |  |
| _Roll_DEC |  |
| _Roll_RA |  |
| Veto Counter |  |