| Param | Original file | Final file |
|---|---|---|
| Filename | modeM0/AS1A10_094T07_9000005290_37249cztM0_level2.evt | modeM0/AS1A10_094T07_9000005290_37249cztM0_level2_quad_clean.evt |
| Size (bytes) | 174,320,640 | 29,136,960 |
| Size | 166.2 MB | 27.8 MB |
| Events in quadrant A | 1,234,250 | 185,126 |
| Events in quadrant B | 1,199,345 | 187,252 |
| Events in quadrant C | 1,276,836 | 182,855 |
| Events in quadrant D | 1,427,626 | 178,027 |
| Mode SS | |||
|---|---|---|---|
| Quadrant | BADHDUFLAG | Total packets | Discarded packets |
| A | 0 | 44 | 0 |
| B | 0 | 44 | 0 |
| C | 0 | 44 | 0 |
| D | 0 | 44 | 0 |
| Mode M0 | |||
|---|---|---|---|
| Quadrant | BADHDUFLAG | Total packets | Discarded packets |
| A | 0 | 4918 | 2 |
| B | 0 | 4918 | 1 |
| C | 0 | 4994 | 1 |
| D | 0 | 5540 | 1 |
| Mode M9 | |||
|---|---|---|---|
| Quadrant | BADHDUFLAG | Total packets | Discarded packets |
| A | 0 | 16 | 0 |
| B | 0 | 16 | 0 |
| C | 0 | 16 | 0 |
| D | 0 | 16 | 0 |
| Quadrant | Total seconds | Saturated seconds | Saturation percentage |
|---|---|---|---|
| A | 2042 | 52 | 2.546523% |
| B | 2042 | 21 | 1.028404% |
| C | 2042 | 60 | 2.938296% |
| D | 2042 | 125 | 6.121450% |
Noise dominated data is calculated using 1-second bins in cleaned event files. If a bin has >2000 counts, and if more than 50% of those come from <1% of pixels, then it is considered to be noise-dominated and hence unusable.
| Quadrant | # 1 sec bins | Bins with >0 counts | Bins with >2000 counts | High rate bins dominated by noise | Noise dominated (total time) | Noise dominated (detector-on time) | Marked lightcurve |
|---|---|---|---|---|---|---|---|
| A | 3685 | 2043 | 37 | 37 | 1.00% | 1.81% | 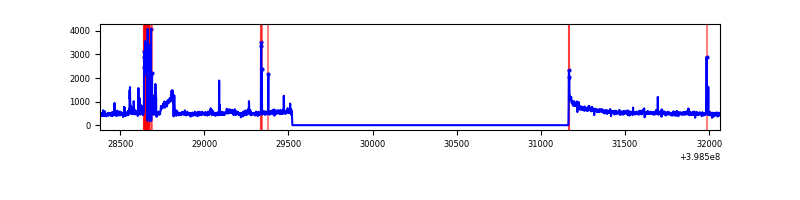 |
| B | 3685 | 2043 | 2 | 2 | 0.05% | 0.10% | 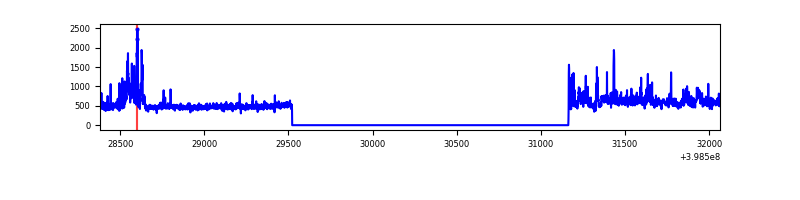 |
| C | 3685 | 2043 | 43 | 43 | 1.17% | 2.10% | 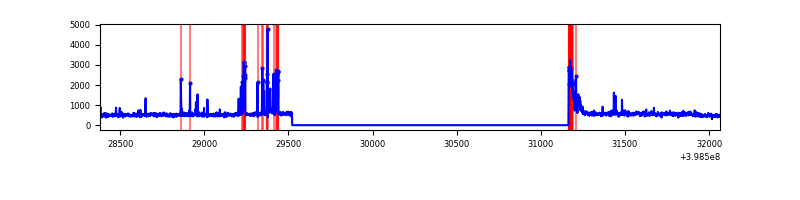 |
| D | 3685 | 2043 | 101 | 101 | 2.74% | 4.94% | 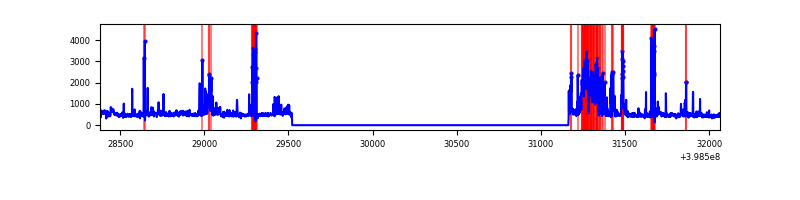 |
Top three noisy pixels from each quadrant. If the there are fewer than three noisy pixels in the level2.evt file, extra rows are filled as -1
| Pixel properties | Quadrant properties | ||||||
|---|---|---|---|---|---|---|---|
| Quadrant | DetID | PixID | Counts | Sigma | Mean | Median | Sigma |
| A | 15 | 237 | 168059 | 3369.76 | 236 | 231 | 49.8 |
| A | 10 | 83 | 126651 | 2538.35 | 236 | 231 | 49.8 |
| A | 15 | 223 | 7933 | 154.65 | 236 | 231 | 49.8 |
| B | 5 | 200 | 63878 | 1365.31 | 235 | 228 | 46.6 |
| B | 4 | 80 | 54477 | 1163.65 | 235 | 228 | 46.6 |
| B | 0 | 230 | 47654 | 1017.3 | 235 | 228 | 46.6 |
| C | 14 | 254 | 119715 | 2155.23 | 232 | 233 | 55.4 |
| C | 15 | 214 | 88279 | 1588.18 | 232 | 233 | 55.4 |
| C | 0 | 10 | 84859 | 1526.49 | 232 | 233 | 55.4 |
| D | 10 | 253 | 167051 | 2913.88 | 230 | 223 | 57.3 |
| D | 13 | 249 | 93460 | 1628.51 | 230 | 223 | 57.3 |
| D | 2 | 250 | 68329 | 1189.56 | 230 | 223 | 57.3 |
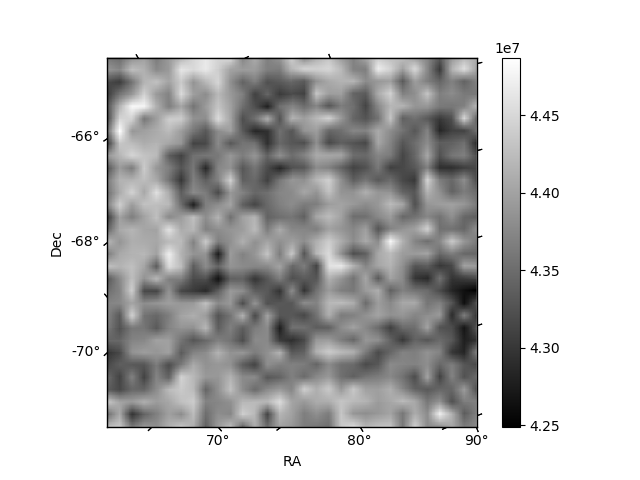
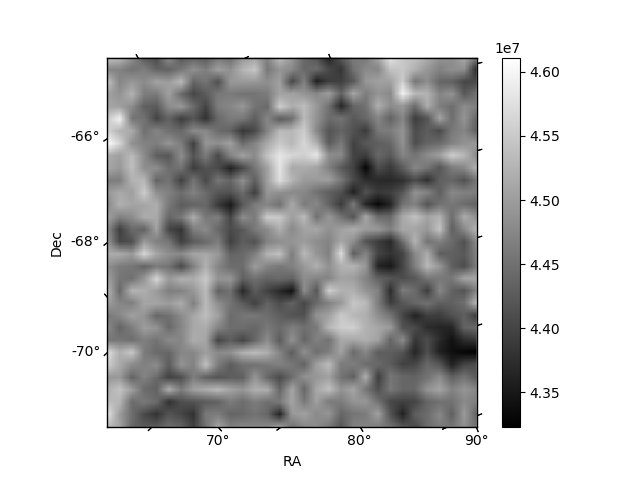
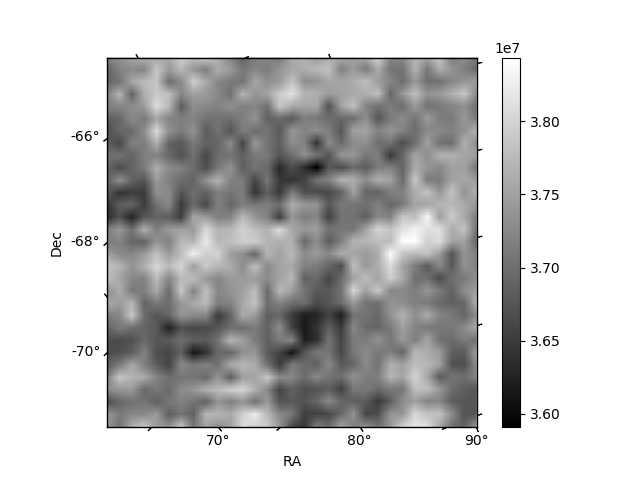
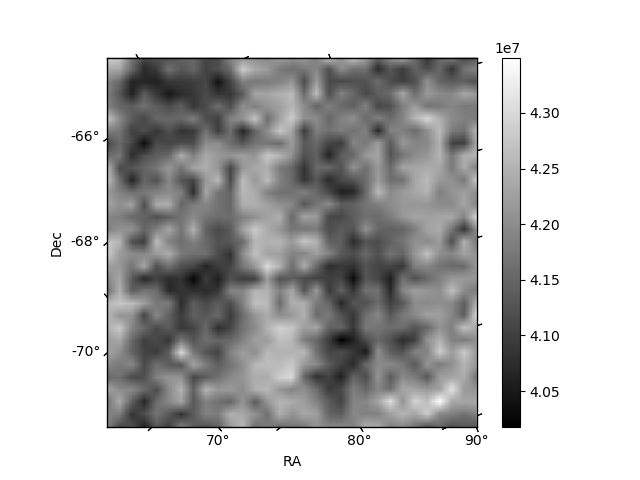
Histogram calculated using DETX and DETY for each event in the final _common_clean file
| Quadrant A | 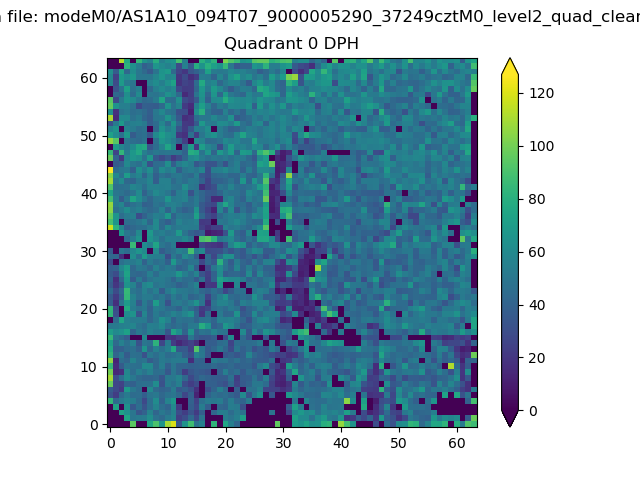 |
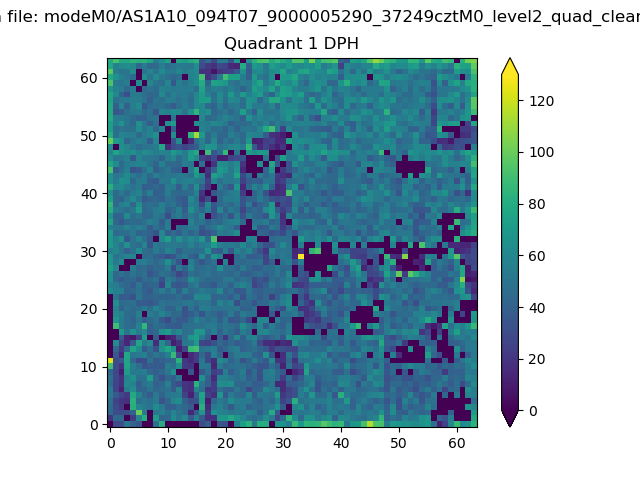 |
Quadrant B |
|---|---|---|---|
| Quadrant D | 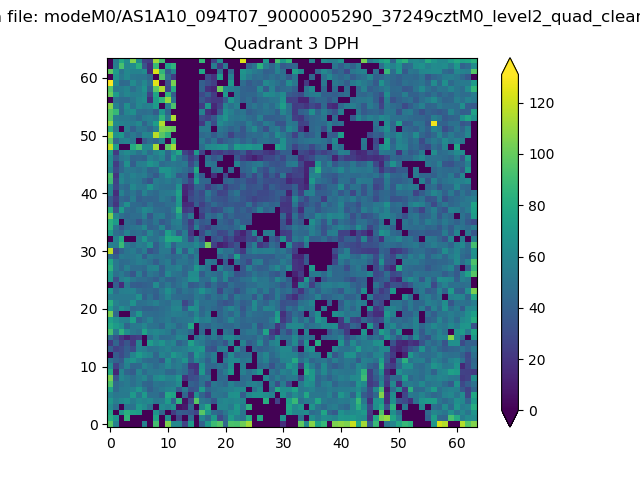 |
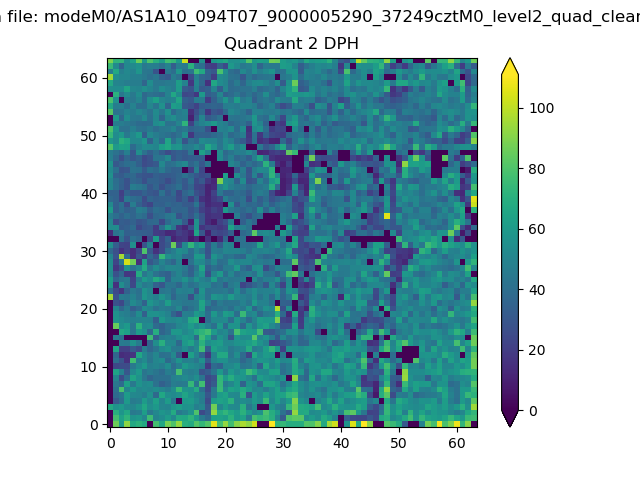 |
Quadrant C |
| Plot type | Count rate plots | Images |
|---|---|---|
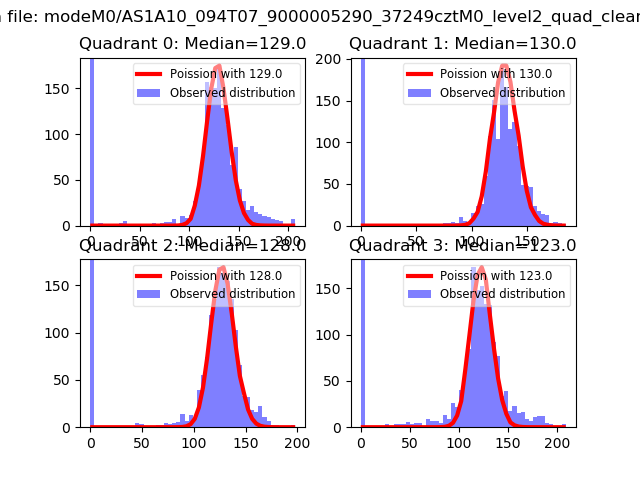
| Comparison with Poisson distribution Blue bars denote a histogram of data divided into 1 sec bins. Red curve is a Poisson curve with rate = median count rate of data. |
 |
 |
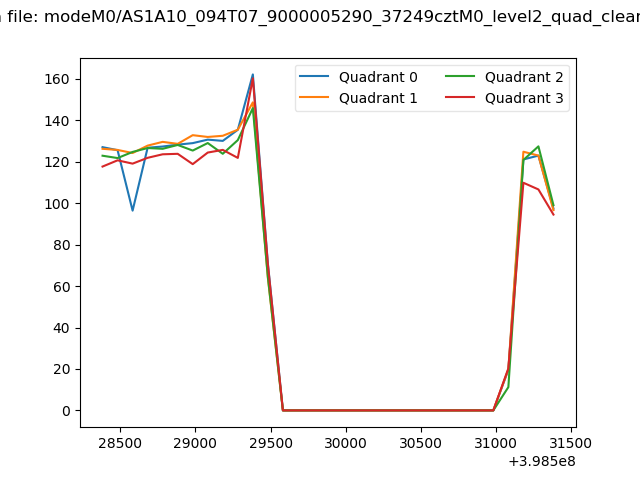
| Quadrant-wise count rates Data is divided into 100 sec bins |
 |
|
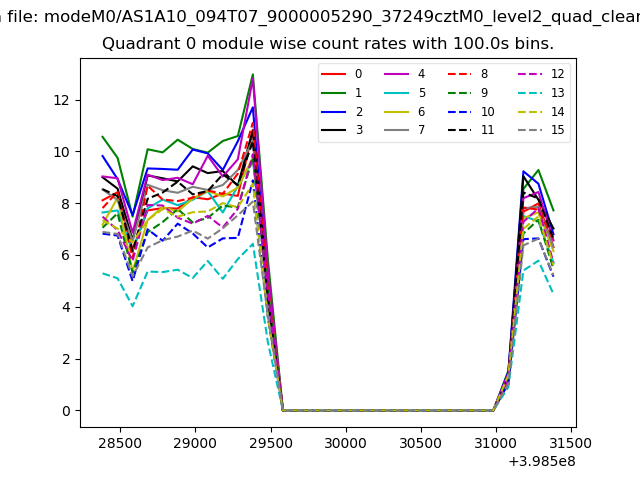
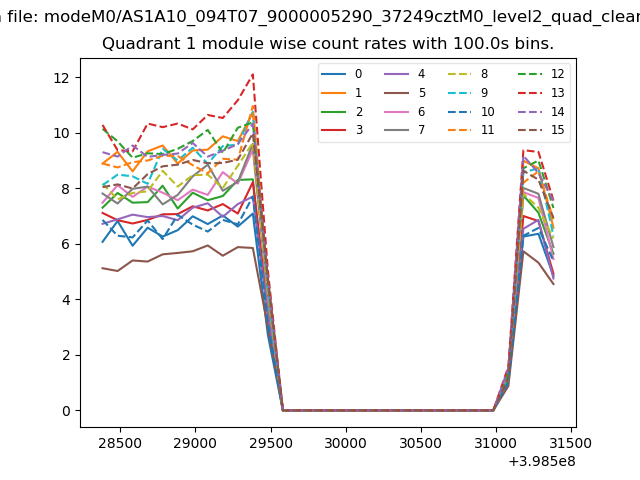
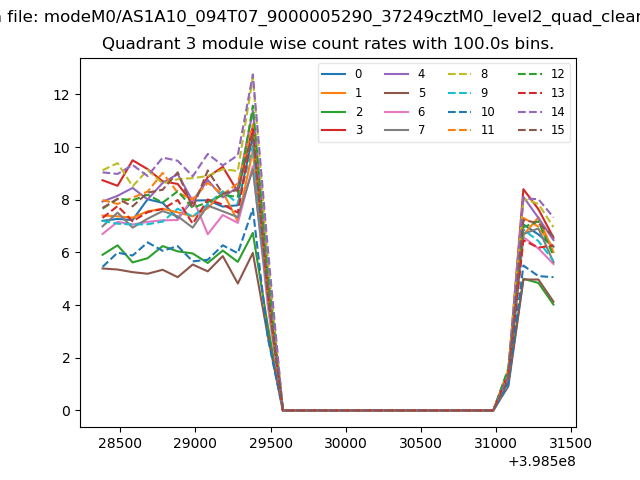
| Module-wise count rates for Quadrant A Data is divided into 100 sec bins |
 |
 |
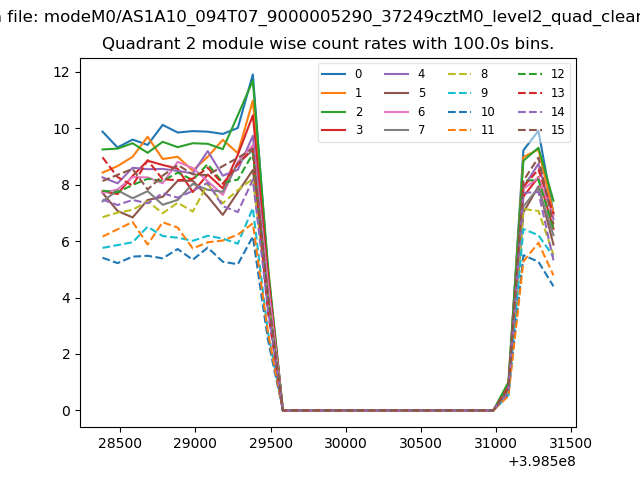
| Module-wise count rates for Quadrant B Data is divided into 100 sec bins |
 |
 |
| Module-wise count rates for Quadrant C Data is divided into 100 sec bins |
 |
 |
| Module-wise count rates for Quadrant D Data is divided into 100 sec bins |
 |
 |
| Parameter | Plot |
|---|---|
| CZT HV Monitor | 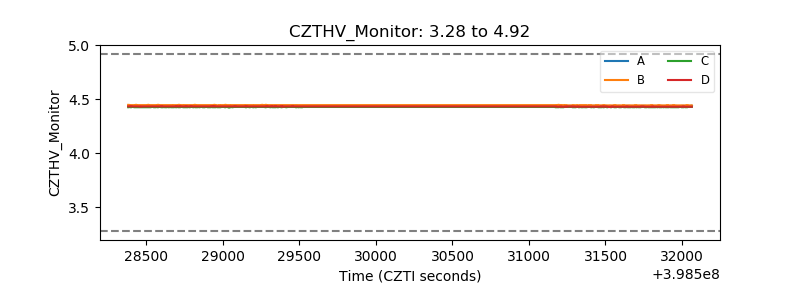 |
| D_VDD | 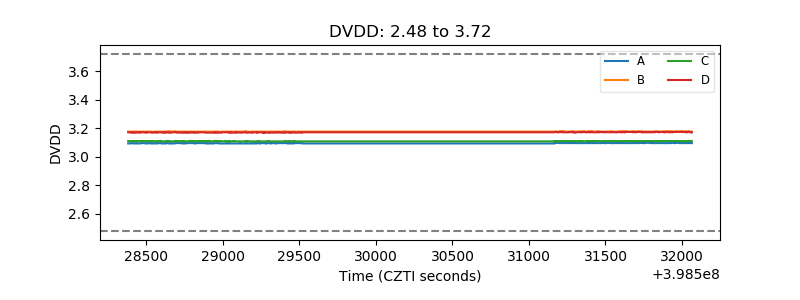 |
| Temperature 1 | 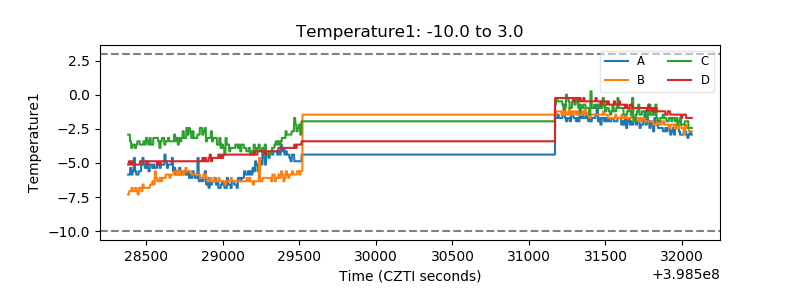 |
| Veto HV Monitor | 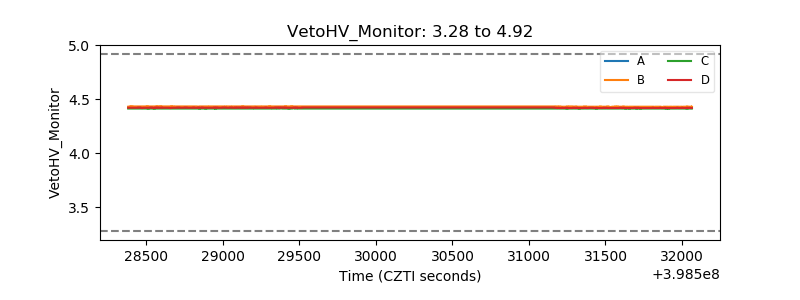 |
| Veto LLD | 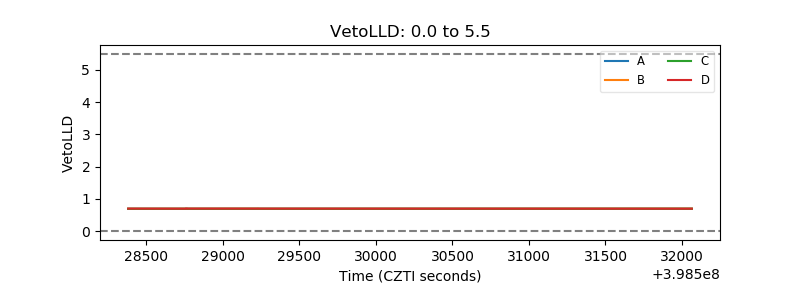 |
| Alpha Counter | 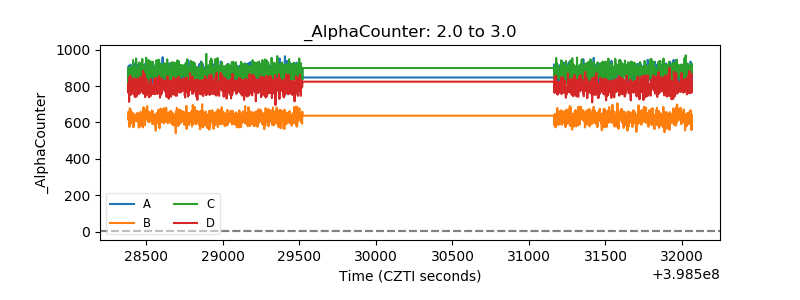 |
| _CPM_Rate | 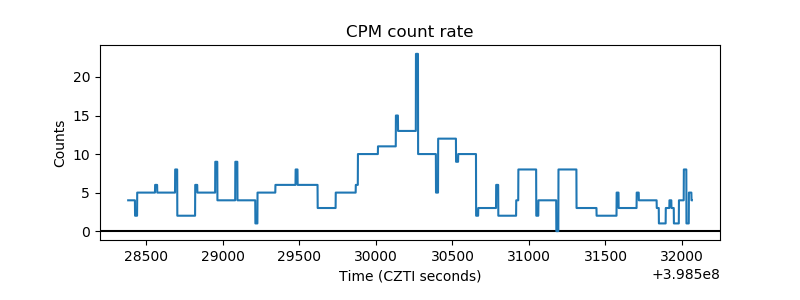 |
| CZT Counter | 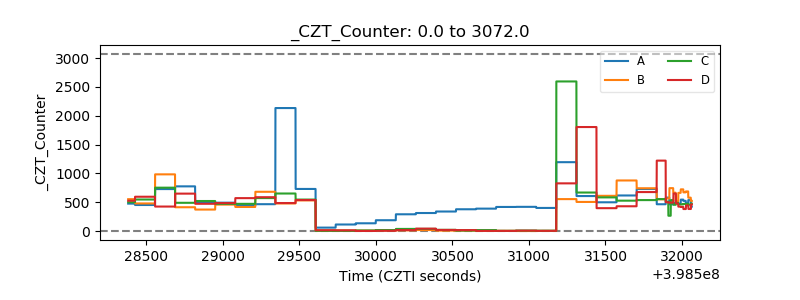 |
| +2.5 Volts monitor | 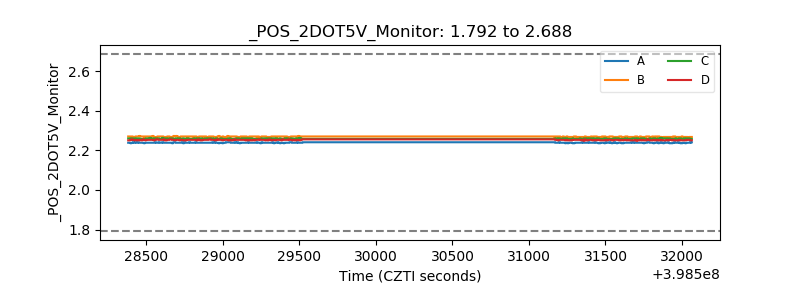 |
| +5 Volts monitor | 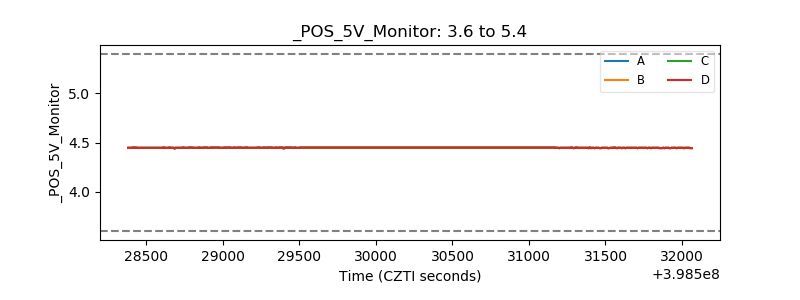 |
| _ROLL_ROT | 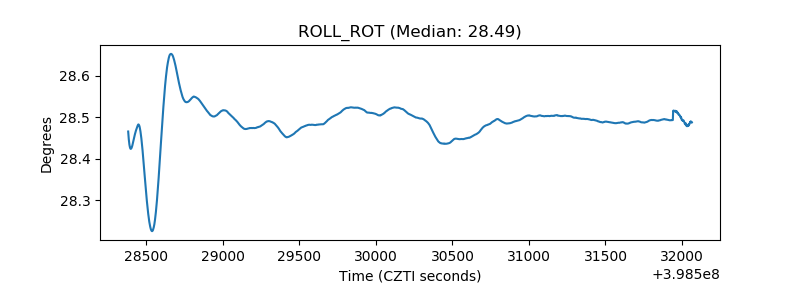 |
| _Roll_DEC | 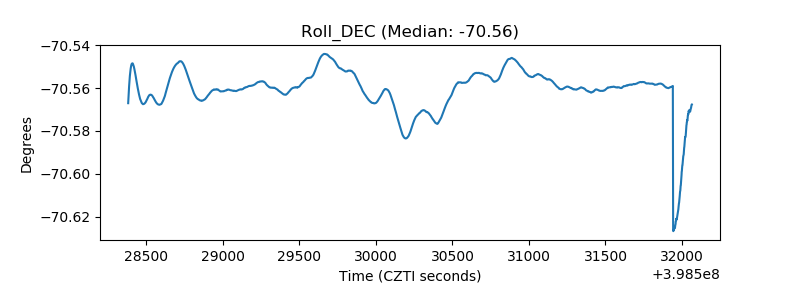 |
| _Roll_RA | 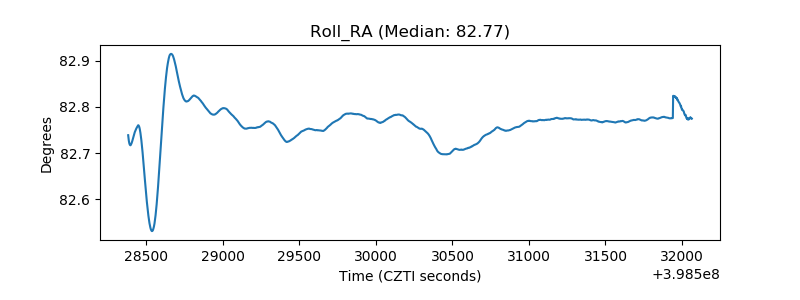 |
| Veto Counter | 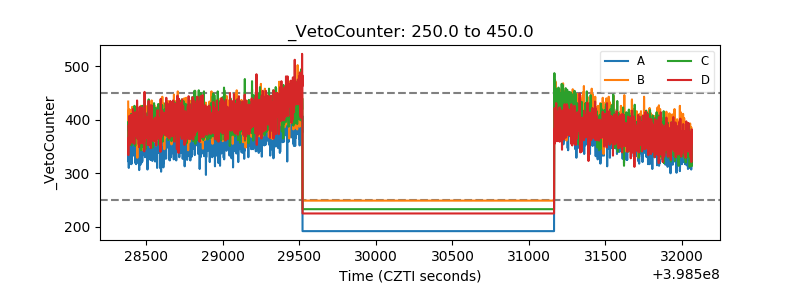 |