| Param | Original file | Final file |
|---|---|---|
| Filename | modeM0/AS1A10_094T07_9000005290_37250cztM0_level2.evt | modeM0/AS1A10_094T07_9000005290_37250cztM0_level2_quad_clean.evt |
| Size (bytes) | 221,716,800 | 37,175,040 |
| Size | 211.4 MB | 35.5 MB |
| Events in quadrant A | 1,678,617 | 225,283 |
| Events in quadrant B | 1,617,239 | 239,112 |
| Events in quadrant C | 1,490,787 | 237,117 |
| Events in quadrant D | 1,738,635 | 226,233 |
| Mode SS | |||
|---|---|---|---|
| Quadrant | BADHDUFLAG | Total packets | Discarded packets |
| A | 0 | 56 | 0 |
| B | 0 | 56 | 0 |
| C | 0 | 56 | 0 |
| D | 0 | 56 | 0 |
| Mode M0 | |||
|---|---|---|---|
| Quadrant | BADHDUFLAG | Total packets | Discarded packets |
| A | 0 | 6760 | 1 |
| B | 0 | 6511 | 1 |
| C | 0 | 6110 | 1 |
| D | 0 | 7114 | 1 |
| Mode M9 | |||
|---|---|---|---|
| Quadrant | BADHDUFLAG | Total packets | Discarded packets |
| A | 0 | 2 | 0 |
| B | 0 | 2 | 0 |
| C | 0 | 2 | 0 |
| D | 0 | 3 | 0 |
| Quadrant | Total seconds | Saturated seconds | Saturation percentage |
|---|---|---|---|
| A | 2758 | 173 | 6.272661% |
| B | 2758 | 10 | 0.362582% |
| C | 2758 | 29 | 1.051487% |
| D | 2758 | 120 | 4.350979% |
Noise dominated data is calculated using 1-second bins in cleaned event files. If a bin has >2000 counts, and if more than 50% of those come from <1% of pixels, then it is considered to be noise-dominated and hence unusable.
| Quadrant | # 1 sec bins | Bins with >0 counts | Bins with >2000 counts | High rate bins dominated by noise | Noise dominated (total time) | Noise dominated (detector-on time) | Marked lightcurve |
|---|---|---|---|---|---|---|---|
| A | 2758 | 2758 | 79 | 79 | 2.86% | 2.86% | 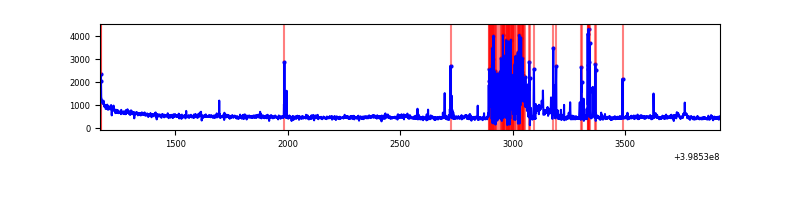 |
| B | 2758 | 2758 | 0 | 0 | 0.00% | 0.00% | 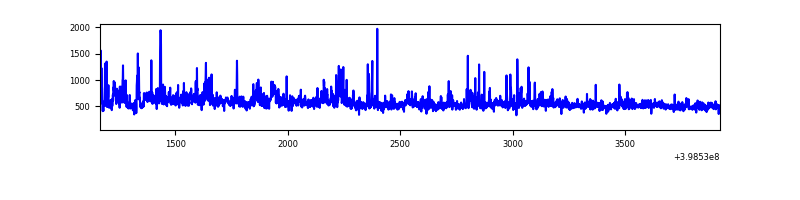 |
| C | 2758 | 2758 | 26 | 26 | 0.94% | 0.94% | 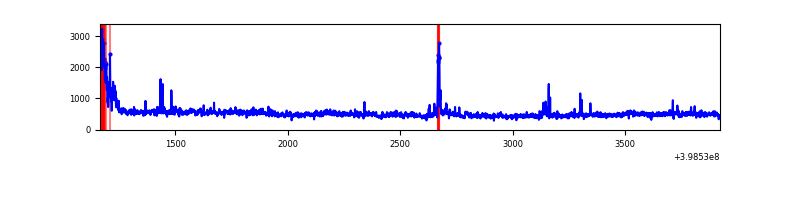 |
| D | 2758 | 2758 | 105 | 105 | 3.81% | 3.81% | 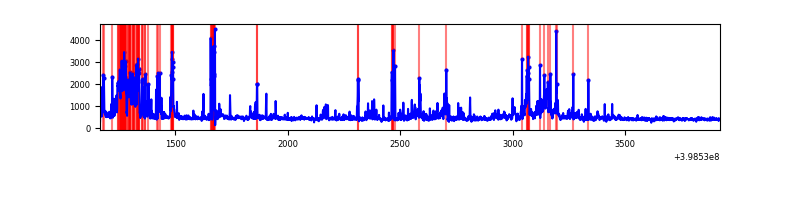 |
Top three noisy pixels from each quadrant. If the there are fewer than three noisy pixels in the level2.evt file, extra rows are filled as -1
| Pixel properties | Quadrant properties | ||||||
|---|---|---|---|---|---|---|---|
| Quadrant | DetID | PixID | Counts | Sigma | Mean | Median | Sigma |
| A | 15 | 237 | 340818 | 5742.38 | 285 | 280 | 59.3 |
| A | 10 | 83 | 150200 | 2528.05 | 285 | 280 | 59.3 |
| A | 15 | 223 | 34204 | 572.05 | 285 | 280 | 59.3 |
| B | 4 | 80 | 186707 | 3212.19 | 294 | 287 | 58.0 |
| B | 0 | 230 | 74894 | 1285.55 | 294 | 287 | 58.0 |
| B | 0 | 190 | 48770 | 835.41 | 294 | 287 | 58.0 |
| C | 15 | 214 | 117099 | 1745.76 | 283 | 284 | 66.9 |
| C | 12 | 247 | 110000 | 1639.67 | 283 | 284 | 66.9 |
| C | 0 | 10 | 84992 | 1265.93 | 283 | 284 | 66.9 |
| D | 10 | 253 | 166909 | 2395.99 | 280 | 272 | 69.5 |
| D | 12 | 218 | 76590 | 1097.34 | 280 | 272 | 69.5 |
| D | 2 | 153 | 74069 | 1061.09 | 280 | 272 | 69.5 |
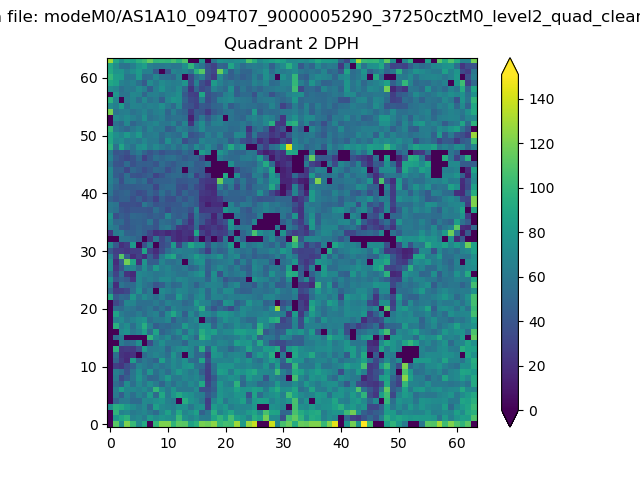
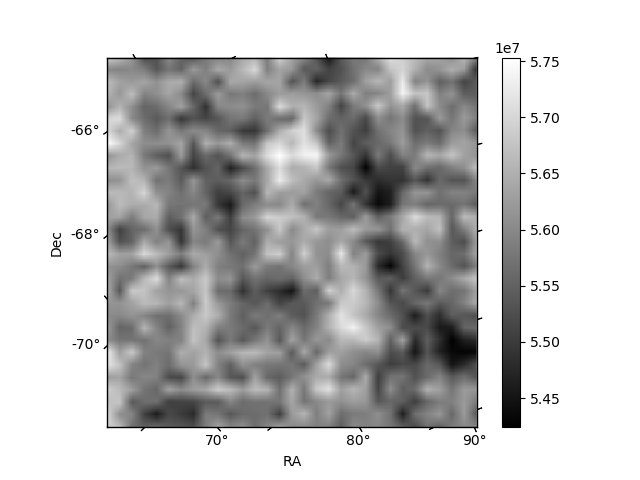
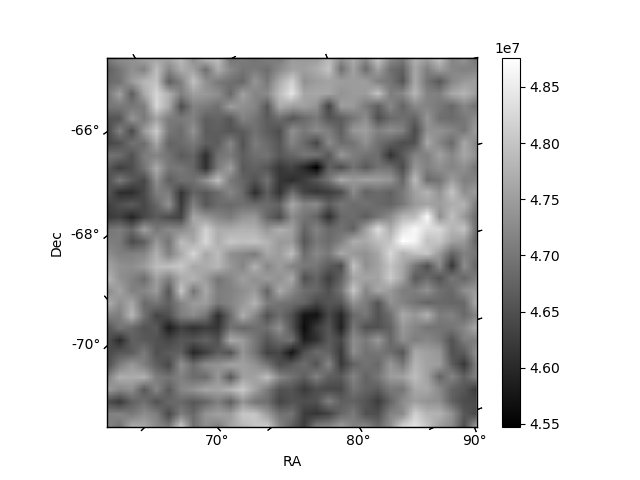
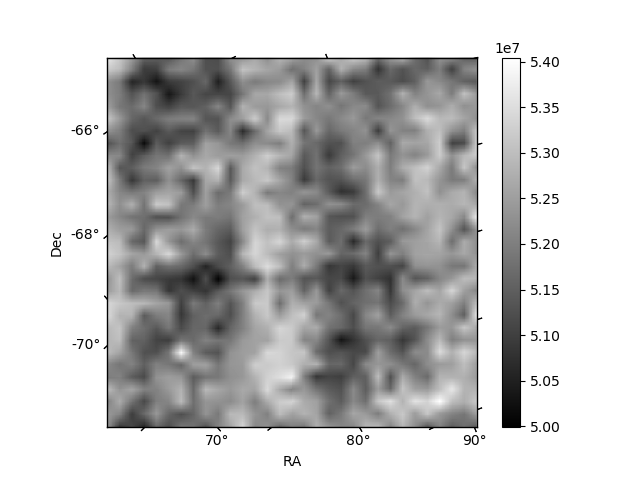
Histogram calculated using DETX and DETY for each event in the final _common_clean file
| Quadrant A | 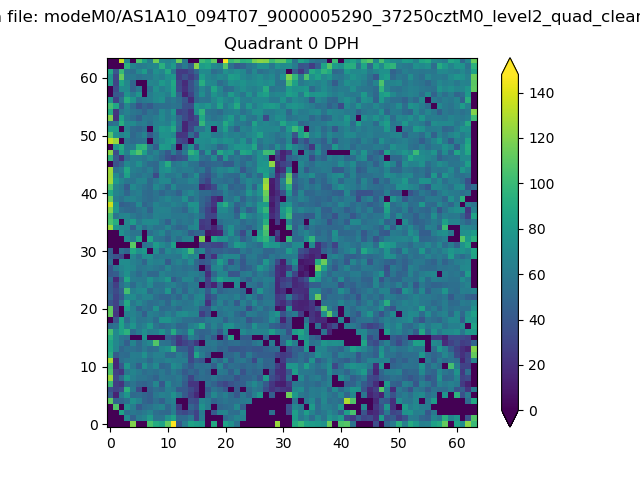 |
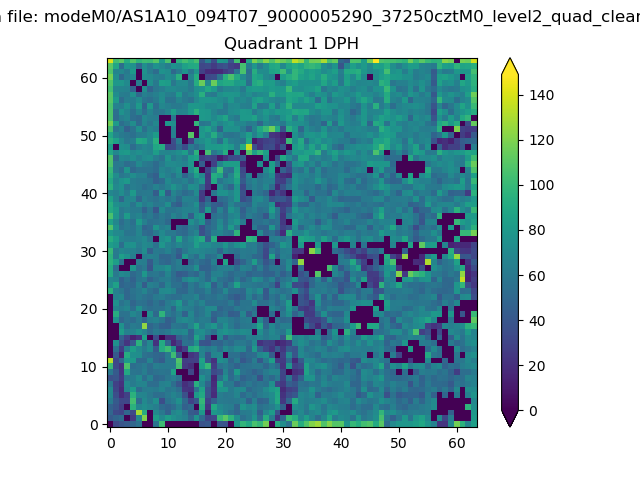 |
Quadrant B |
|---|---|---|---|
| Quadrant D | 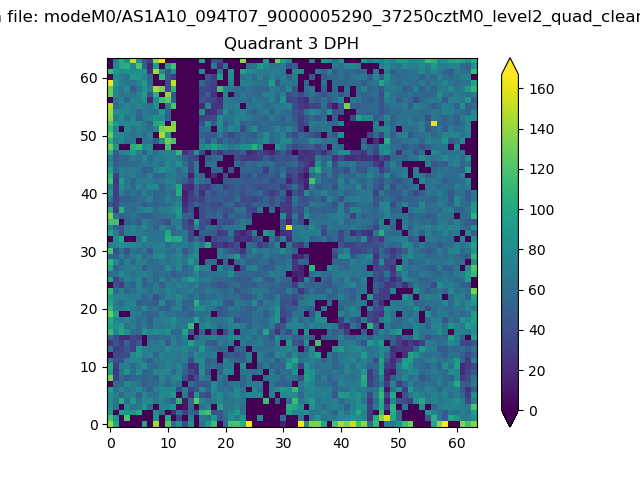 |
 |
Quadrant C |
| Plot type | Count rate plots | Images |
|---|---|---|
| Comparison with Poisson distribution Blue bars denote a histogram of data divided into 1 sec bins. Red curve is a Poisson curve with rate = median count rate of data. |
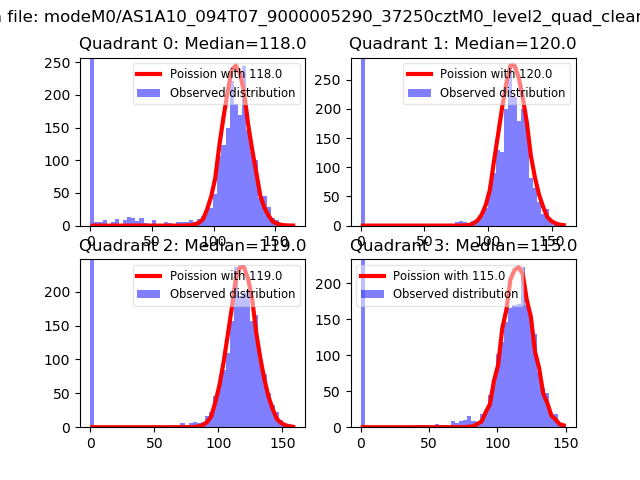 |
 |
| Quadrant-wise count rates Data is divided into 100 sec bins |
 |
|
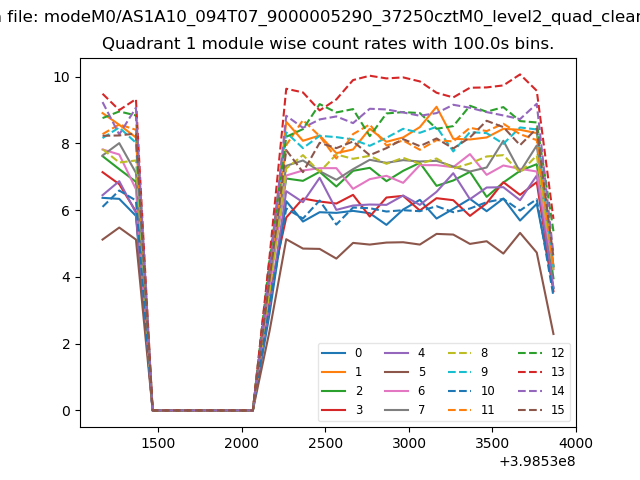
| Module-wise count rates for Quadrant A Data is divided into 100 sec bins |
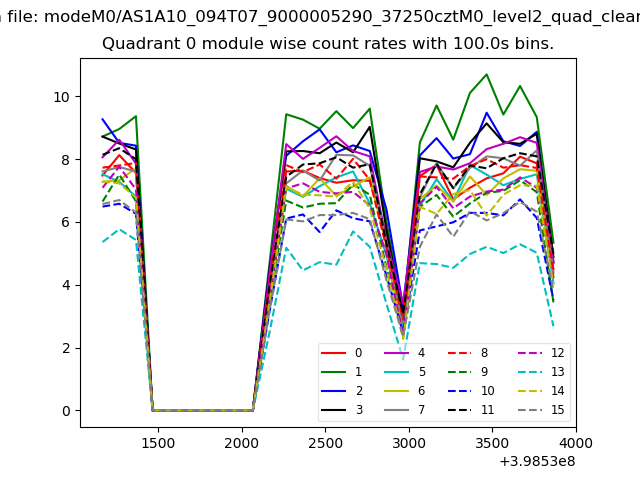 |
 |
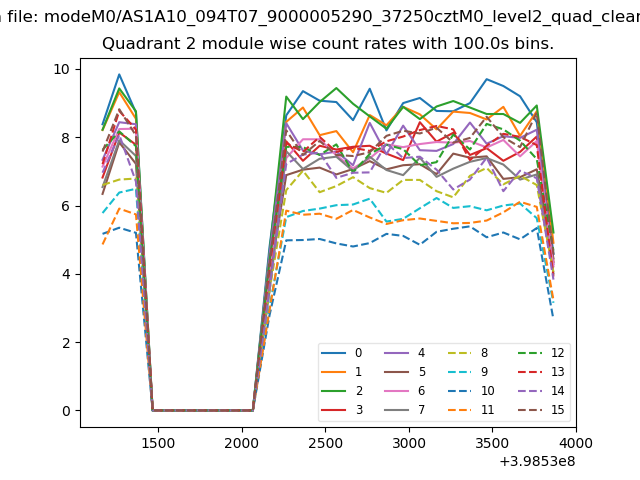
| Module-wise count rates for Quadrant B Data is divided into 100 sec bins |
 |
 |
| Module-wise count rates for Quadrant C Data is divided into 100 sec bins |
 |
 |
| Module-wise count rates for Quadrant D Data is divided into 100 sec bins |
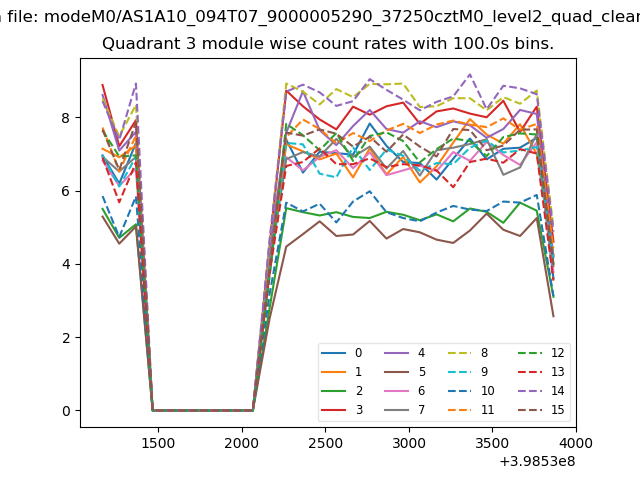 |
 |
| Parameter | Plot |
|---|---|
| CZT HV Monitor | 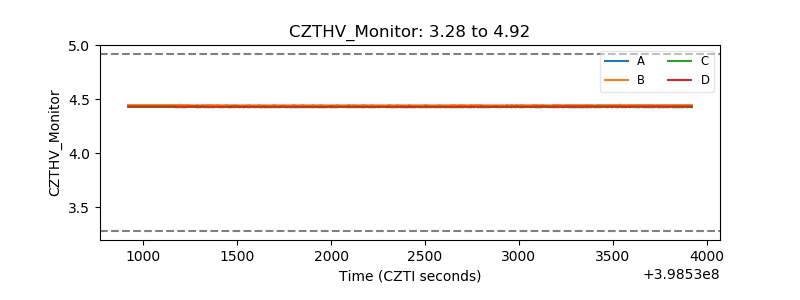 |
| D_VDD | 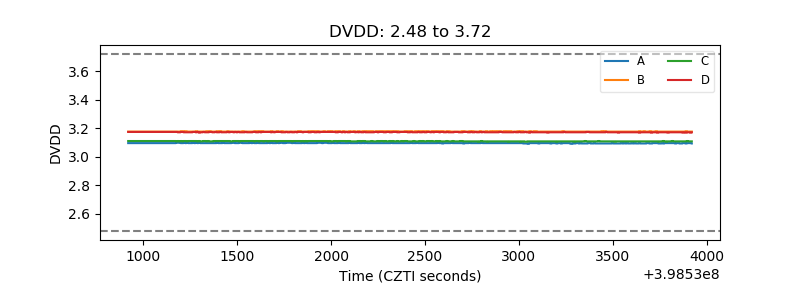 |
| Temperature 1 | 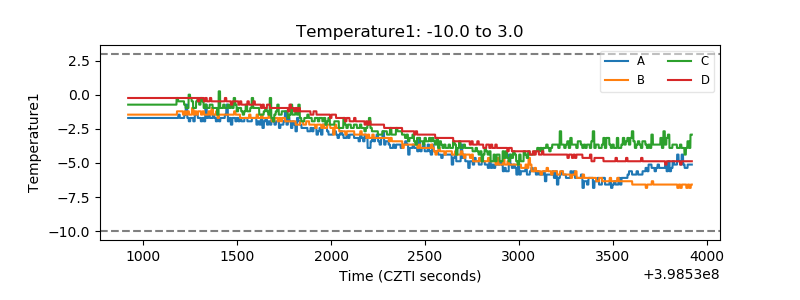 |
| Veto HV Monitor | 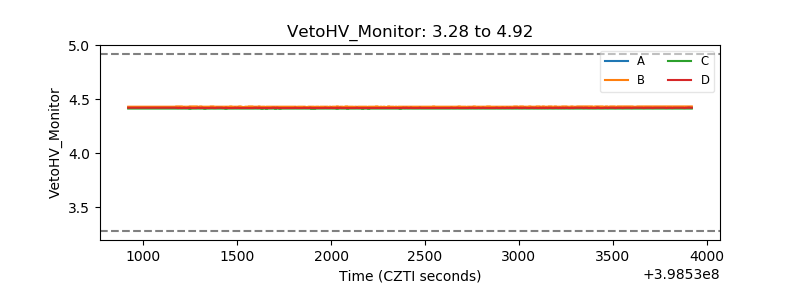 |
| Veto LLD | 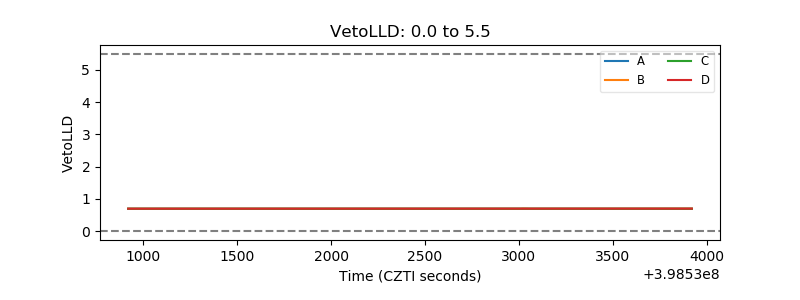 |
| Alpha Counter | 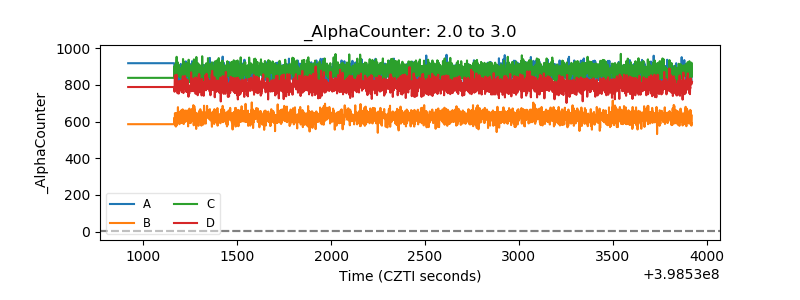 |
| _CPM_Rate | 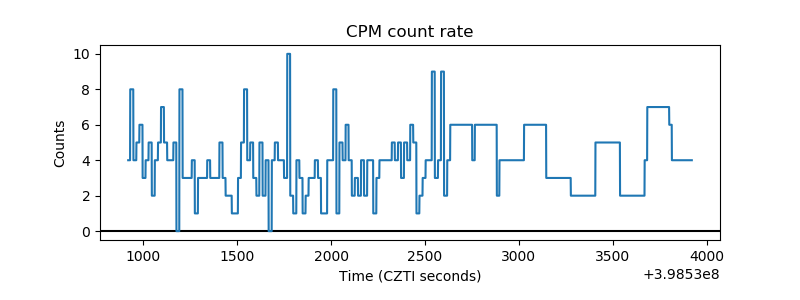 |
| CZT Counter | 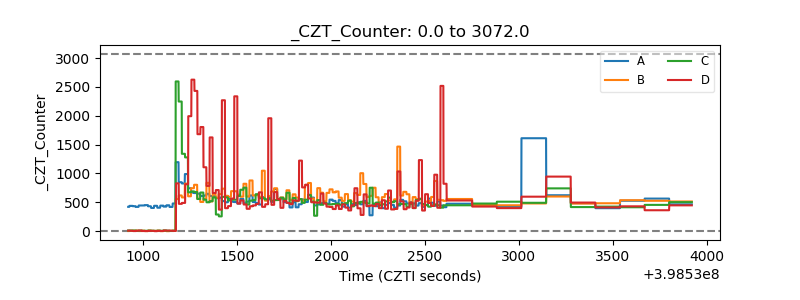 |
| +2.5 Volts monitor | 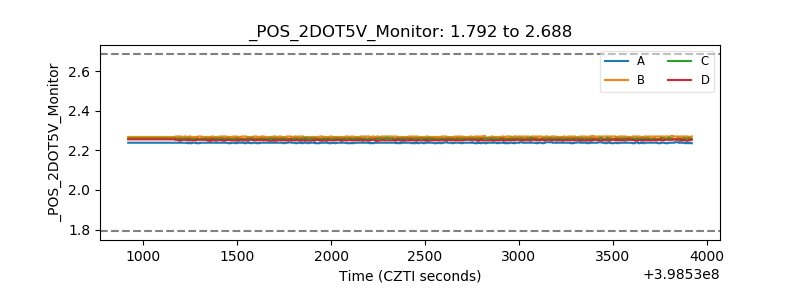 |
| +5 Volts monitor | 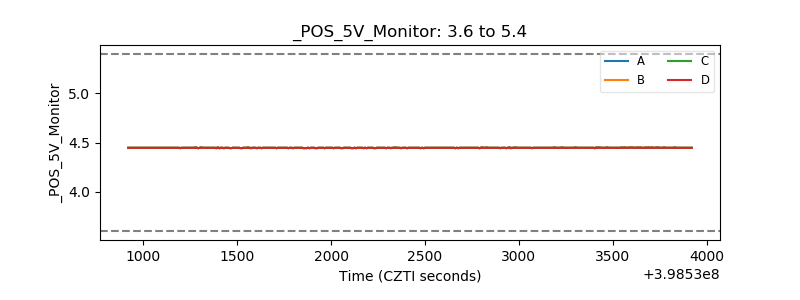 |
| _ROLL_ROT | 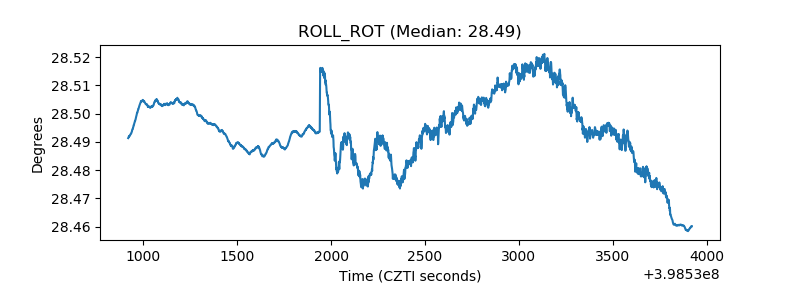 |
| _Roll_DEC | 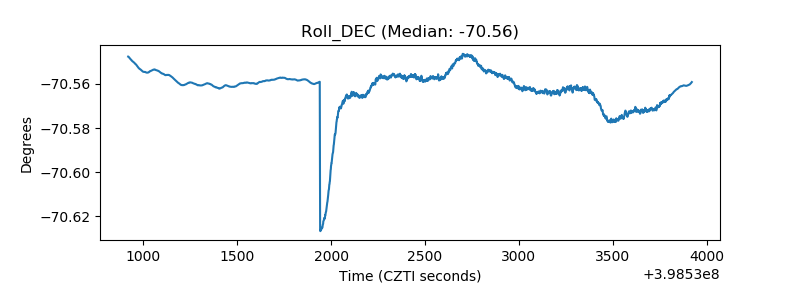 |
| _Roll_RA | 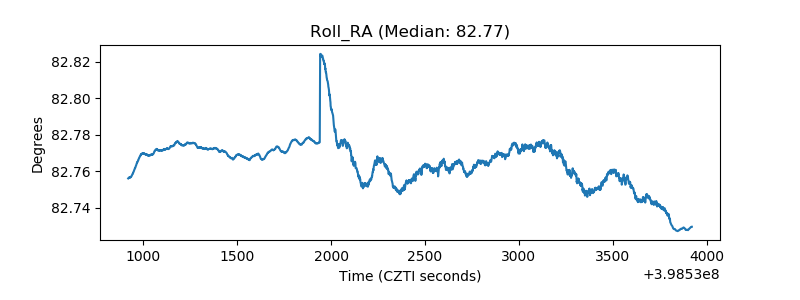 |
| Veto Counter | 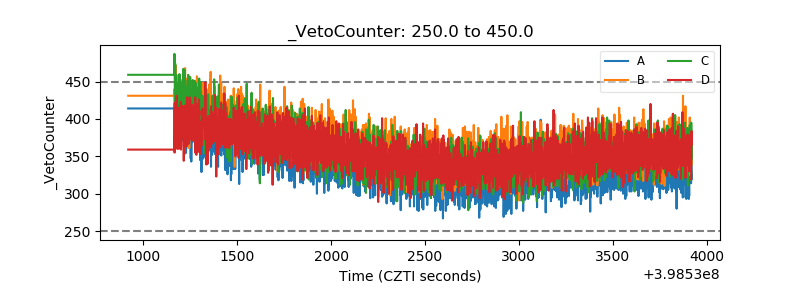 |