| Param | Original file | Final file |
|---|---|---|
| Filename | modeM0/AS1T04_087T01_9000005292cztM0_level2.fits | modeM0/AS1T04_087T01_9000005292cztM0_level2_quad_clean.evt |
| Size (bytes) | 320,002,560 | 334,785,600 |
| Size | 305.2 MB | 319.3 MB |
| Events in quadrant A | 1,252,134 | 1,368,614 |
| Events in quadrant B | 1,225,128 | 1,389,388 |
| Events in quadrant C | 1,228,606 | 1,290,842 |
| Events in quadrant D | 1,077,114 | 1,184,136 |
| Mode M9 | |||
|---|---|---|---|
| Quadrant | BADHDUFLAG | Total packets | Discarded packets |
| A | 0 | 264 | 0 |
| B | 0 | 264 | 0 |
| C | 0 | 264 | 0 |
| D | 0 | 264 | 0 |
| Mode SS | |||
|---|---|---|---|
| Quadrant | BADHDUFLAG | Total packets | Discarded packets |
| A | 0 | 1464 | 0 |
| B | 0 | 1464 | 0 |
| C | 0 | 1464 | 0 |
| D | 0 | 1464 | 0 |
| Mode M0 | |||
|---|---|---|---|
| Quadrant | BADHDUFLAG | Total packets | Discarded packets |
| A | 0 | 179505 | 0 |
| B | 0 | 163088 | 0 |
| C | 0 | 161275 | 0 |
| D | 0 | 176868 | 0 |
| Quadrant | Total seconds | Saturated seconds | Saturation percentage |
|---|---|---|---|
| A | 71457 | 2948 | 4.125558% |
| B | 71457 | 772 | 1.080370% |
| C | 71456 | 884 | 1.237125% |
| D | 71457 | 2037 | 2.850665% |
Noise dominated data is calculated using 1-second bins in cleaned event files. If a bin has >2000 counts, and if more than 50% of those come from <1% of pixels, then it is considered to be noise-dominated and hence unusable.
| Quadrant | # 1 sec bins | Bins with >0 counts | Bins with >2000 counts | High rate bins dominated by noise | Noise dominated (total time) | Noise dominated (detector-on time) | Marked lightcurve |
|---|---|---|---|---|---|---|---|
| A | 34770 | 23579 | 0 | 0 | 0.00% | 0.00% | 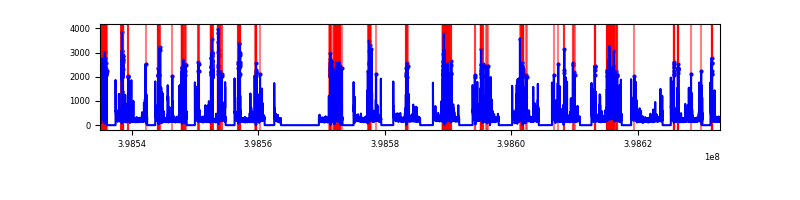 |
| B | 34786 | 23625 | 0 | 0 | 0.00% | 0.00% |  |
| C | 34786 | 23621 | 0 | 0 | 0.00% | 0.00% |  |
| D | 34786 | 23602 | 0 | 0 | 0.00% | 0.00% | 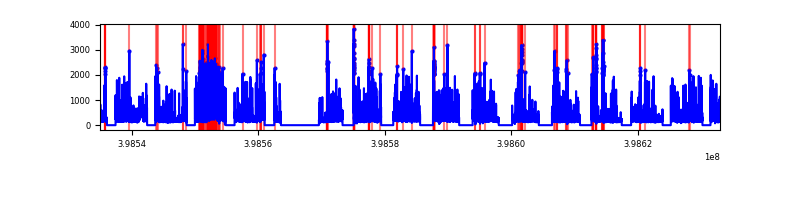 |
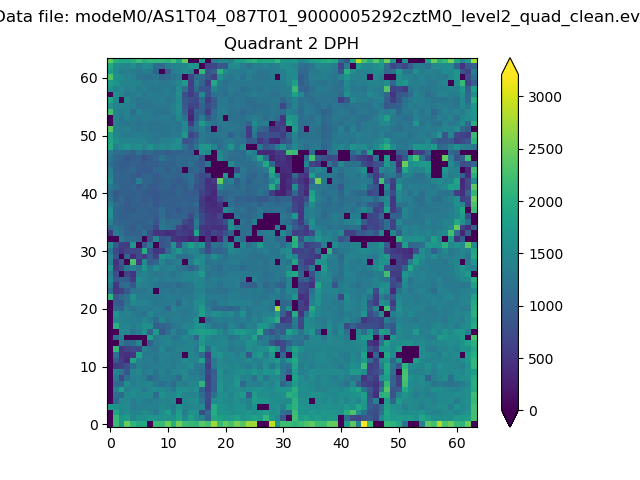
Top three noisy pixels from each quadrant. If the there are fewer than three noisy pixels in the level2.evt file, extra rows are filled as -1
| Pixel properties | Quadrant properties | ||||||
|---|---|---|---|---|---|---|---|
| Quadrant | DetID | PixID | Counts | Sigma | Mean | Median | Sigma |
| A | 9 | 19 | 1069 | 9.13 | 327 | 307 | 83.5 |
| A | 0 | 29 | 1019 | 8.53 | 327 | 307 | 83.5 |
| A | 7 | 110 | 993 | 8.22 | 327 | 307 | 83.5 |
| B | 2 | 9 | 1038 | 10.94 | 324 | 308 | 66.7 |
| B | 3 | 80 | 948 | 9.59 | 324 | 308 | 66.7 |
| B | 2 | 8 | 857 | 8.23 | 324 | 308 | 66.7 |
| C | 1 | 81 | 1051 | 8.81 | 324 | 304 | 84.8 |
| C | 1 | 80 | 1020 | 8.44 | 324 | 304 | 84.8 |
| C | 3 | 202 | 970 | 7.85 | 324 | 304 | 84.8 |
| D | 6 | 38 | 812 | 6.37 | 308 | 281 | 83.3 |
| D | 6 | 67 | 800 | 6.23 | 308 | 281 | 83.3 |
| D | 7 | 3 | 798 | 6.2 | 308 | 281 | 83.3 |
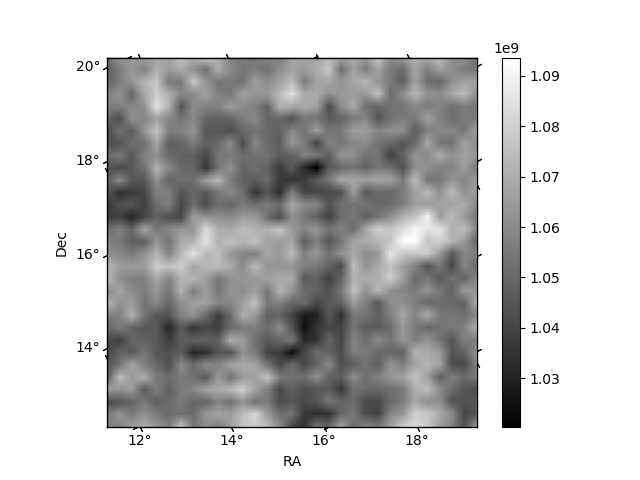
Histogram calculated using DETX and DETY for each event in the final _common_clean file
| Quadrant A | 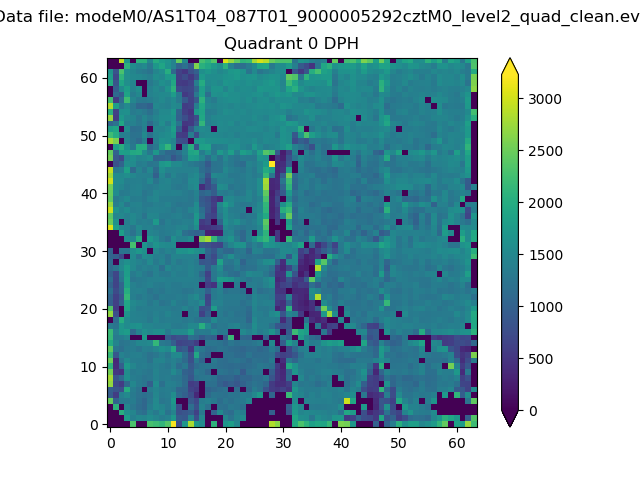 |
 |
Quadrant B |
|---|---|---|---|
| Quadrant D |  |
 |
Quadrant C |
| Plot type | Count rate plots | Images |
|---|---|---|
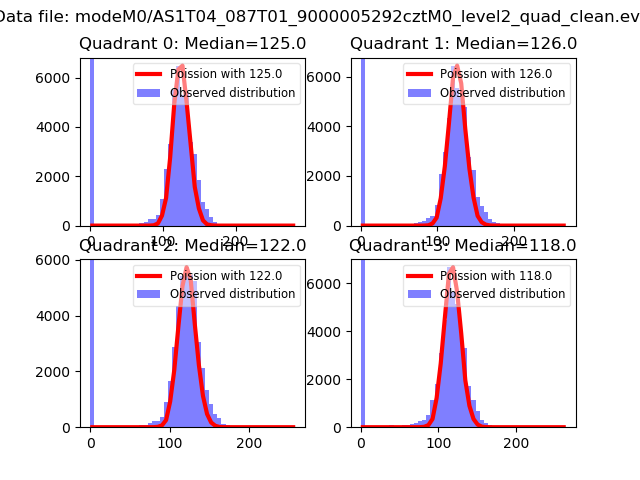
| Comparison with Poisson distribution Blue bars denote a histogram of data divided into 1 sec bins. Red curve is a Poisson curve with rate = median count rate of data. |
 |
 |
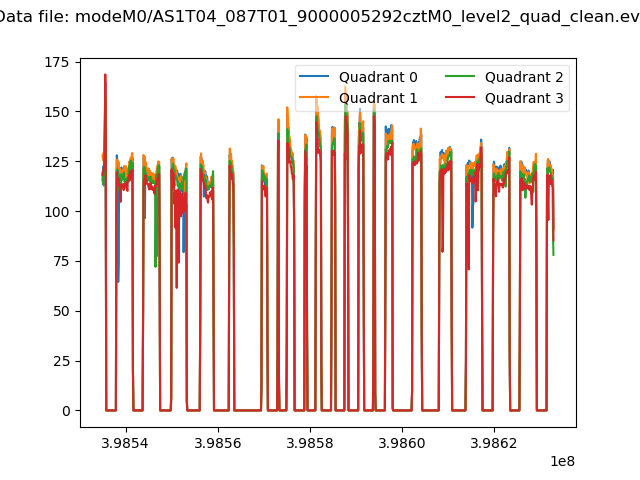
| Quadrant-wise count rates Data is divided into 100 sec bins |
 |
|
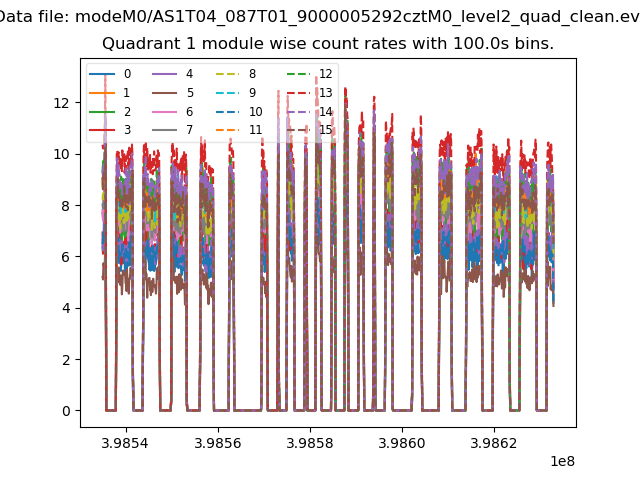
| Module-wise count rates for Quadrant A Data is divided into 100 sec bins |
 |
 |
| Module-wise count rates for Quadrant B Data is divided into 100 sec bins |
 |
 |
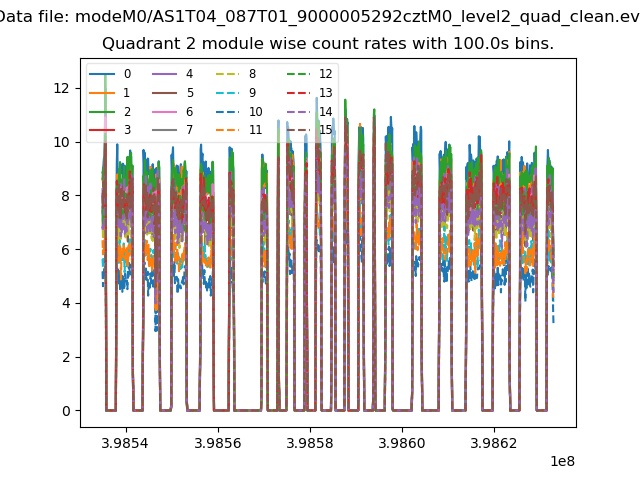
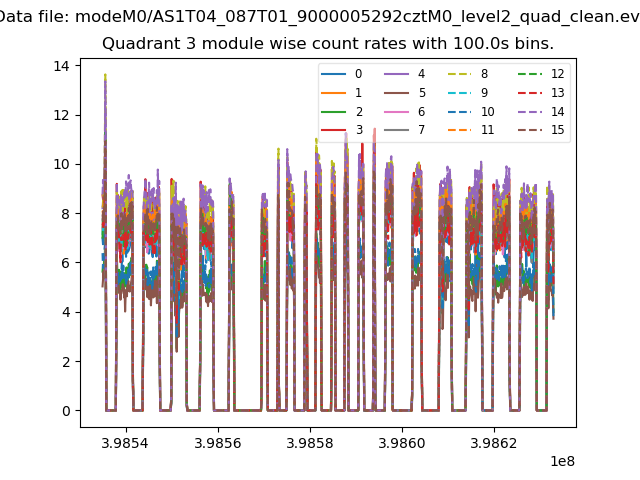
| Module-wise count rates for Quadrant C Data is divided into 100 sec bins |
 |
 |
| Module-wise count rates for Quadrant D Data is divided into 100 sec bins |
 |
 |
| Parameter | Plot |
|---|---|
| CZT HV Monitor | 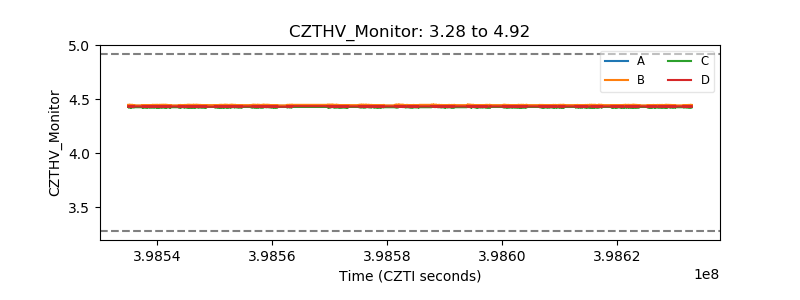 |
| D_VDD |  |
| Temperature 1 |  |
| Veto HV Monitor |  |
| Veto LLD |  |
| Alpha Counter |  |
| _CPM_Rate |  |
| CZT Counter | 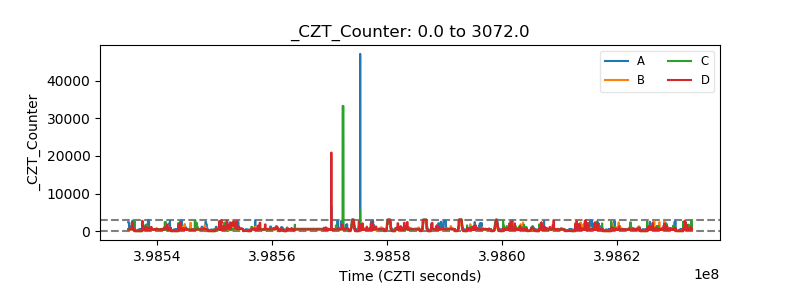 |
| +2.5 Volts monitor |  |
| +5 Volts monitor |  |
| _ROLL_ROT | 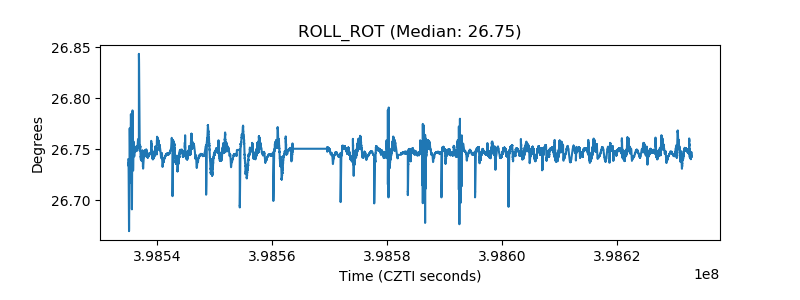 |
| _Roll_DEC |  |
| _Roll_RA |  |
| Veto Counter |  |