| Param | Original file | Final file |
|---|---|---|
| Filename | modeM0/AS1T04_087T01_9000005292_37250cztM0_level2.evt | modeM0/AS1T04_087T01_9000005292_37250cztM0_level2_quad_clean.evt |
| Size (bytes) | 180,483,840 | 21,913,920 |
| Size | 172.1 MB | 20.9 MB |
| Events in quadrant A | 1,755,939 | 129,440 |
| Events in quadrant B | 1,059,758 | 135,815 |
| Events in quadrant C | 1,478,810 | 127,679 |
| Events in quadrant D | 1,042,138 | 133,392 |
| Mode M9 | |||
|---|---|---|---|
| Quadrant | BADHDUFLAG | Total packets | Discarded packets |
| A | 0 | 14 | 0 |
| B | 0 | 14 | 0 |
| C | 0 | 14 | 0 |
| D | 0 | 14 | 0 |
| Mode SS | |||
|---|---|---|---|
| Quadrant | BADHDUFLAG | Total packets | Discarded packets |
| A | 0 | 40 | 0 |
| B | 0 | 40 | 0 |
| C | 0 | 40 | 0 |
| D | 0 | 40 | 0 |
| Mode M0 | |||
|---|---|---|---|
| Quadrant | BADHDUFLAG | Total packets | Discarded packets |
| A | 0 | 6474 | 2 |
| B | 0 | 4291 | 1 |
| C | 0 | 5537 | 1 |
| D | 0 | 4249 | 1 |
| Quadrant | Total seconds | Saturated seconds | Saturation percentage |
|---|---|---|---|
| A | 1870 | 218 | 11.657754% |
| B | 1870 | 7 | 0.374332% |
| C | 1870 | 113 | 6.042781% |
| D | 1870 | 28 | 1.497326% |
Noise dominated data is calculated using 1-second bins in cleaned event files. If a bin has >2000 counts, and if more than 50% of those come from <1% of pixels, then it is considered to be noise-dominated and hence unusable.
| Quadrant | # 1 sec bins | Bins with >0 counts | Bins with >2000 counts | High rate bins dominated by noise | Noise dominated (total time) | Noise dominated (detector-on time) | Marked lightcurve |
|---|---|---|---|---|---|---|---|
| A | 3244 | 1871 | 174 | 174 | 5.36% | 9.30% | 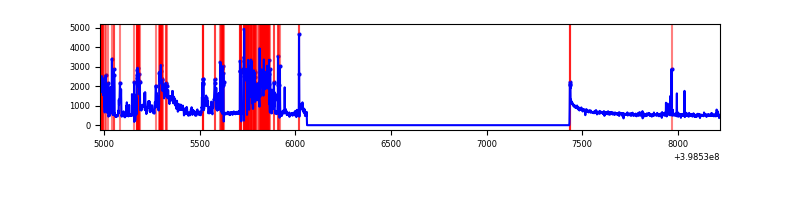 |
| B | 3244 | 1871 | 2 | 2 | 0.06% | 0.11% | 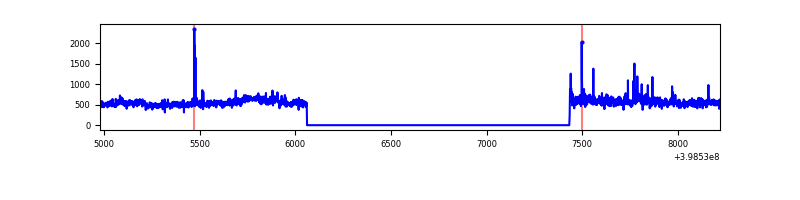 |
| C | 3244 | 1871 | 99 | 99 | 3.05% | 5.29% | 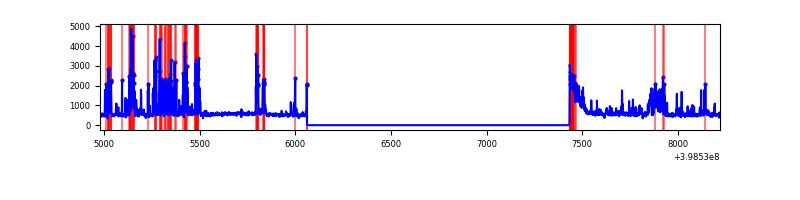 |
| D | 3244 | 1871 | 18 | 18 | 0.55% | 0.96% | 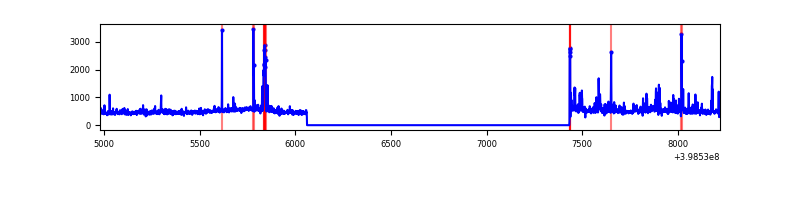 |
Top three noisy pixels from each quadrant. If the there are fewer than three noisy pixels in the level2.evt file, extra rows are filled as -1
| Pixel properties | Quadrant properties | ||||||
|---|---|---|---|---|---|---|---|
| Quadrant | DetID | PixID | Counts | Sigma | Mean | Median | Sigma |
| A | 15 | 237 | 741757 | 15758.07 | 225 | 220 | 47.1 |
| A | 10 | 83 | 119848 | 2542.16 | 225 | 220 | 47.1 |
| A | 13 | 248 | 14617 | 305.94 | 225 | 220 | 47.1 |
| B | 4 | 80 | 56120 | 1202.08 | 230 | 224 | 46.5 |
| B | 0 | 230 | 48288 | 1033.65 | 230 | 224 | 46.5 |
| B | 0 | 190 | 13857 | 293.19 | 230 | 224 | 46.5 |
| C | 1 | 23 | 338484 | 6313.57 | 219 | 220 | 53.6 |
| C | 14 | 254 | 119261 | 2221.86 | 219 | 220 | 53.6 |
| C | 0 | 10 | 81430 | 1515.75 | 219 | 220 | 53.6 |
| D | 2 | 250 | 31611 | 535.81 | 228 | 221 | 58.6 |
| D | 13 | 249 | 23280 | 393.6 | 228 | 221 | 58.6 |
| D | 2 | 153 | 19957 | 336.88 | 228 | 221 | 58.6 |
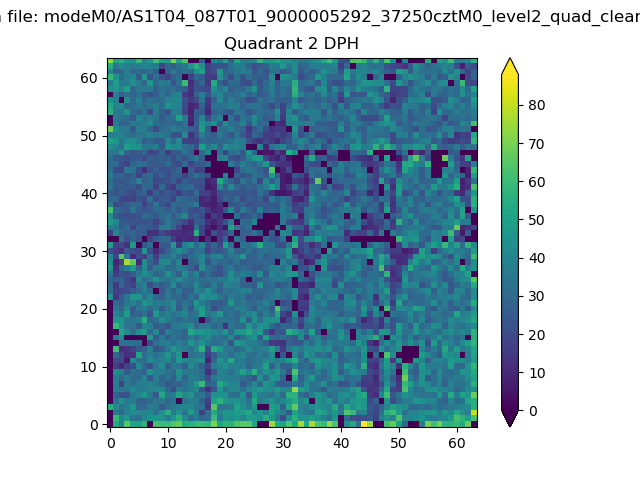
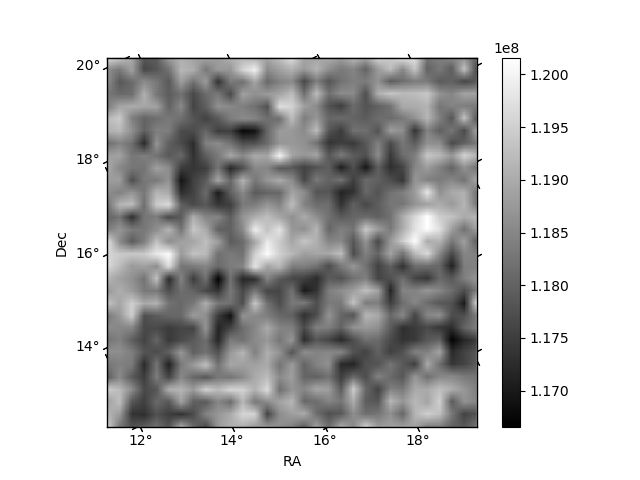
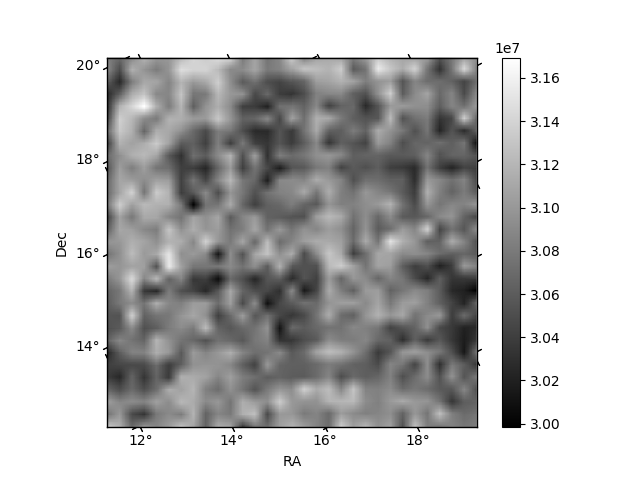
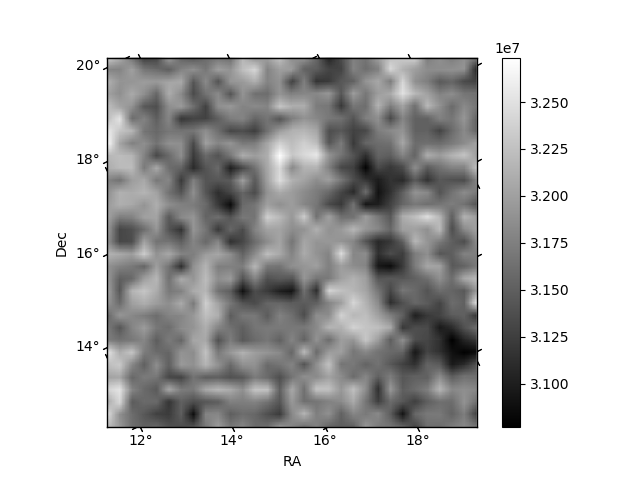
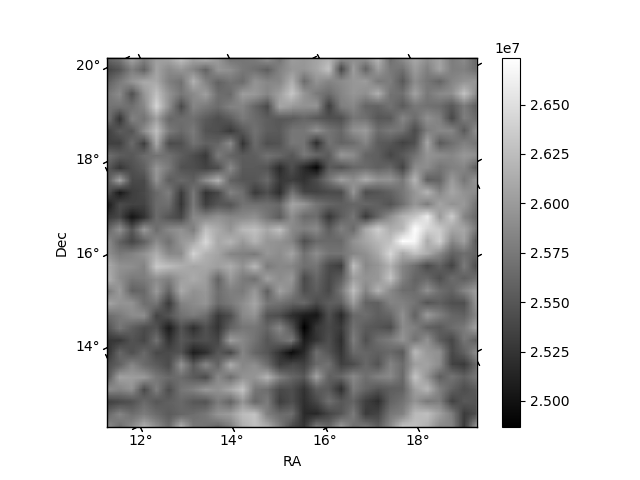
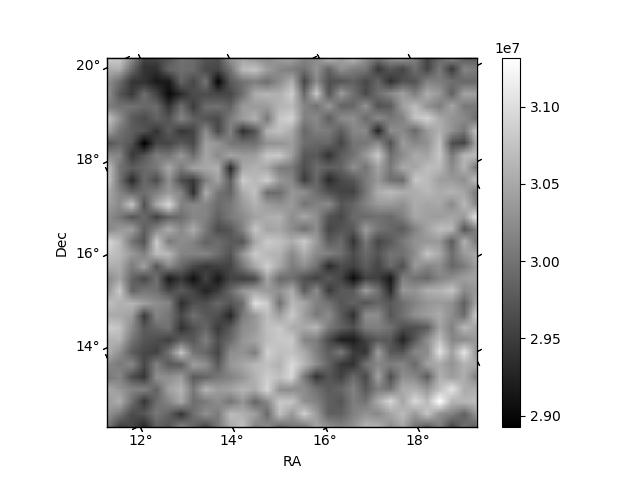
Histogram calculated using DETX and DETY for each event in the final _common_clean file
| Quadrant A | 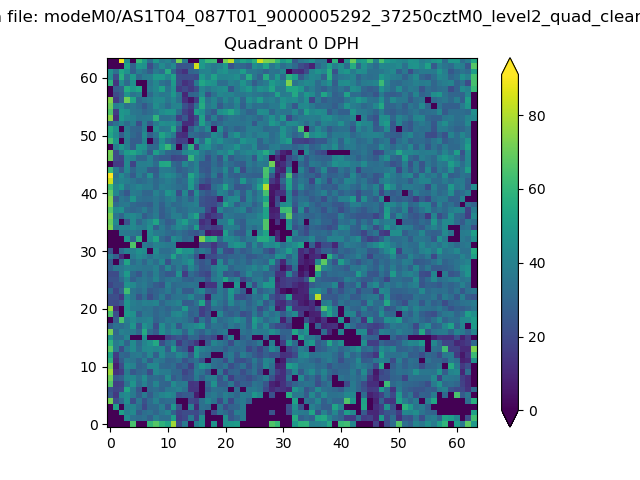 |
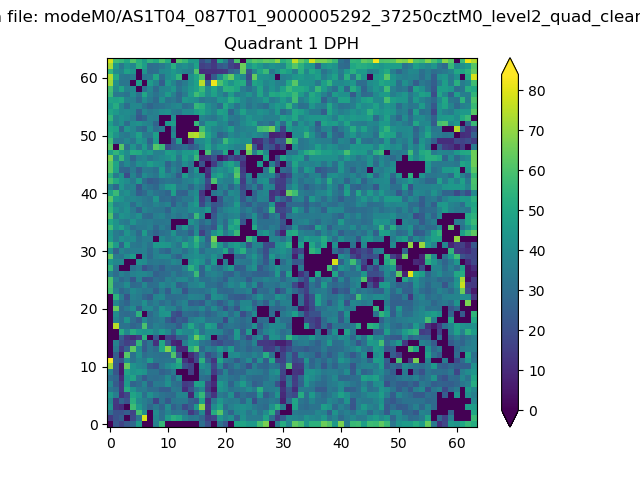 |
Quadrant B |
|---|---|---|---|
| Quadrant D | 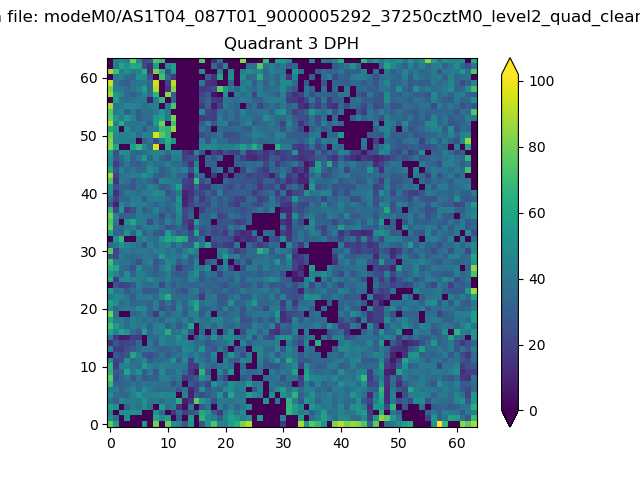 |
 |
Quadrant C |
| Plot type | Count rate plots | Images |
|---|---|---|
| Comparison with Poisson distribution Blue bars denote a histogram of data divided into 1 sec bins. Red curve is a Poisson curve with rate = median count rate of data. |
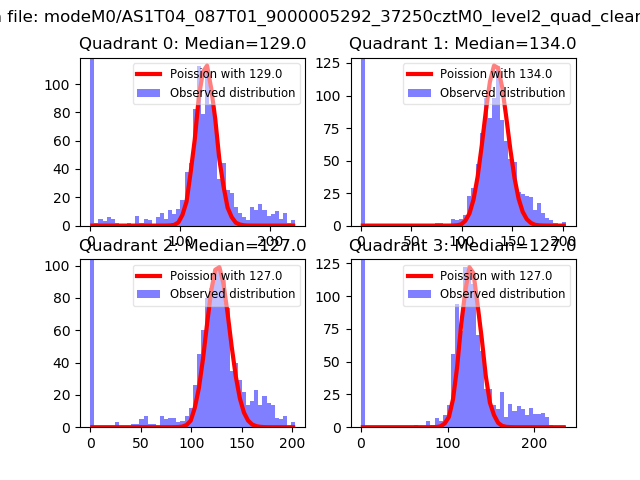 |
 |
| Quadrant-wise count rates Data is divided into 100 sec bins |
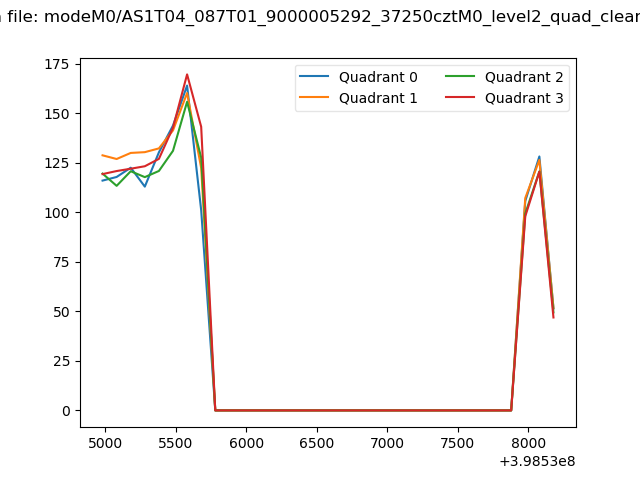 |
|
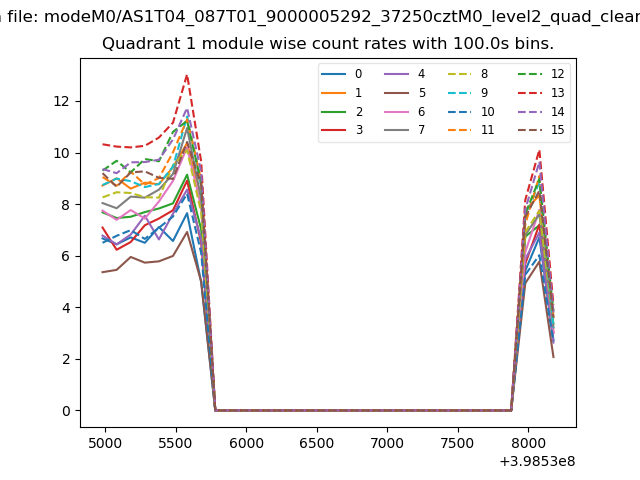
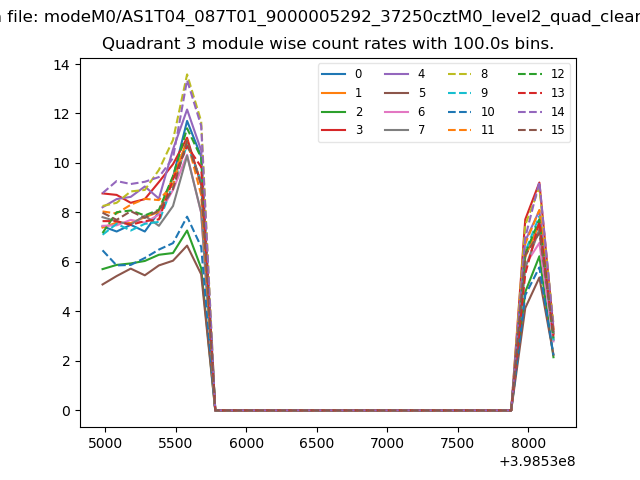
| Module-wise count rates for Quadrant A Data is divided into 100 sec bins |
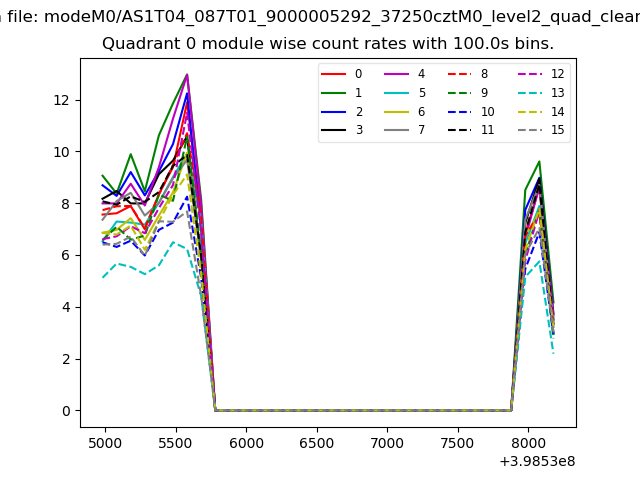 |
 |
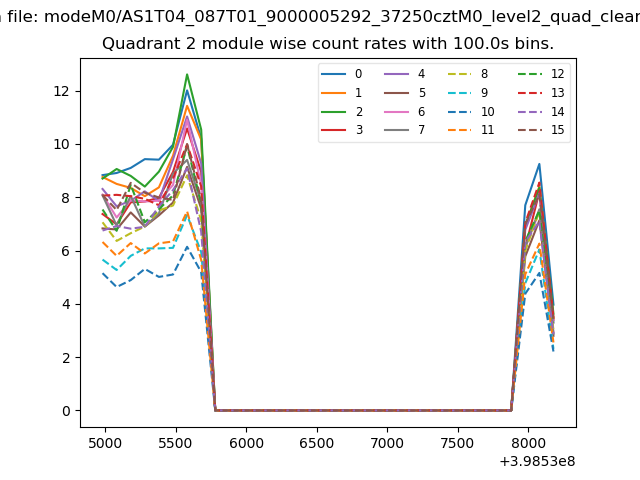
| Module-wise count rates for Quadrant B Data is divided into 100 sec bins |
 |
 |
| Module-wise count rates for Quadrant C Data is divided into 100 sec bins |
 |
 |
| Module-wise count rates for Quadrant D Data is divided into 100 sec bins |
 |
 |
| Parameter | Plot |
|---|---|
| CZT HV Monitor | 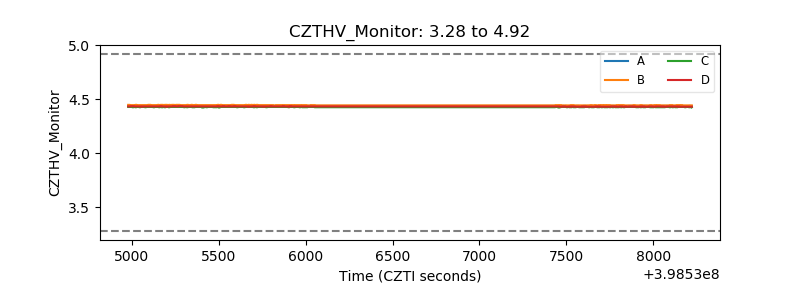 |
| D_VDD |  |
| Temperature 1 | 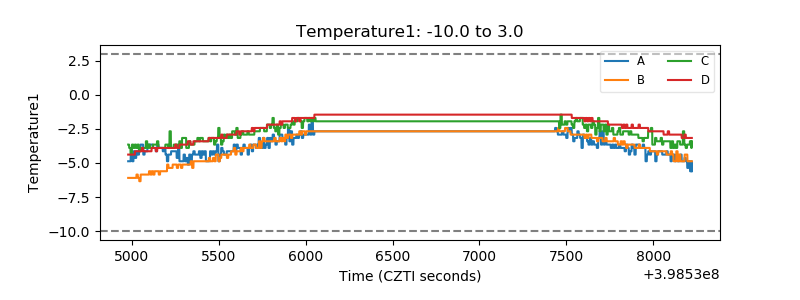 |
| Veto HV Monitor | 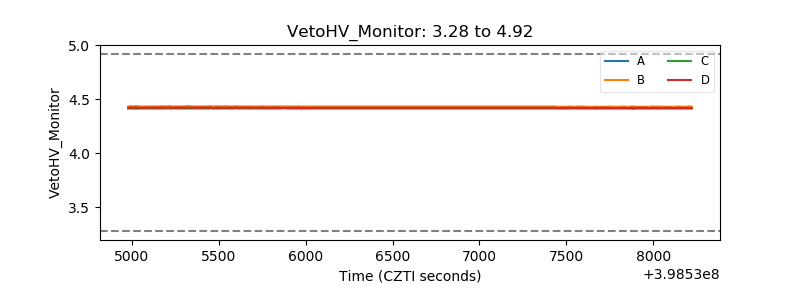 |
| Veto LLD | 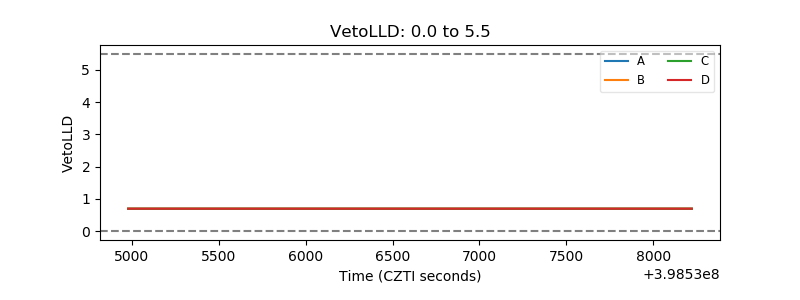 |
| Alpha Counter | 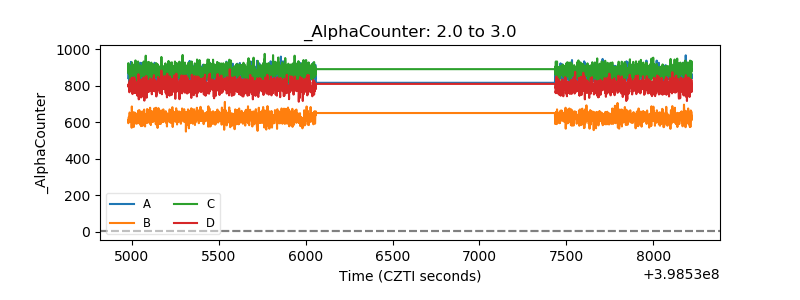 |
| _CPM_Rate | 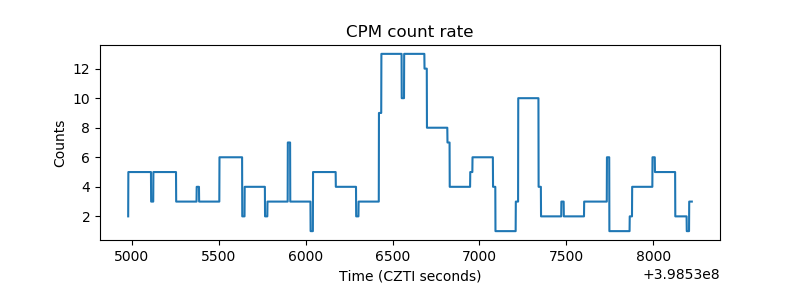 |
| CZT Counter | 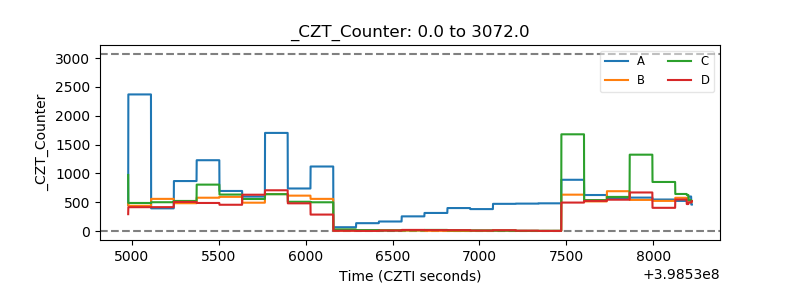 |
| +2.5 Volts monitor | 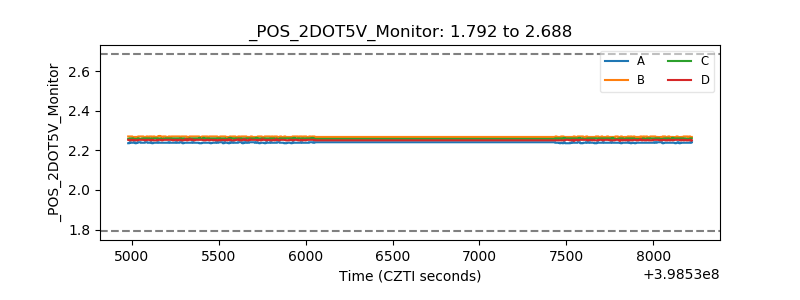 |
| +5 Volts monitor | 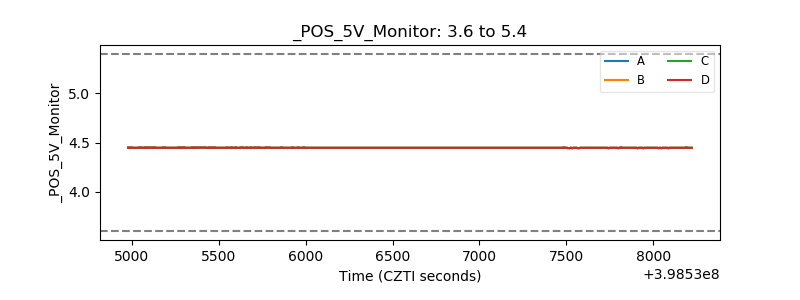 |
| _ROLL_ROT | 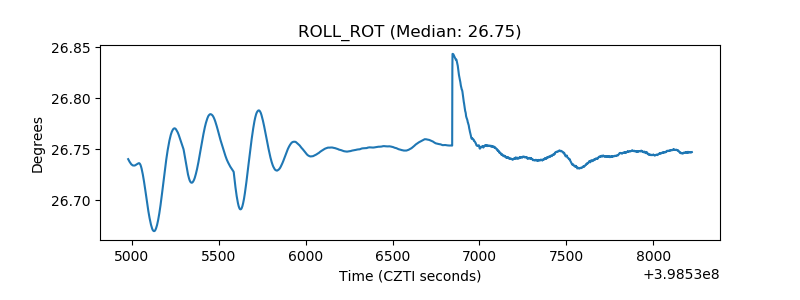 |
| _Roll_DEC | 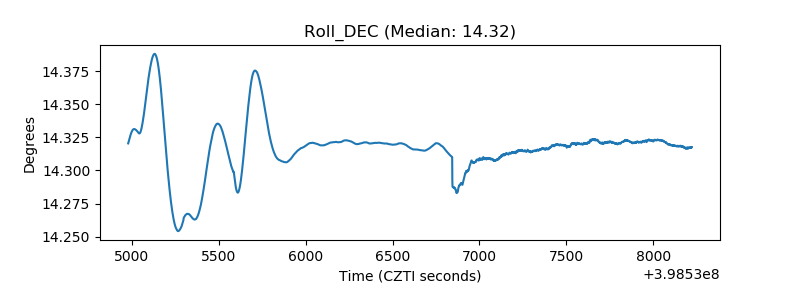 |
| _Roll_RA | 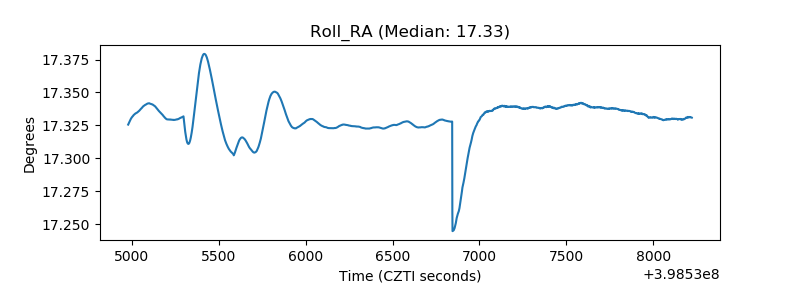 |
| Veto Counter | 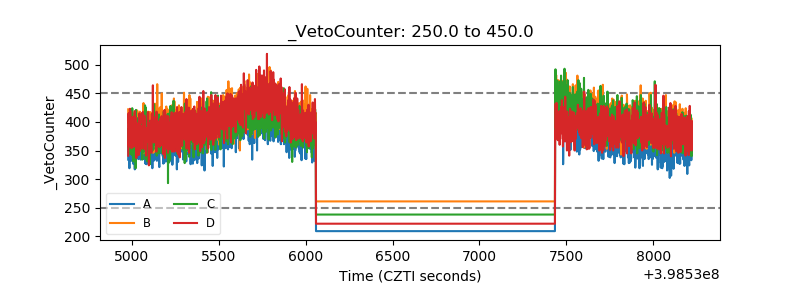 |