| Param | Original file | Final file |
|---|---|---|
| Filename | modeM0/AS1T04_087T01_9000005292_37251cztM0_level2.evt | modeM0/AS1T04_087T01_9000005292_37251cztM0_level2_quad_clean.evt |
| Size (bytes) | 468,221,760 | 83,456,640 |
| Size | 446.5 MB | 79.6 MB |
| Events in quadrant A | 3,727,120 | 527,051 |
| Events in quadrant B | 3,048,191 | 547,169 |
| Events in quadrant C | 3,525,275 | 524,797 |
| Events in quadrant D | 3,474,611 | 511,478 |
| Mode M9 | |||
|---|---|---|---|
| Quadrant | BADHDUFLAG | Total packets | Discarded packets |
| A | 0 | 25 | 0 |
| B | 0 | 25 | 0 |
| C | 0 | 25 | 0 |
| D | 0 | 25 | 0 |
| Mode SS | |||
|---|---|---|---|
| Quadrant | BADHDUFLAG | Total packets | Discarded packets |
| A | 0 | 122 | 0 |
| B | 0 | 122 | 0 |
| C | 0 | 122 | 0 |
| D | 0 | 122 | 0 |
| Mode M0 | |||
|---|---|---|---|
| Quadrant | BADHDUFLAG | Total packets | Discarded packets |
| A | 0 | 14945 | 3 |
| B | 0 | 12905 | 2 |
| C | 0 | 14130 | 2 |
| D | 0 | 14438 | 2 |
| Quadrant | Total seconds | Saturated seconds | Saturation percentage |
|---|---|---|---|
| A | 5962 | 238 | 3.991949% |
| B | 5962 | 25 | 0.419322% |
| C | 5962 | 126 | 2.113385% |
| D | 5962 | 63 | 1.056692% |
Noise dominated data is calculated using 1-second bins in cleaned event files. If a bin has >2000 counts, and if more than 50% of those come from <1% of pixels, then it is considered to be noise-dominated and hence unusable.
| Quadrant | # 1 sec bins | Bins with >0 counts | Bins with >2000 counts | High rate bins dominated by noise | Noise dominated (total time) | Noise dominated (detector-on time) | Marked lightcurve |
|---|---|---|---|---|---|---|---|
| A | 7246 | 5963 | 200 | 200 | 2.76% | 3.35% | 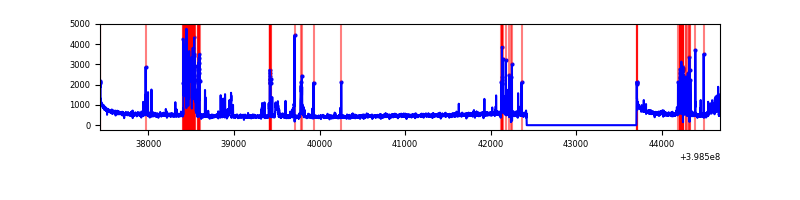 |
| B | 7246 | 5963 | 5 | 5 | 0.07% | 0.08% | 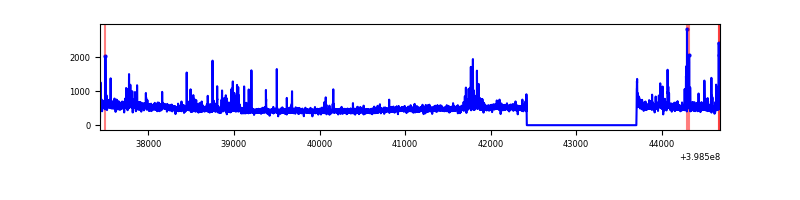 |
| C | 7246 | 5963 | 104 | 104 | 1.44% | 1.74% | 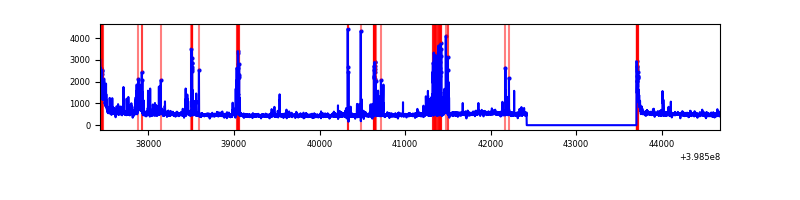 |
| D | 7246 | 5963 | 57 | 57 | 0.79% | 0.96% | 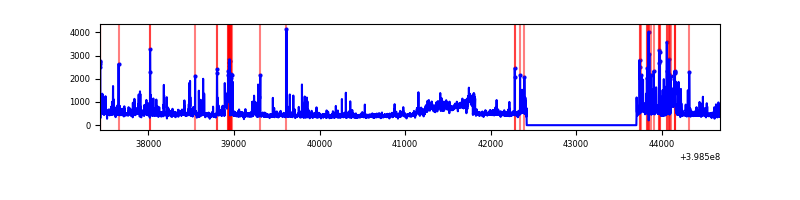 |
Top three noisy pixels from each quadrant. If the there are fewer than three noisy pixels in the level2.evt file, extra rows are filled as -1
| Pixel properties | Quadrant properties | ||||||
|---|---|---|---|---|---|---|---|
| Quadrant | DetID | PixID | Counts | Sigma | Mean | Median | Sigma |
| A | 15 | 237 | 769828 | 5666.13 | 671 | 658 | 135.7 |
| A | 10 | 83 | 289069 | 2124.59 | 671 | 658 | 135.7 |
| A | 13 | 248 | 51096 | 371.55 | 671 | 658 | 135.7 |
| B | 0 | 230 | 123438 | 931.89 | 680 | 662 | 131.7 |
| B | 0 | 190 | 96716 | 729.07 | 680 | 662 | 131.7 |
| B | 5 | 255 | 27377 | 202.77 | 680 | 662 | 131.7 |
| C | 1 | 23 | 315144 | 2018.56 | 659 | 663 | 155.8 |
| C | 15 | 214 | 250972 | 1606.66 | 659 | 663 | 155.8 |
| C | 14 | 254 | 225078 | 1440.45 | 659 | 663 | 155.8 |
| D | 13 | 171 | 389302 | 2401.85 | 663 | 644 | 161.8 |
| D | 12 | 218 | 121203 | 745.03 | 663 | 644 | 161.8 |
| D | 2 | 153 | 101870 | 625.56 | 663 | 644 | 161.8 |
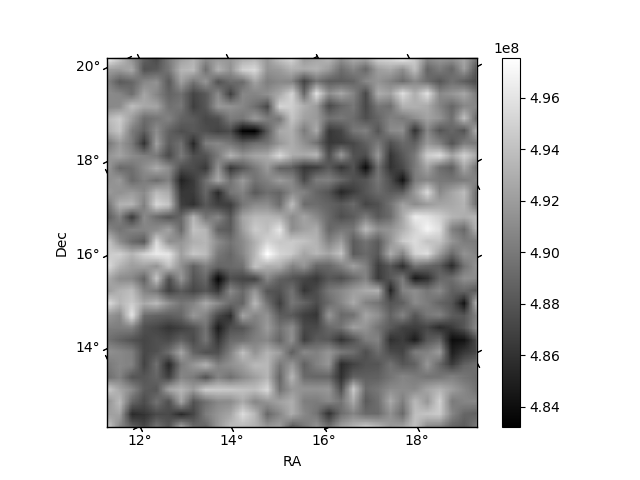
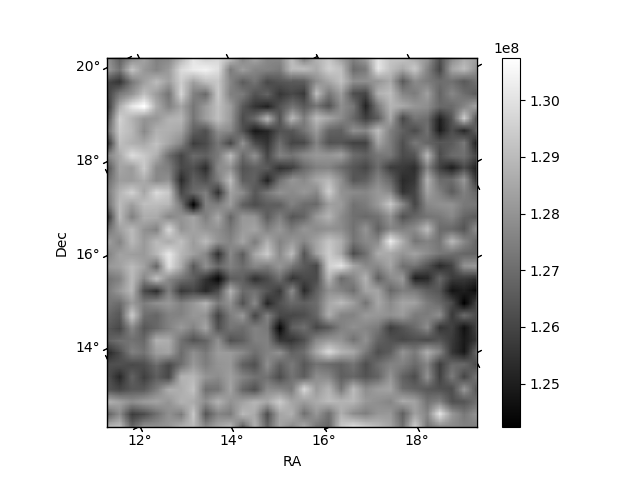
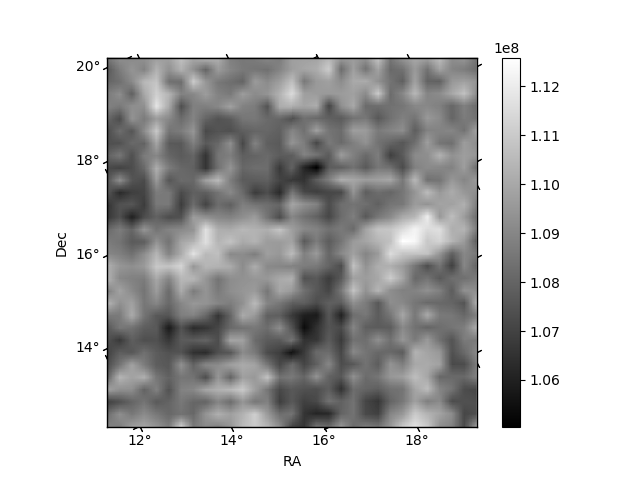
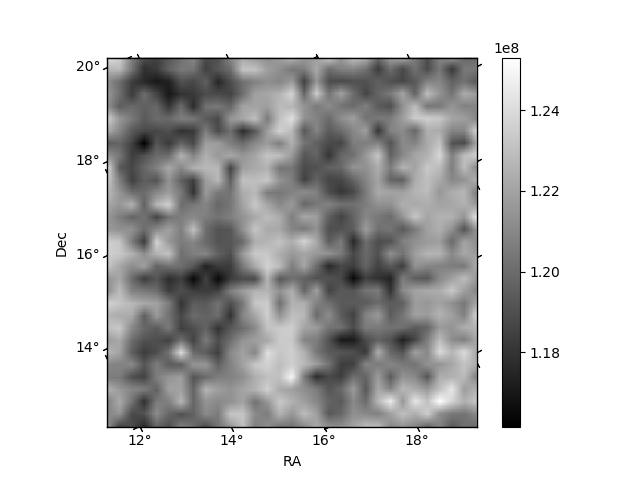
Histogram calculated using DETX and DETY for each event in the final _common_clean file
| Quadrant A | 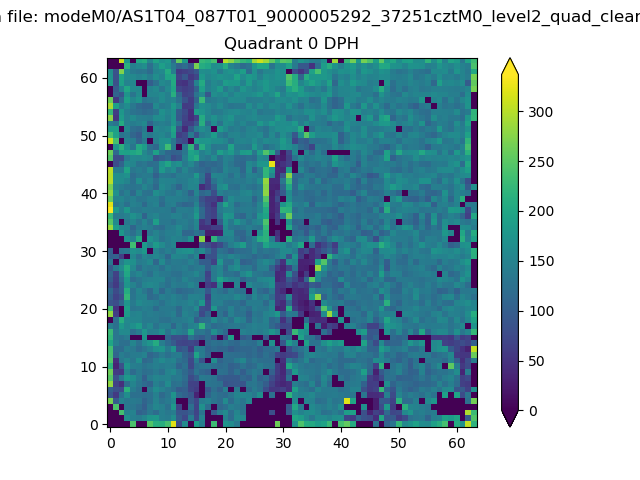 |
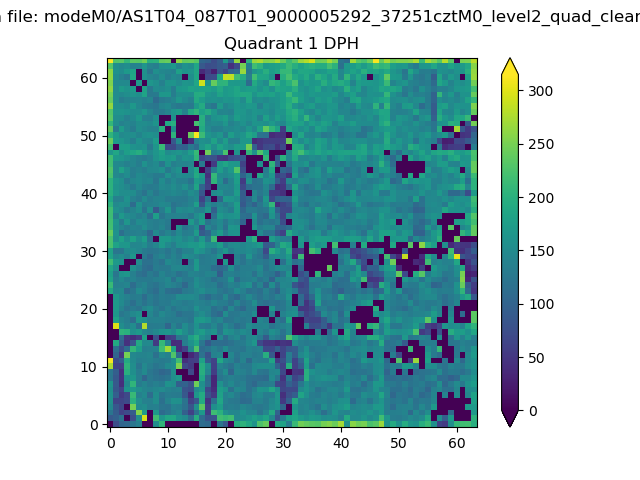 |
Quadrant B |
|---|---|---|---|
| Quadrant D | 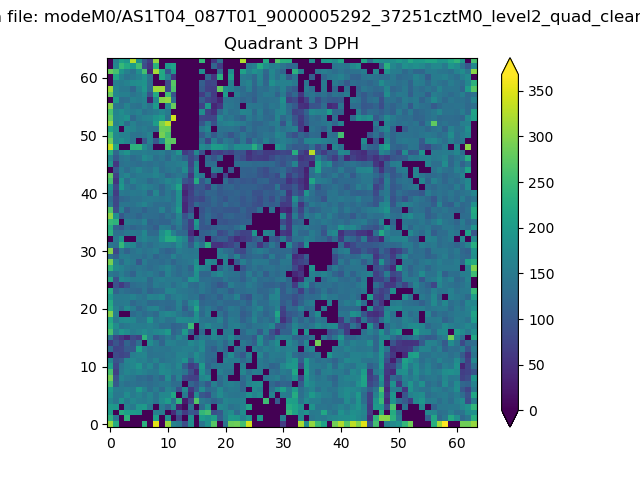 |
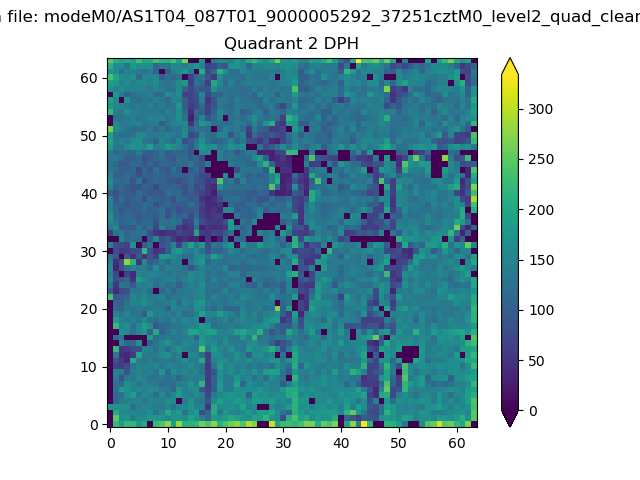 |
Quadrant C |
| Plot type | Count rate plots | Images |
|---|---|---|
| Comparison with Poisson distribution Blue bars denote a histogram of data divided into 1 sec bins. Red curve is a Poisson curve with rate = median count rate of data. |
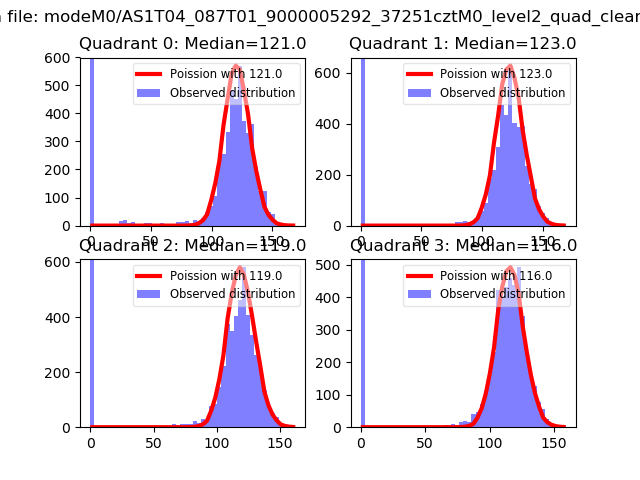 |
 |
| Quadrant-wise count rates Data is divided into 100 sec bins |
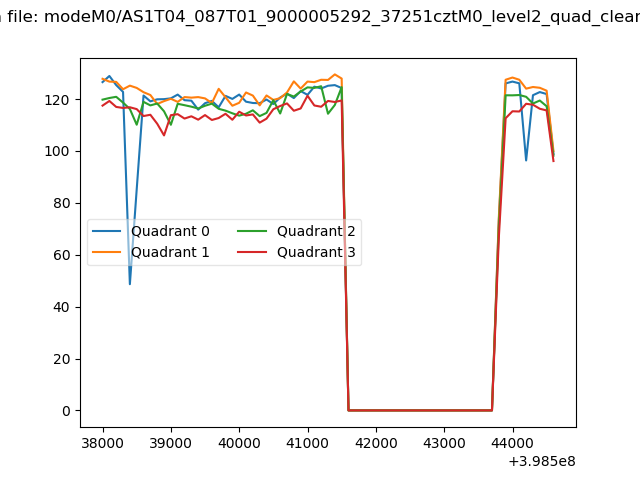 |
|
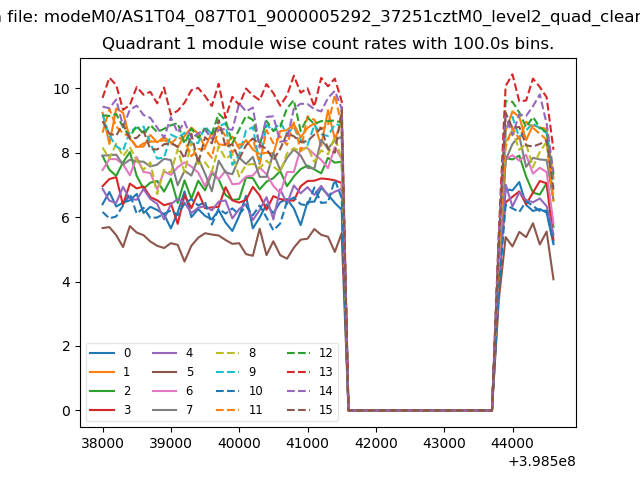
| Module-wise count rates for Quadrant A Data is divided into 100 sec bins |
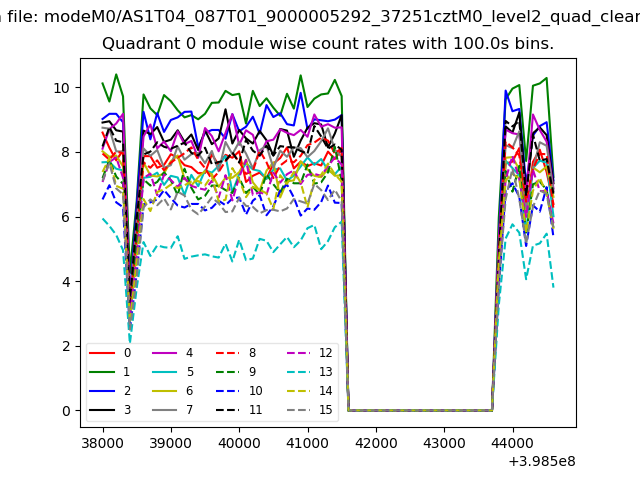 |
 |
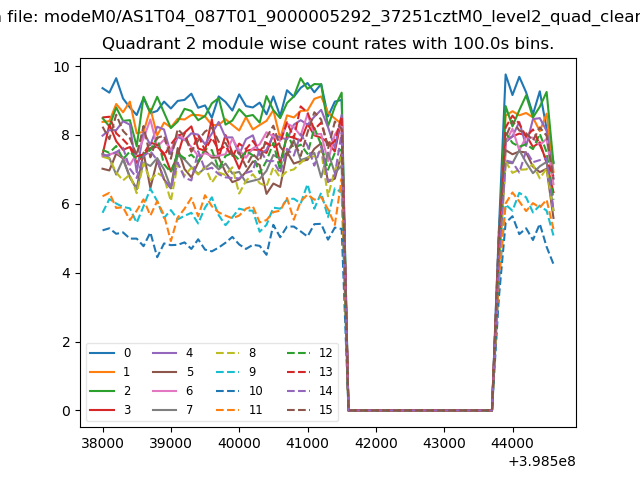
| Module-wise count rates for Quadrant B Data is divided into 100 sec bins |
 |
 |
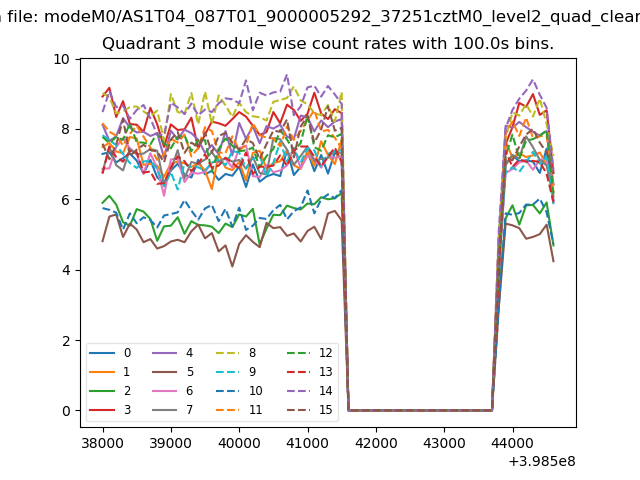
| Module-wise count rates for Quadrant C Data is divided into 100 sec bins |
 |
 |
| Module-wise count rates for Quadrant D Data is divided into 100 sec bins |
 |
 |
| Parameter | Plot |
|---|---|
| CZT HV Monitor | 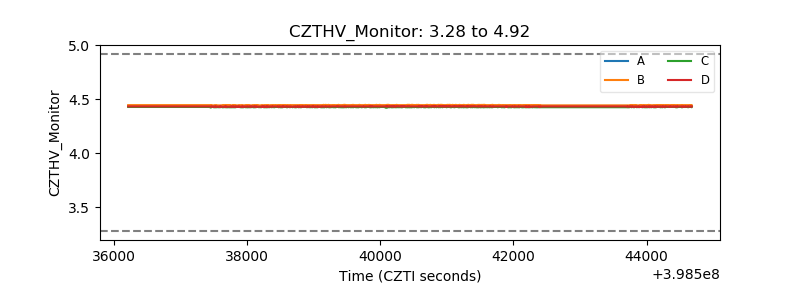 |
| D_VDD | 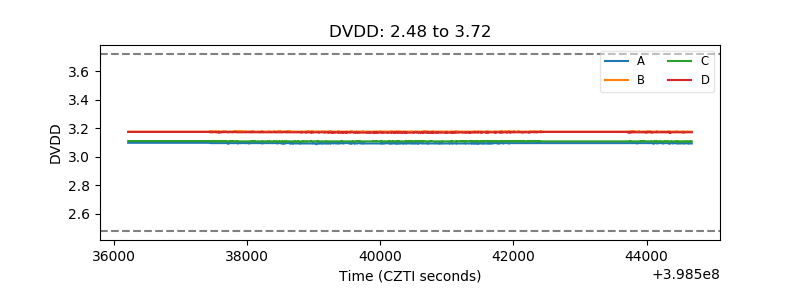 |
| Temperature 1 | 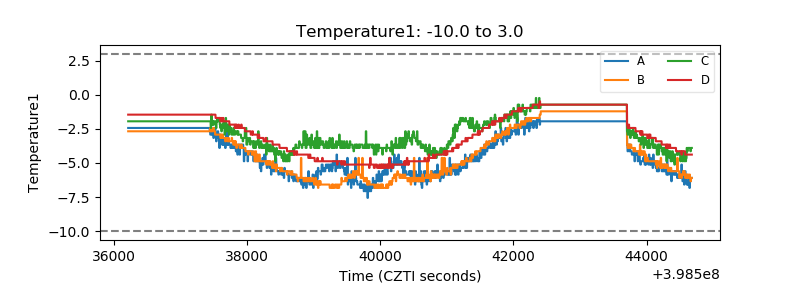 |
| Veto HV Monitor | 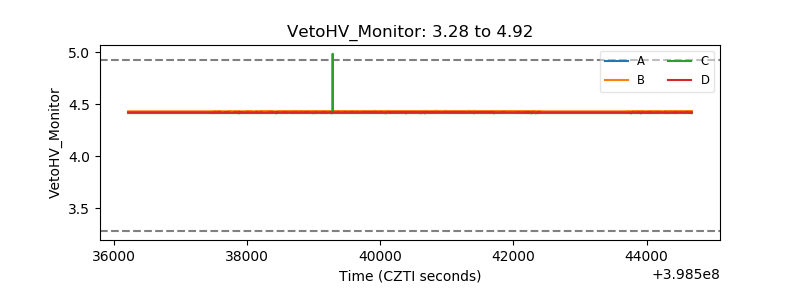 |
| Veto LLD | 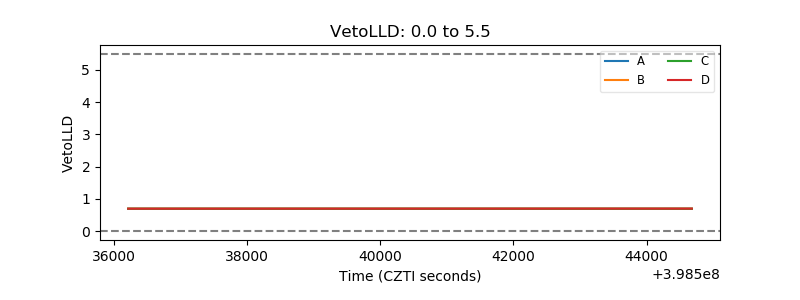 |
| Alpha Counter | 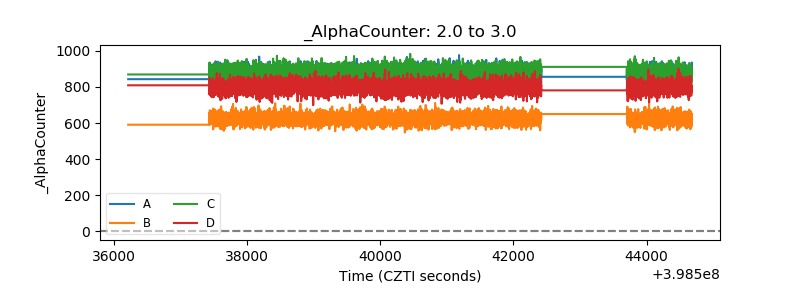 |
| _CPM_Rate | 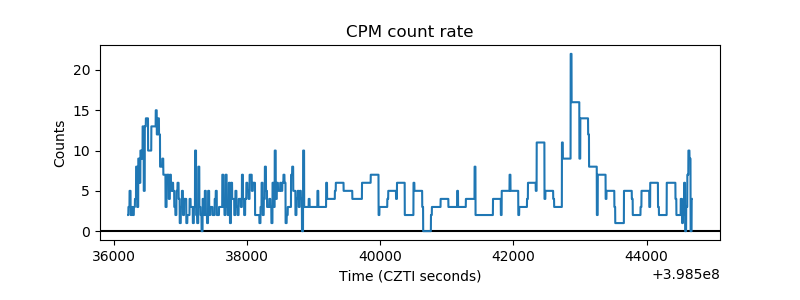 |
| CZT Counter | 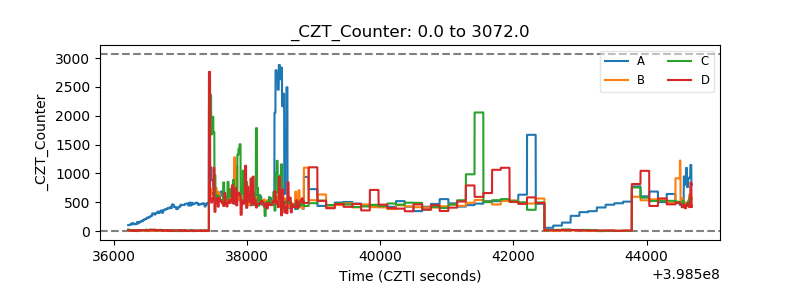 |
| +2.5 Volts monitor | 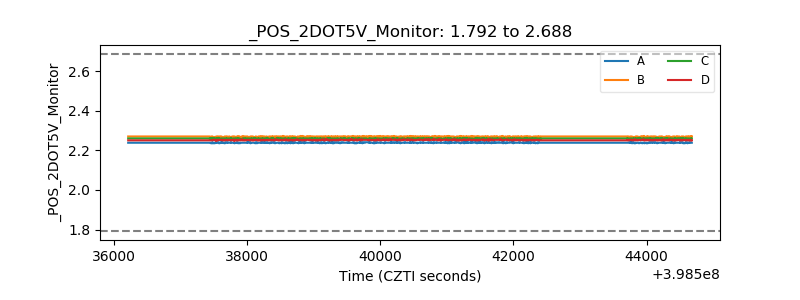 |
| +5 Volts monitor | 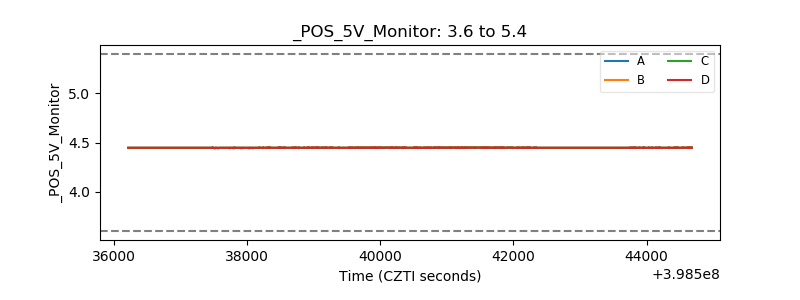 |
| _ROLL_ROT | 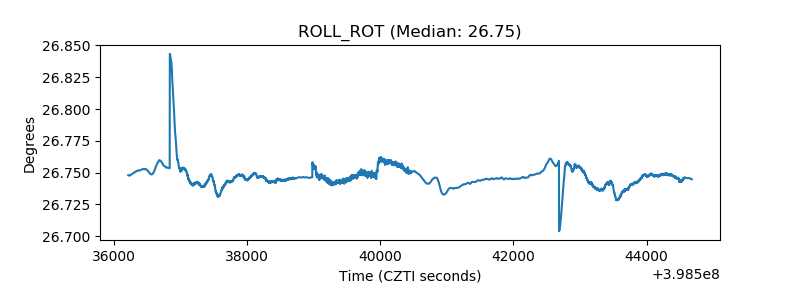 |
| _Roll_DEC | 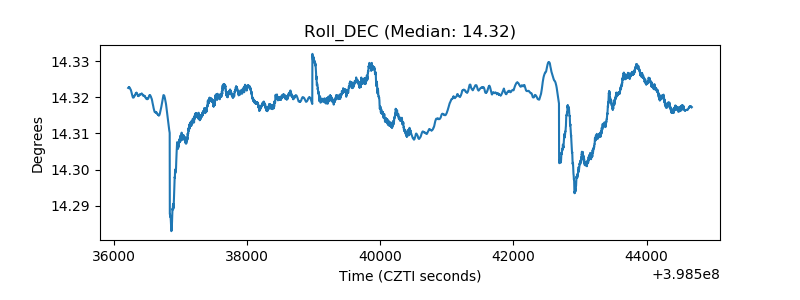 |
| _Roll_RA | 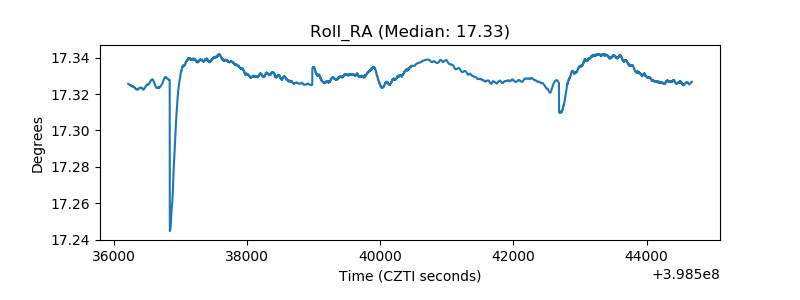 |
| Veto Counter | 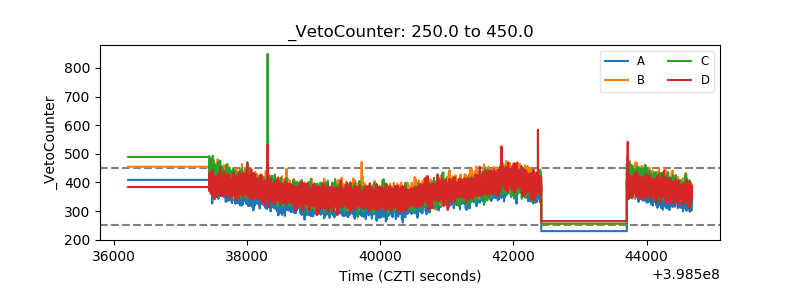 |