| Param | Original file | Final file |
|---|---|---|
| Filename | modeM0/AS1T04_087T01_9000005292_37254cztM0_level2.evt | modeM0/AS1T04_087T01_9000005292_37254cztM0_level2_quad_clean.evt |
| Size (bytes) | 1,356,943,680 | 204,500,160 |
| Size | 1.3 GB | 195.0 MB |
| Events in quadrant A | 10,036,185 | 1,285,436 |
| Events in quadrant B | 8,845,535 | 1,304,758 |
| Events in quadrant C | 8,989,083 | 1,261,651 |
| Events in quadrant D | 12,112,327 | 1,204,822 |
| Mode M9 | |||
|---|---|---|---|
| Quadrant | BADHDUFLAG | Total packets | Discarded packets |
| A | 0 | 54 | 0 |
| B | 0 | 54 | 0 |
| C | 0 | 54 | 0 |
| D | 0 | 54 | 0 |
| Mode SS | |||
|---|---|---|---|
| Quadrant | BADHDUFLAG | Total packets | Discarded packets |
| A | 0 | 340 | 0 |
| B | 0 | 340 | 0 |
| C | 0 | 340 | 0 |
| D | 0 | 340 | 0 |
| Mode M0 | |||
|---|---|---|---|
| Quadrant | BADHDUFLAG | Total packets | Discarded packets |
| A | 0 | 41059 | 5 |
| B | 0 | 37163 | 4 |
| C | 0 | 37068 | 4 |
| D | 0 | 47603 | 4 |
| Quadrant | Total seconds | Saturated seconds | Saturation percentage |
|---|---|---|---|
| A | 16474 | 645 | 3.915260% |
| B | 16474 | 168 | 1.019789% |
| C | 16474 | 226 | 1.371859% |
| D | 16474 | 1034 | 6.276557% |
Noise dominated data is calculated using 1-second bins in cleaned event files. If a bin has >2000 counts, and if more than 50% of those come from <1% of pixels, then it is considered to be noise-dominated and hence unusable.
| Quadrant | # 1 sec bins | Bins with >0 counts | Bins with >2000 counts | High rate bins dominated by noise | Noise dominated (total time) | Noise dominated (detector-on time) | Marked lightcurve |
|---|---|---|---|---|---|---|---|
| A | 21996 | 16478 | 468 | 468 | 2.13% | 2.84% | 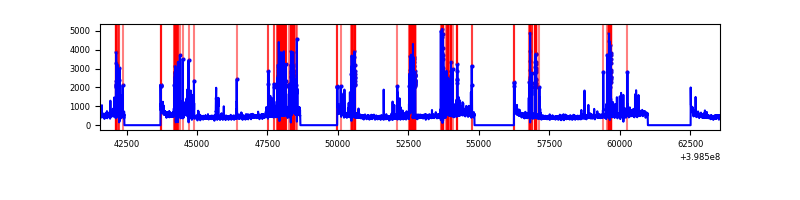 |
| B | 21996 | 16478 | 79 | 79 | 0.36% | 0.48% | 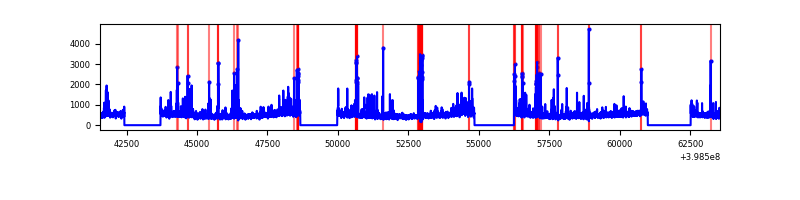 |
| C | 21996 | 16478 | 205 | 205 | 0.93% | 1.24% | 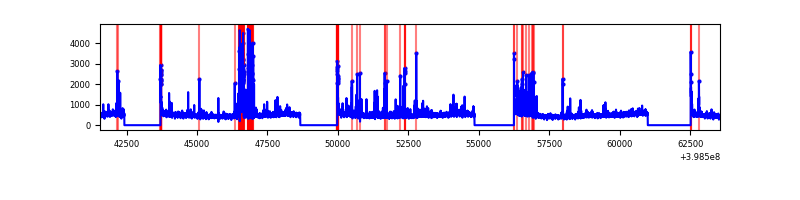 |
| D | 21996 | 16478 | 1033 | 1033 | 4.70% | 6.27% | 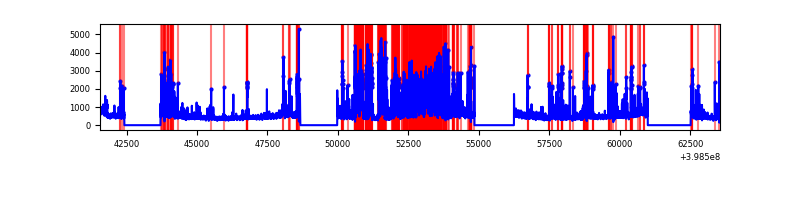 |
Top three noisy pixels from each quadrant. If the there are fewer than three noisy pixels in the level2.evt file, extra rows are filled as -1
| Pixel properties | Quadrant properties | ||||||
|---|---|---|---|---|---|---|---|
| Quadrant | DetID | PixID | Counts | Sigma | Mean | Median | Sigma |
| A | 15 | 237 | 1993250 | 5333.1 | 1853 | 1818 | 373.4 |
| A | 10 | 83 | 684533 | 1828.33 | 1853 | 1818 | 373.4 |
| A | 13 | 248 | 90228 | 236.76 | 1853 | 1818 | 373.4 |
| B | 0 | 190 | 269979 | 751.8 | 1864 | 1814 | 356.7 |
| B | 5 | 172 | 269718 | 751.07 | 1864 | 1814 | 356.7 |
| B | 0 | 213 | 251487 | 699.96 | 1864 | 1814 | 356.7 |
| C | 14 | 254 | 788937 | 1857.09 | 1809 | 1819 | 423.8 |
| C | 15 | 214 | 688563 | 1620.27 | 1809 | 1819 | 423.8 |
| C | 0 | 10 | 198721 | 464.56 | 1809 | 1819 | 423.8 |
| D | 2 | 249 | 3903530 | 8996.11 | 1794 | 1745 | 433.7 |
| D | 13 | 249 | 280450 | 642.59 | 1794 | 1745 | 433.7 |
| D | 13 | 171 | 203591 | 465.38 | 1794 | 1745 | 433.7 |
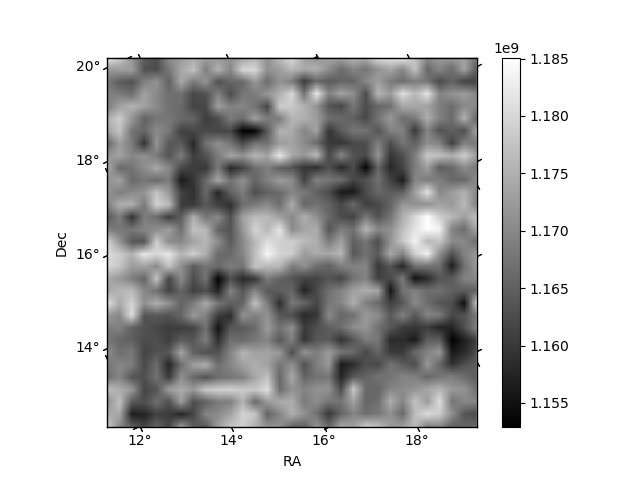
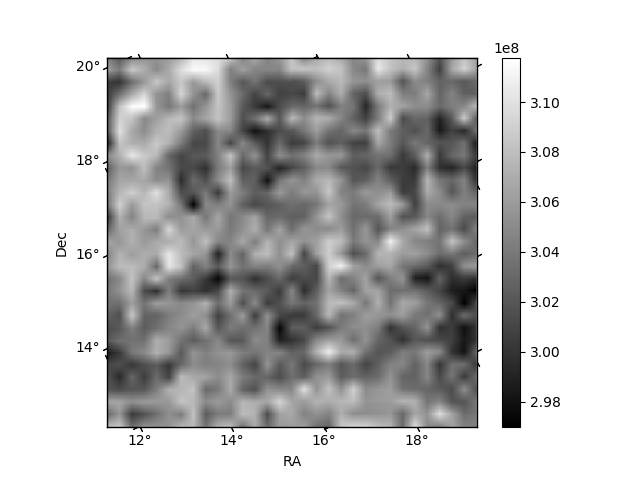
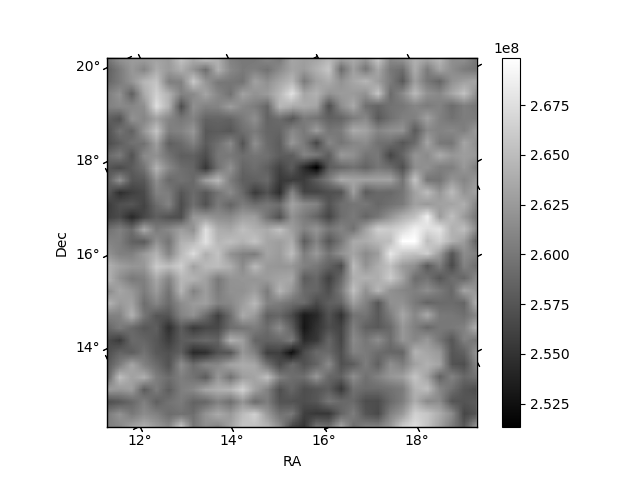
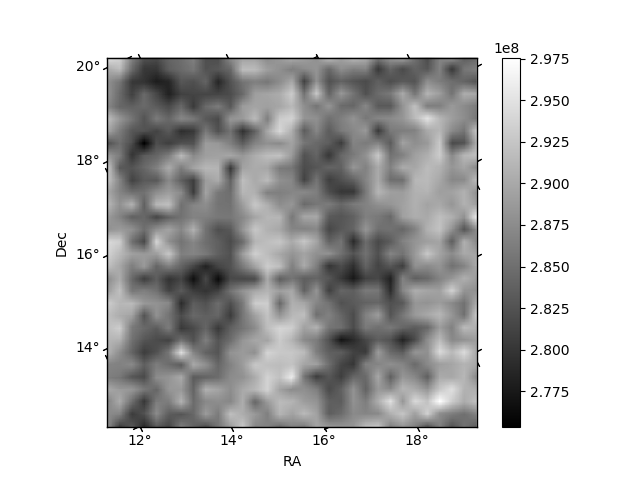
Histogram calculated using DETX and DETY for each event in the final _common_clean file
| Quadrant A | 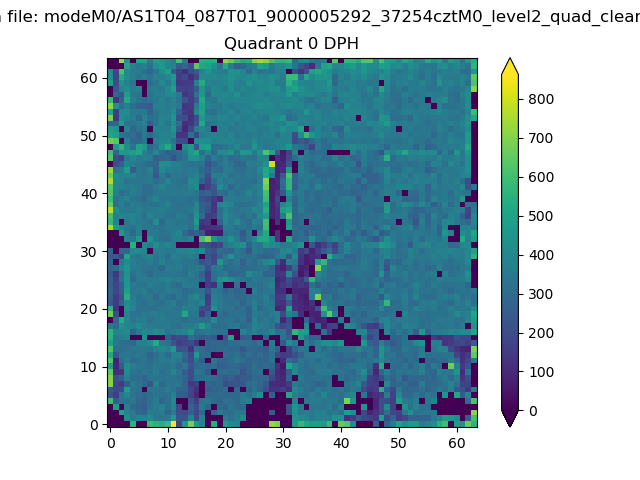 |
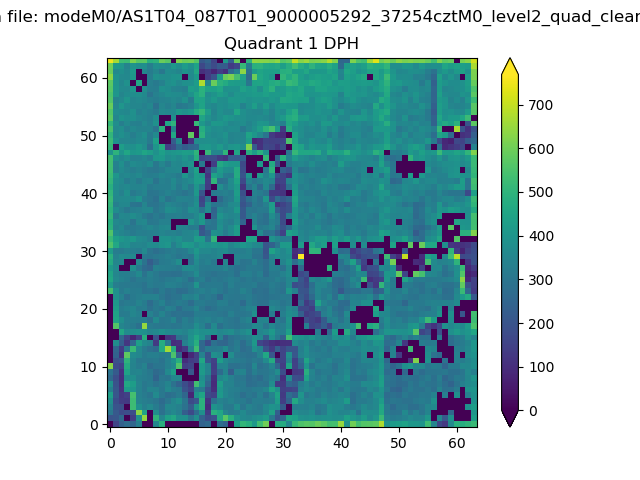 |
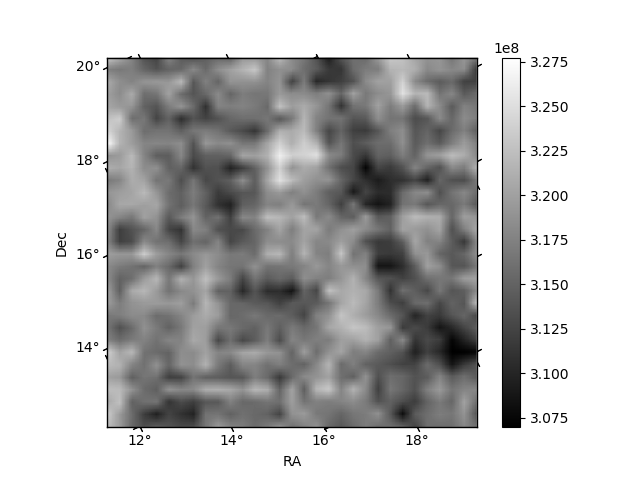
Quadrant B |
|---|---|---|---|
| Quadrant D | 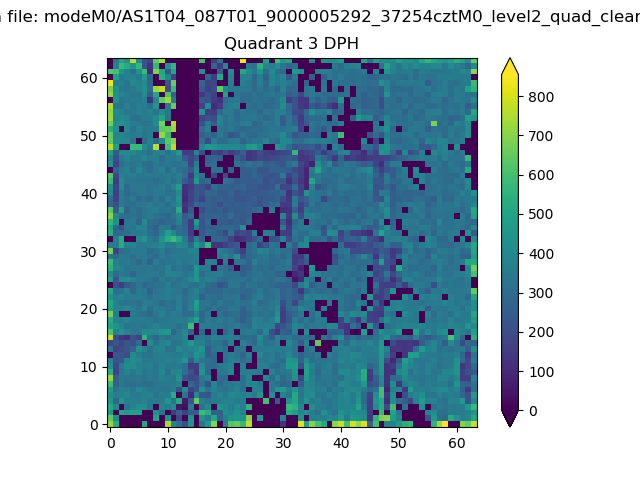 |
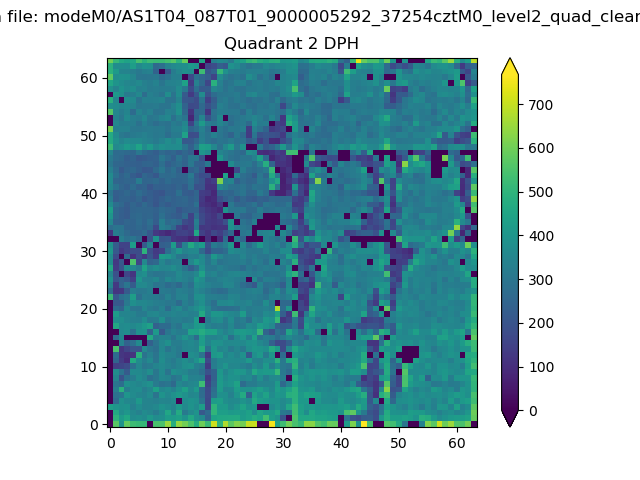 |
Quadrant C |
| Plot type | Count rate plots | Images |
|---|---|---|
| Comparison with Poisson distribution Blue bars denote a histogram of data divided into 1 sec bins. Red curve is a Poisson curve with rate = median count rate of data. |
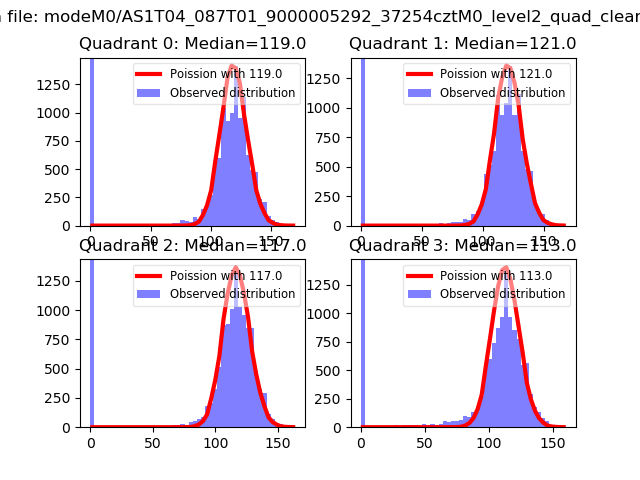 |
 |
| Quadrant-wise count rates Data is divided into 100 sec bins |
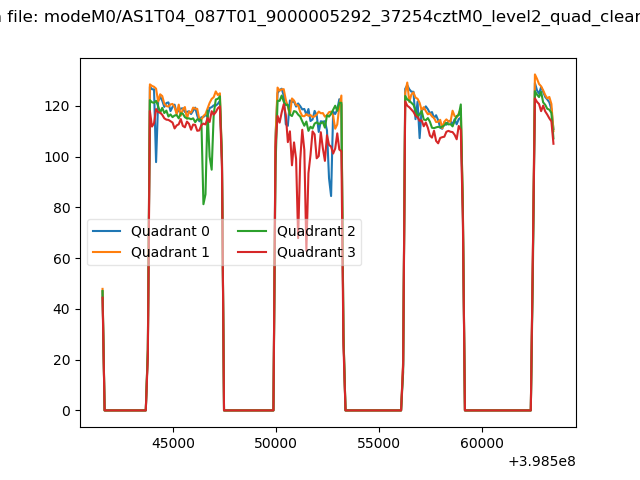 |
|
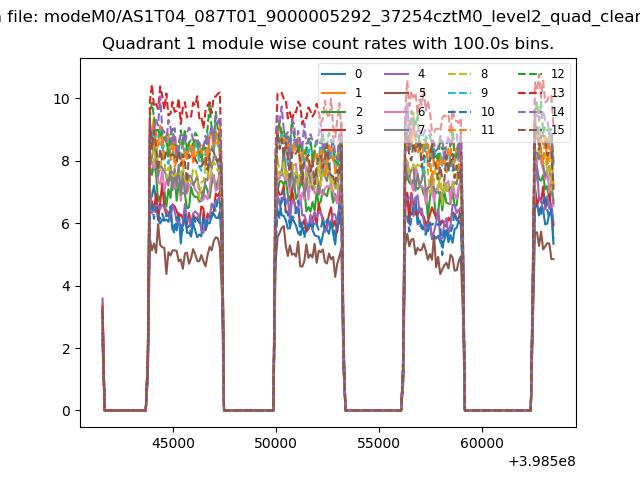
| Module-wise count rates for Quadrant A Data is divided into 100 sec bins |
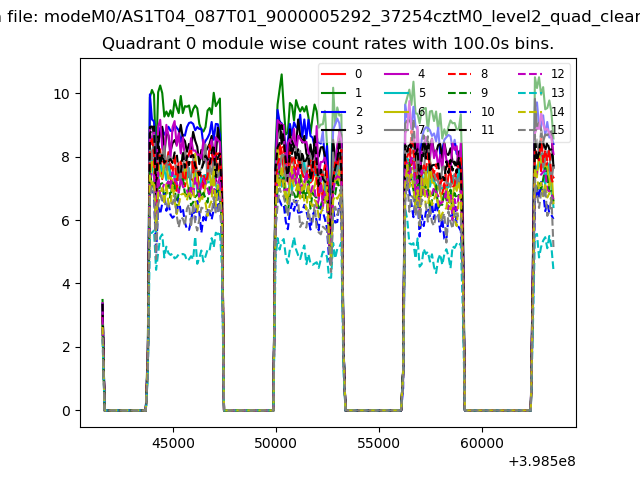 |
 |
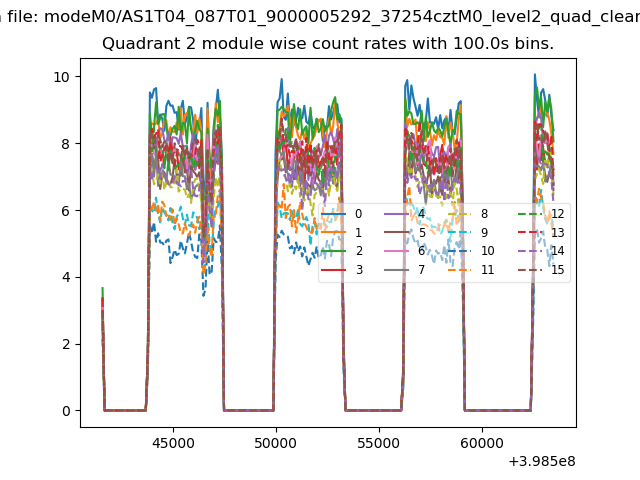
| Module-wise count rates for Quadrant B Data is divided into 100 sec bins |
 |
 |
| Module-wise count rates for Quadrant C Data is divided into 100 sec bins |
 |
 |
| Module-wise count rates for Quadrant D Data is divided into 100 sec bins |
 |
 |
| Parameter | Plot |
|---|---|
| CZT HV Monitor | 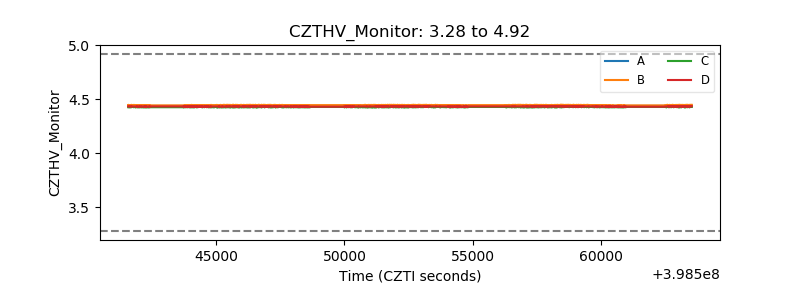 |
| D_VDD | 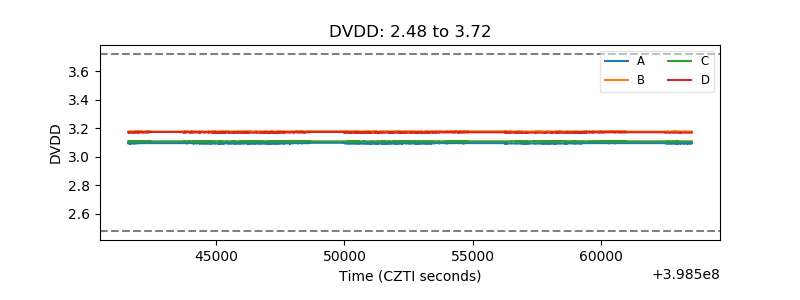 |
| Temperature 1 | 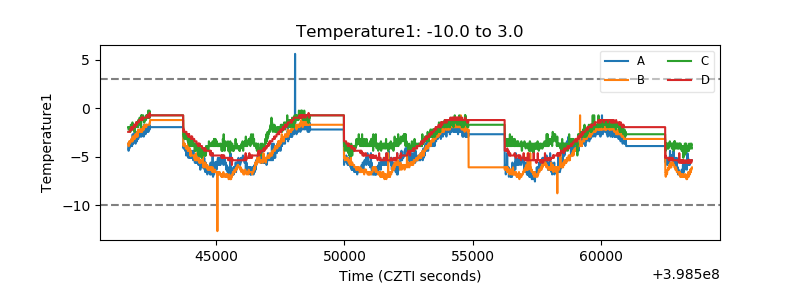 |
| Veto HV Monitor | 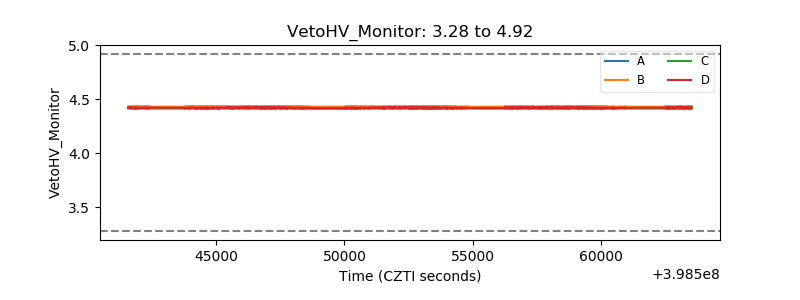 |
| Veto LLD | 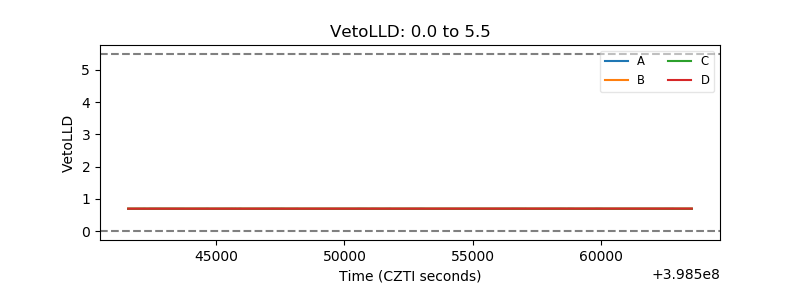 |
| Alpha Counter | 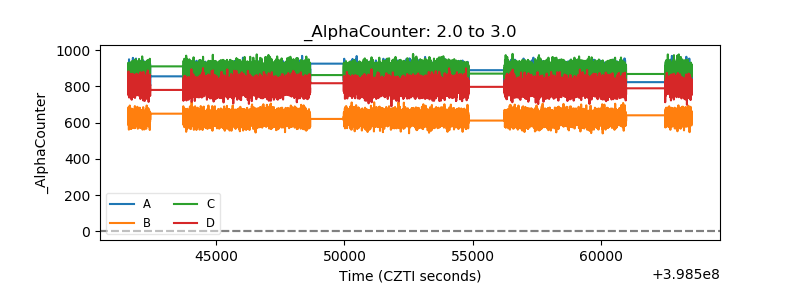 |
| _CPM_Rate | 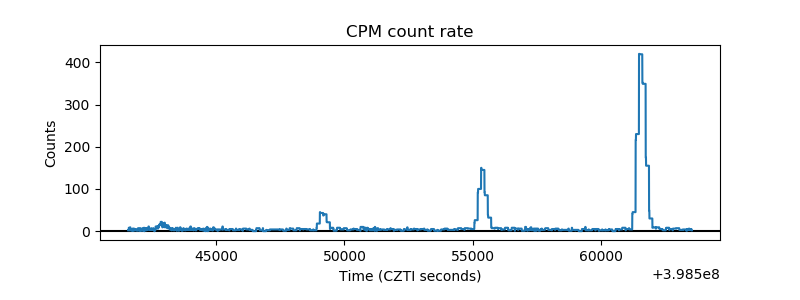 |
| CZT Counter | 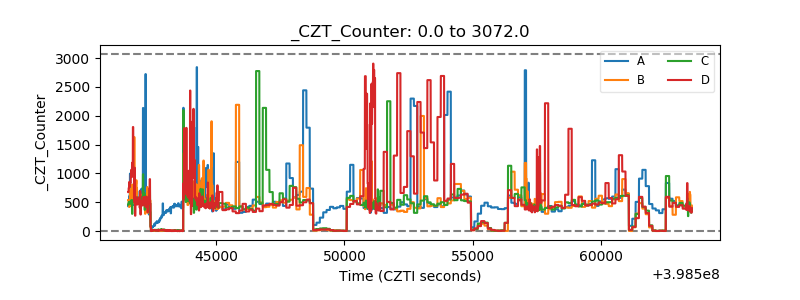 |
| +2.5 Volts monitor | 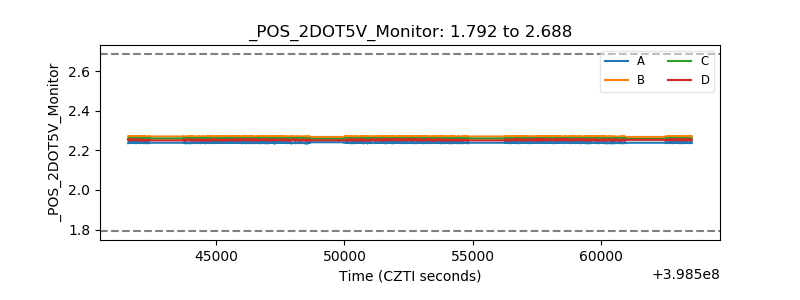 |
| +5 Volts monitor | 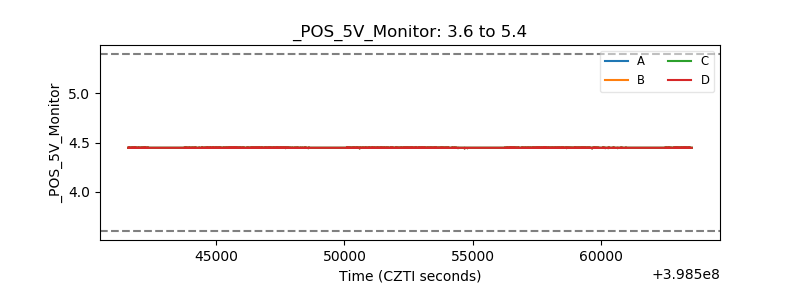 |
| _ROLL_ROT | 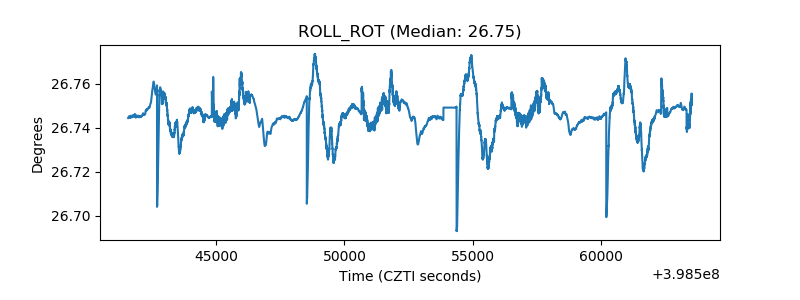 |
| _Roll_DEC | 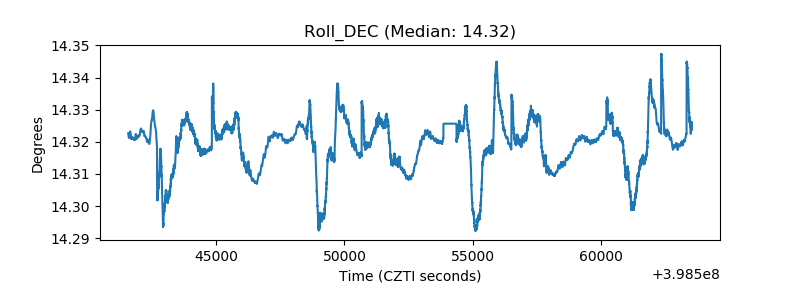 |
| _Roll_RA | 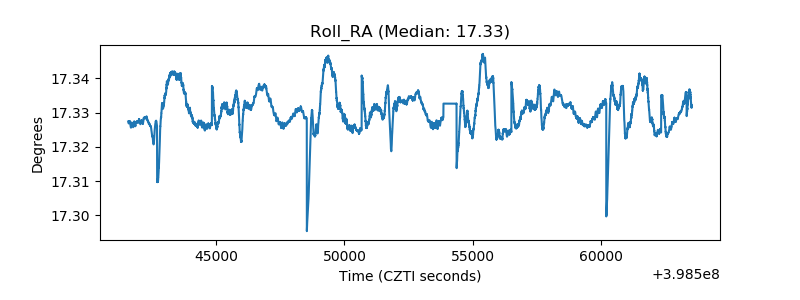 |
| Veto Counter | 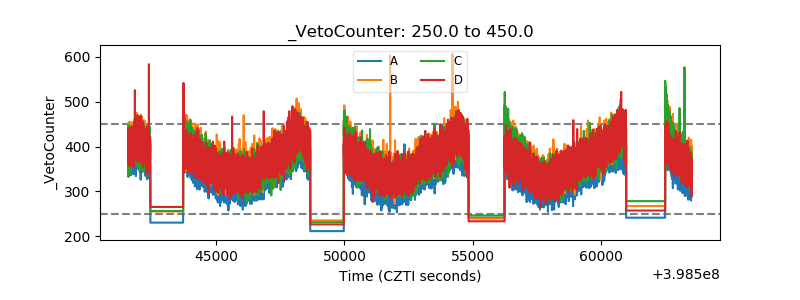 |