| Param | Original file | Final file |
|---|---|---|
| Filename | modeM0/AS1T04_087T01_9000005292_37259cztM0_level2.evt | modeM0/AS1T04_087T01_9000005292_37259cztM0_level2_quad_clean.evt |
| Size (bytes) | 1,055,770,560 | 142,096,320 |
| Size | 1006.9 MB | 135.5 MB |
| Events in quadrant A | 8,411,658 | 856,693 |
| Events in quadrant B | 7,461,431 | 871,949 |
| Events in quadrant C | 7,225,084 | 837,522 |
| Events in quadrant D | 7,958,941 | 799,493 |
| Mode M9 | |||
|---|---|---|---|
| Quadrant | BADHDUFLAG | Total packets | Discarded packets |
| A | 0 | 58 | 0 |
| B | 0 | 58 | 0 |
| C | 0 | 58 | 0 |
| D | 0 | 58 | 0 |
| Mode SS | |||
|---|---|---|---|
| Quadrant | BADHDUFLAG | Total packets | Discarded packets |
| A | 0 | 276 | 0 |
| B | 0 | 276 | 0 |
| C | 0 | 276 | 0 |
| D | 0 | 276 | 0 |
| Mode M0 | |||
|---|---|---|---|
| Quadrant | BADHDUFLAG | Total packets | Discarded packets |
| A | 0 | 33034 | 4 |
| B | 0 | 30564 | 3 |
| C | 0 | 29259 | 5 |
| D | 0 | 32678 | 3 |
| Quadrant | Total seconds | Saturated seconds | Saturation percentage |
|---|---|---|---|
| A | 13577 | 554 | 4.080430% |
| B | 13577 | 96 | 0.707078% |
| C | 13576 | 77 | 0.567177% |
| D | 13577 | 279 | 2.054946% |
Noise dominated data is calculated using 1-second bins in cleaned event files. If a bin has >2000 counts, and if more than 50% of those come from <1% of pixels, then it is considered to be noise-dominated and hence unusable.
| Quadrant | # 1 sec bins | Bins with >0 counts | Bins with >2000 counts | High rate bins dominated by noise | Noise dominated (total time) | Noise dominated (detector-on time) | Marked lightcurve |
|---|---|---|---|---|---|---|---|
| A | 19285 | 13580 | 413 | 413 | 2.14% | 3.04% | 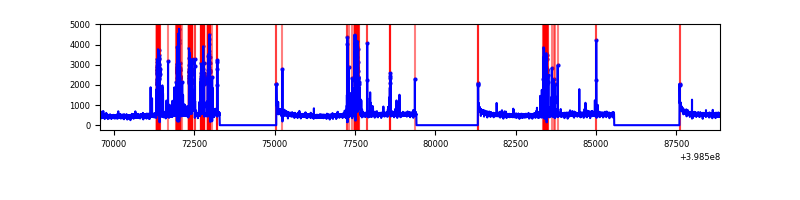 |
| B | 19285 | 13580 | 48 | 48 | 0.25% | 0.35% | 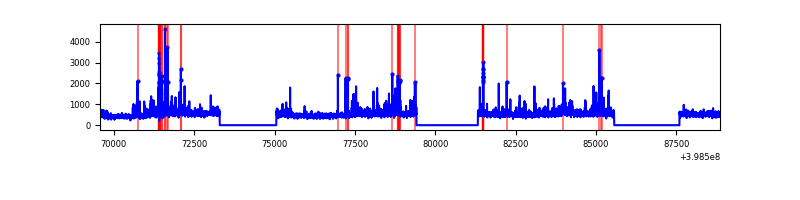 |
| C | 19285 | 13580 | 69 | 69 | 0.36% | 0.51% | 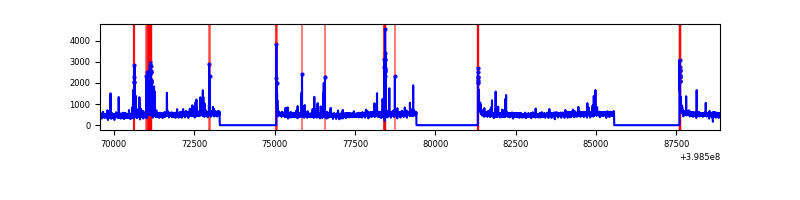 |
| D | 19285 | 13580 | 213 | 213 | 1.10% | 1.57% | 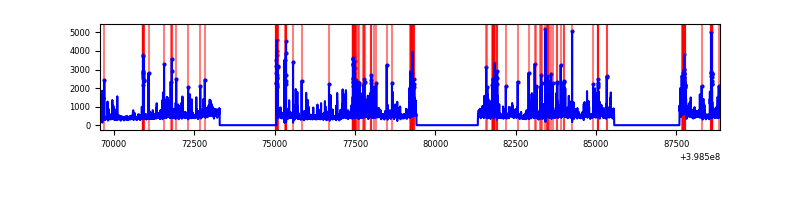 |
Top three noisy pixels from each quadrant. If the there are fewer than three noisy pixels in the level2.evt file, extra rows are filled as -1
| Pixel properties | Quadrant properties | ||||||
|---|---|---|---|---|---|---|---|
| Quadrant | DetID | PixID | Counts | Sigma | Mean | Median | Sigma |
| A | 15 | 237 | 1499383 | 4691.09 | 1609 | 1583 | 319.3 |
| A | 10 | 83 | 550987 | 1720.72 | 1609 | 1583 | 319.3 |
| A | 13 | 248 | 67577 | 206.69 | 1609 | 1583 | 319.3 |
| B | 0 | 213 | 334105 | 1089.54 | 1614 | 1574 | 305.2 |
| B | 0 | 190 | 215037 | 699.41 | 1614 | 1574 | 305.2 |
| B | 0 | 230 | 195018 | 633.82 | 1614 | 1574 | 305.2 |
| C | 15 | 214 | 569913 | 1576.94 | 1556 | 1565 | 360.4 |
| C | 14 | 254 | 419116 | 1158.54 | 1556 | 1565 | 360.4 |
| C | 0 | 10 | 153991 | 422.92 | 1556 | 1565 | 360.4 |
| D | 13 | 249 | 395941 | 1041.35 | 1568 | 1527 | 378.8 |
| D | 2 | 153 | 378070 | 994.17 | 1568 | 1527 | 378.8 |
| D | 1 | 52 | 240158 | 630.05 | 1568 | 1527 | 378.8 |
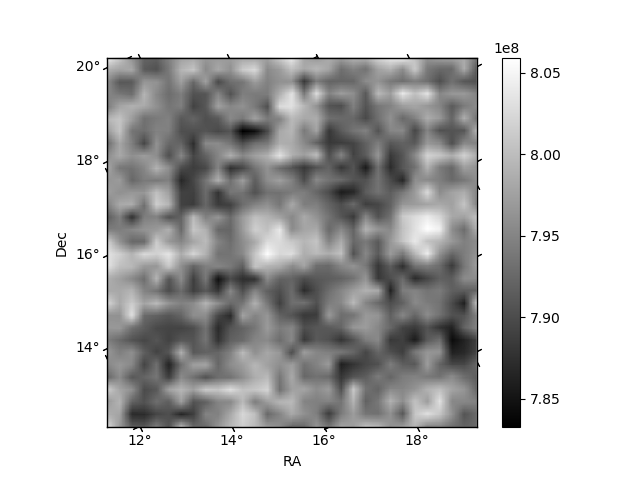
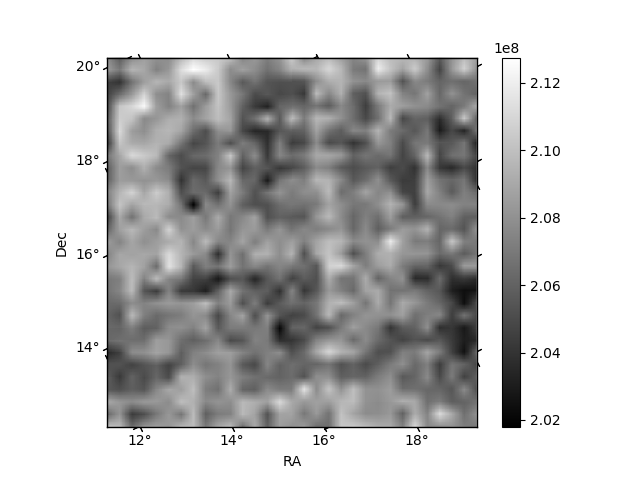
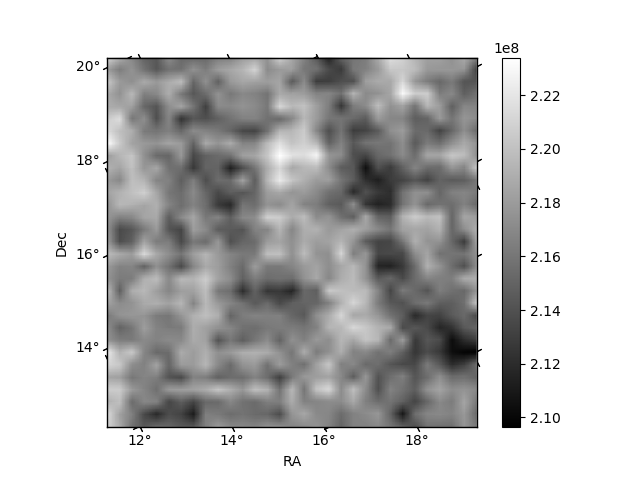
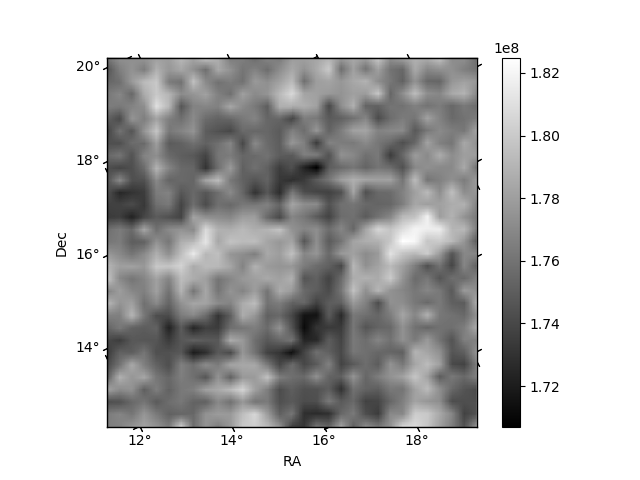
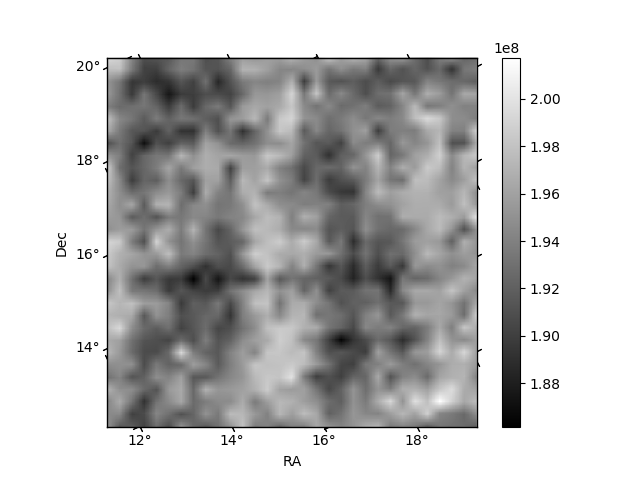
Histogram calculated using DETX and DETY for each event in the final _common_clean file
| Quadrant A | 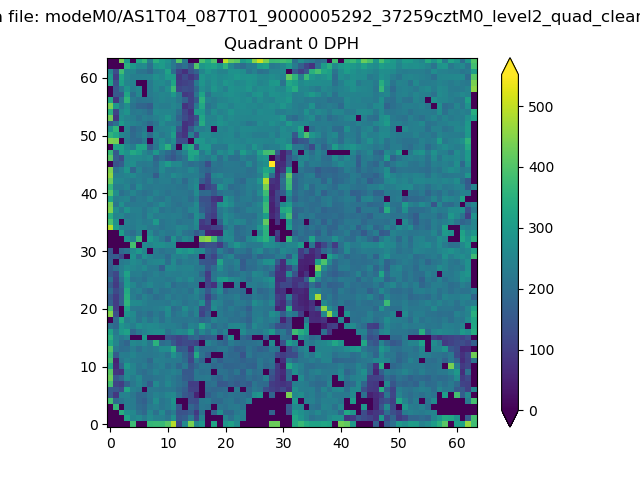 |
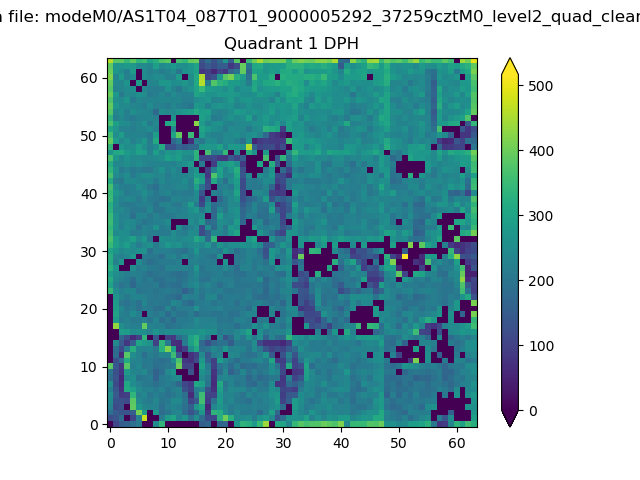 |
Quadrant B |
|---|---|---|---|
| Quadrant D | 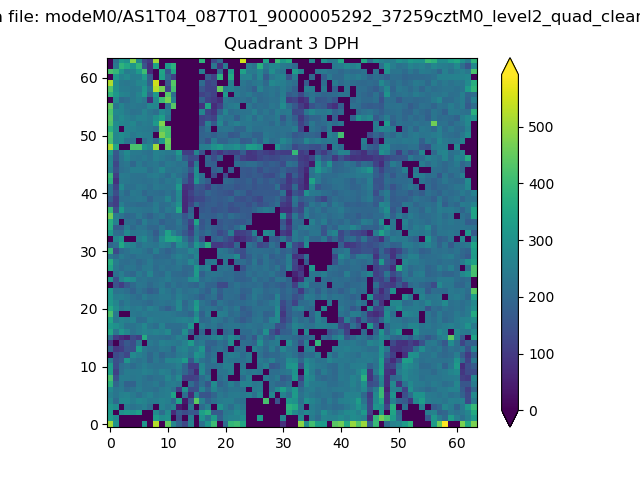 |
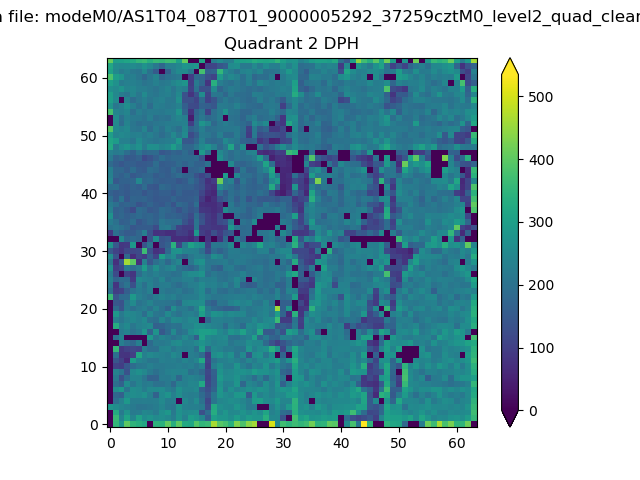 |
Quadrant C |
| Plot type | Count rate plots | Images |
|---|---|---|
| Comparison with Poisson distribution Blue bars denote a histogram of data divided into 1 sec bins. Red curve is a Poisson curve with rate = median count rate of data. |
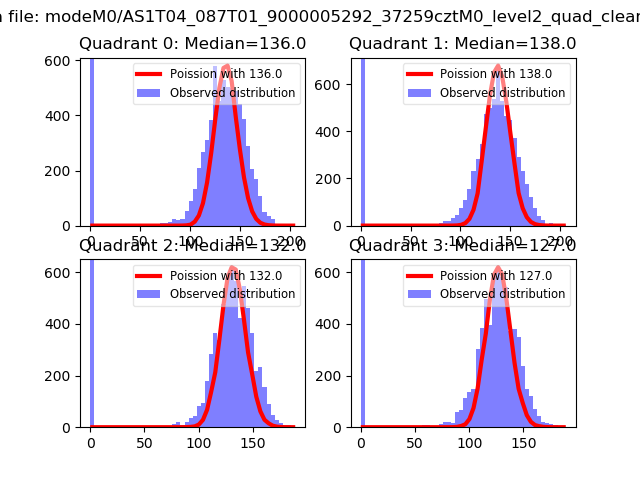 |
 |
| Quadrant-wise count rates Data is divided into 100 sec bins |
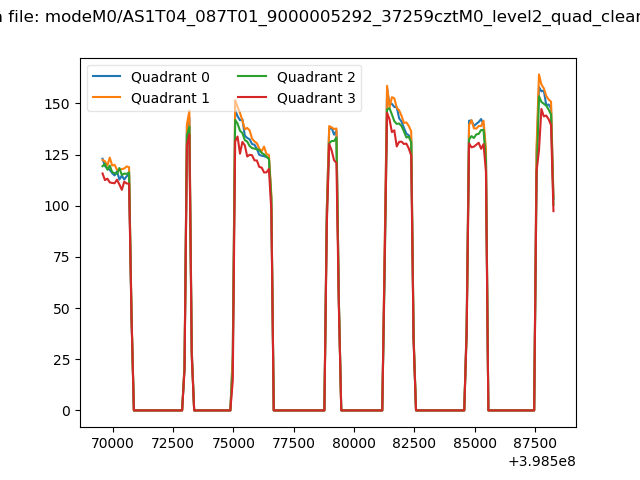 |
|
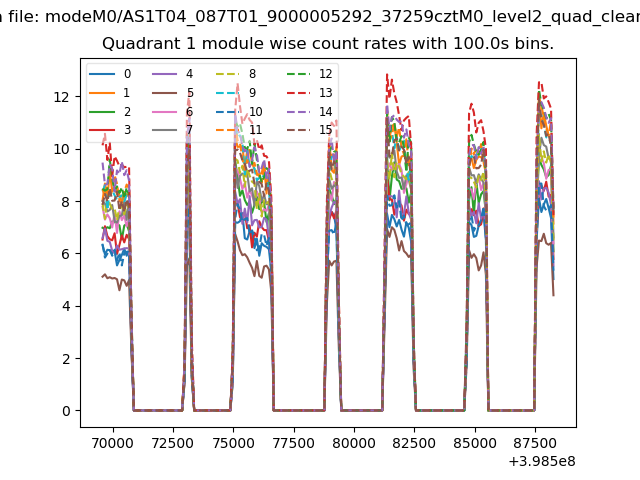
| Module-wise count rates for Quadrant A Data is divided into 100 sec bins |
 |
 |
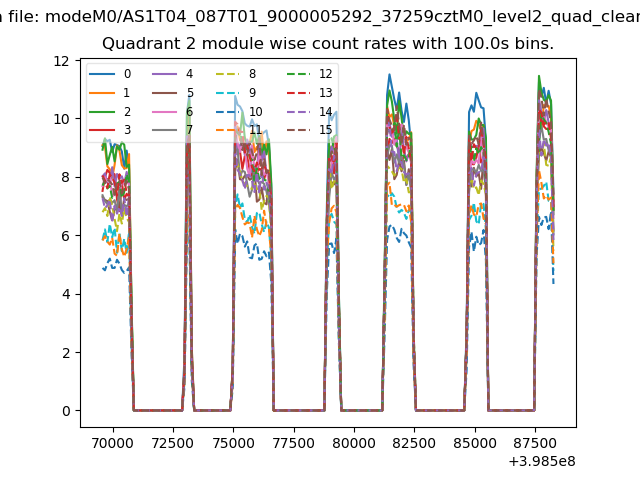
| Module-wise count rates for Quadrant B Data is divided into 100 sec bins |
 |
 |
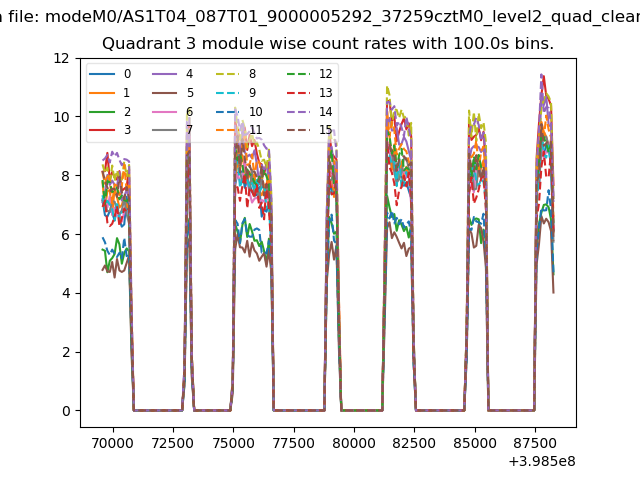
| Module-wise count rates for Quadrant C Data is divided into 100 sec bins |
 |
 |
| Module-wise count rates for Quadrant D Data is divided into 100 sec bins |
 |
 |
| Parameter | Plot |
|---|---|
| CZT HV Monitor | 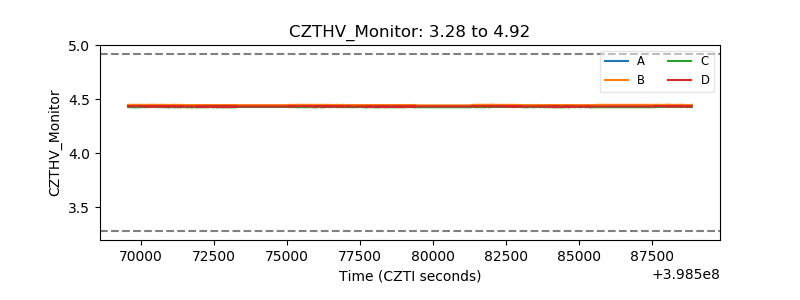 |
| D_VDD | 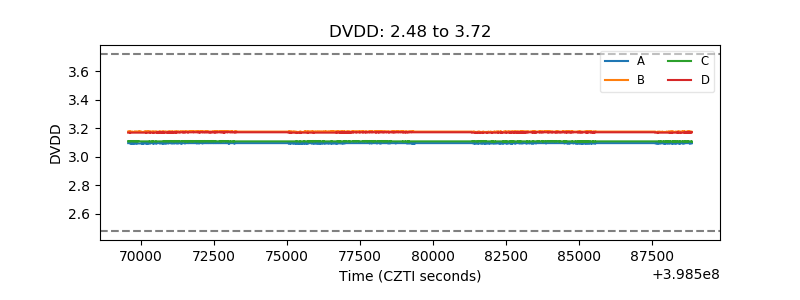 |
| Temperature 1 | 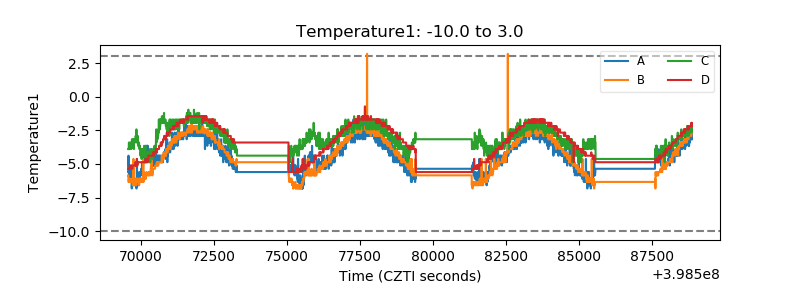 |
| Veto HV Monitor | 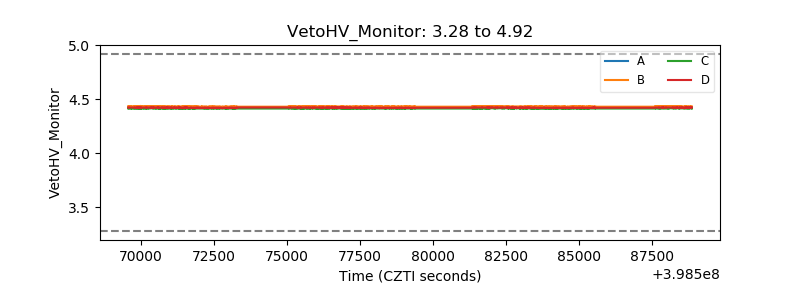 |
| Veto LLD | 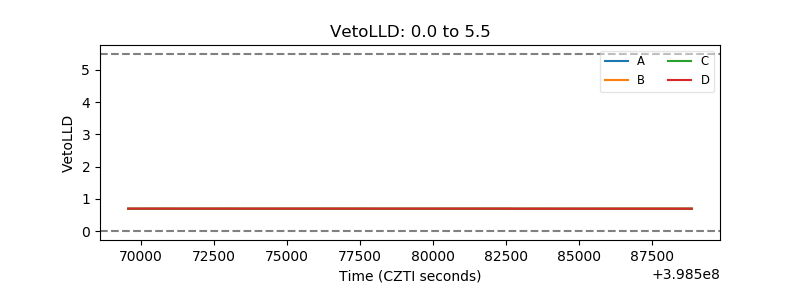 |
| Alpha Counter | 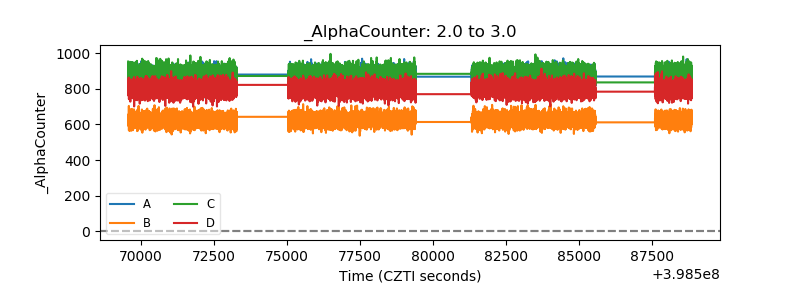 |
| _CPM_Rate | 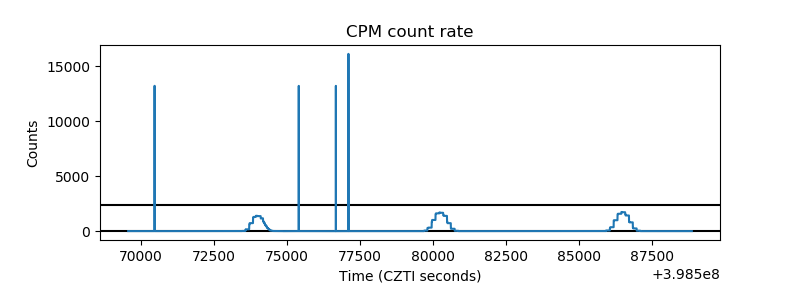 |
| CZT Counter | 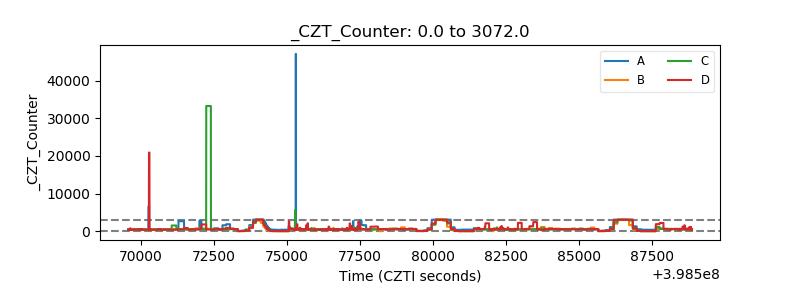 |
| +2.5 Volts monitor | 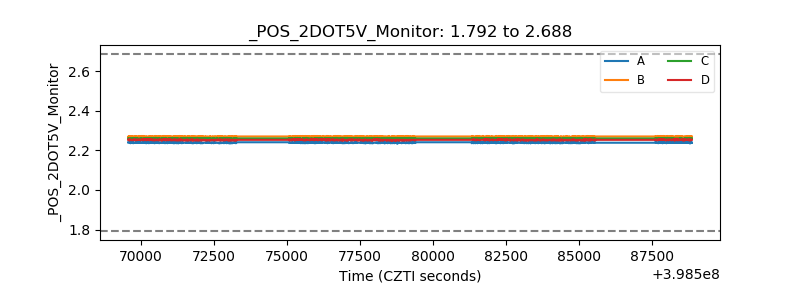 |
| +5 Volts monitor | 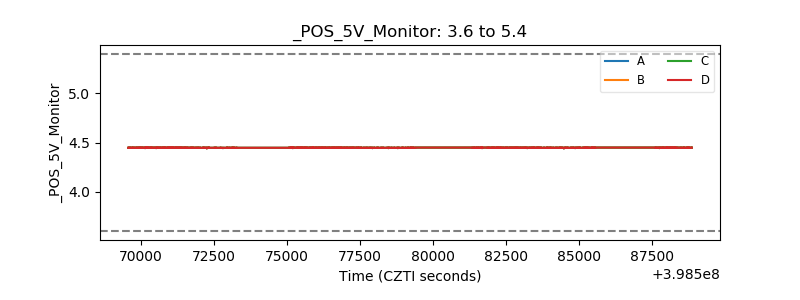 |
| _ROLL_ROT | 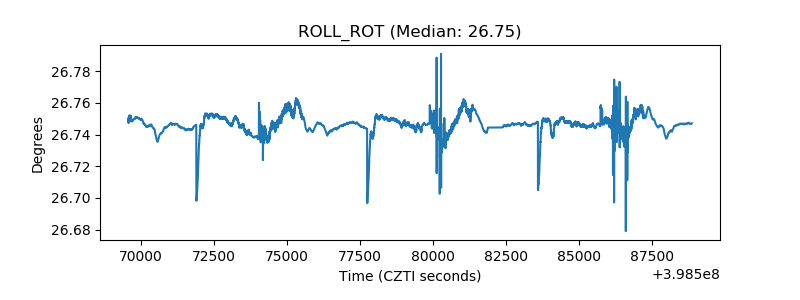 |
| _Roll_DEC | 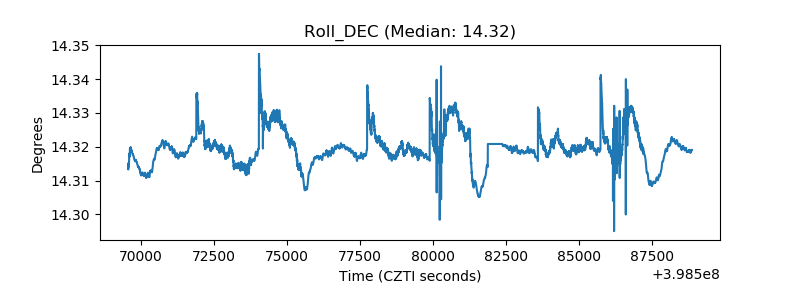 |
| _Roll_RA | 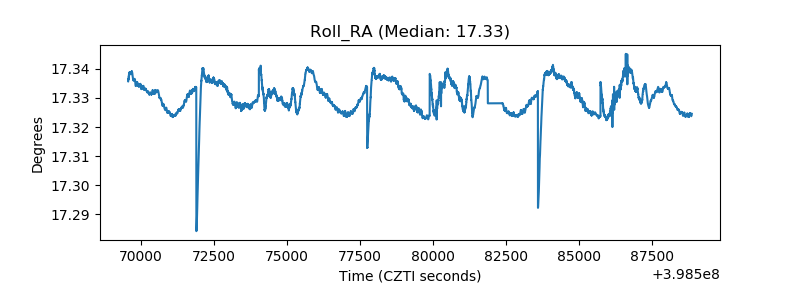 |
| Veto Counter | 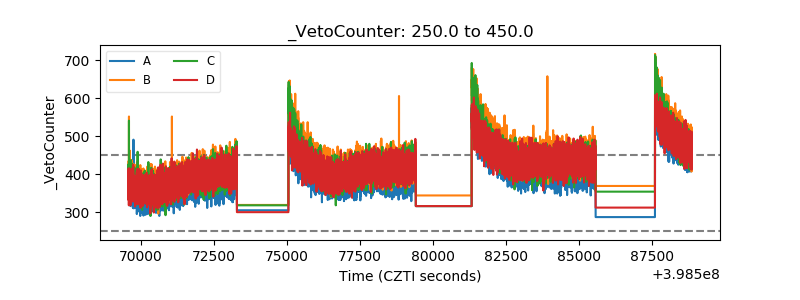 |