| Param | Original file | Final file |
|---|---|---|
| Filename | modeM0/AS1T04_087T01_9000005292_37260cztM0_level2.evt | modeM0/AS1T04_087T01_9000005292_37260cztM0_level2_quad_clean.evt |
| Size (bytes) | 1,396,704,960 | 178,295,040 |
| Size | 1.3 GB | 170.0 MB |
| Events in quadrant A | 11,798,092 | 1,069,990 |
| Events in quadrant B | 9,769,987 | 1,083,437 |
| Events in quadrant C | 9,377,150 | 1,041,670 |
| Events in quadrant D | 10,173,017 | 997,777 |
| Mode M9 | |||
|---|---|---|---|
| Quadrant | BADHDUFLAG | Total packets | Discarded packets |
| A | 0 | 79 | 0 |
| B | 0 | 79 | 0 |
| C | 0 | 79 | 0 |
| D | 0 | 79 | 0 |
| Mode SS | |||
|---|---|---|---|
| Quadrant | BADHDUFLAG | Total packets | Discarded packets |
| A | 0 | 356 | 0 |
| B | 0 | 356 | 0 |
| C | 0 | 356 | 0 |
| D | 0 | 356 | 0 |
| Mode M0 | |||
|---|---|---|---|
| Quadrant | BADHDUFLAG | Total packets | Discarded packets |
| A | 0 | 45424 | 5 |
| B | 0 | 39642 | 4 |
| C | 0 | 37793 | 4 |
| D | 0 | 41619 | 4 |
| Quadrant | Total seconds | Saturated seconds | Saturation percentage |
|---|---|---|---|
| A | 17513 | 1058 | 6.041227% |
| B | 17513 | 145 | 0.827956% |
| C | 17513 | 93 | 0.531034% |
| D | 17513 | 316 | 1.804374% |
Noise dominated data is calculated using 1-second bins in cleaned event files. If a bin has >2000 counts, and if more than 50% of those come from <1% of pixels, then it is considered to be noise-dominated and hence unusable.
| Quadrant | # 1 sec bins | Bins with >0 counts | Bins with >2000 counts | High rate bins dominated by noise | Noise dominated (total time) | Noise dominated (detector-on time) | Marked lightcurve |
|---|---|---|---|---|---|---|---|
| A | 25327 | 17491 | 818 | 818 | 3.23% | 4.68% | 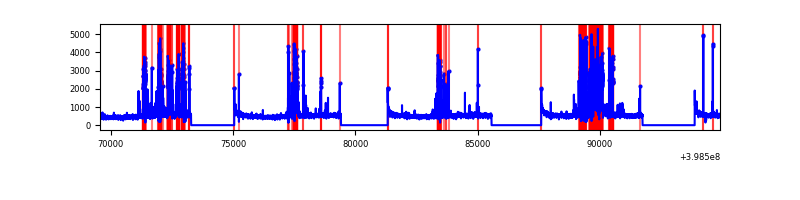 |
| B | 25327 | 17491 | 88 | 88 | 0.35% | 0.50% | 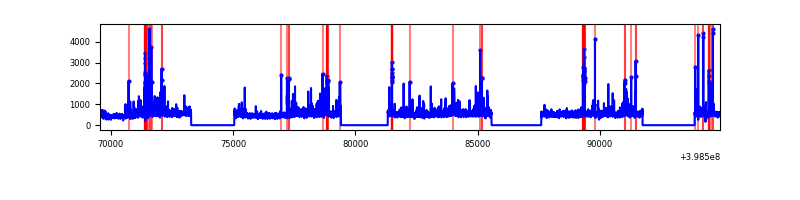 |
| C | 25327 | 17491 | 87 | 87 | 0.34% | 0.50% | 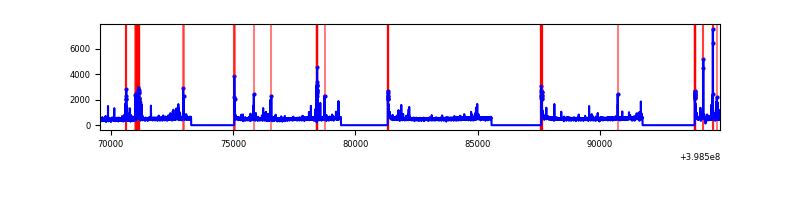 |
| D | 25327 | 17491 | 247 | 247 | 0.98% | 1.41% | 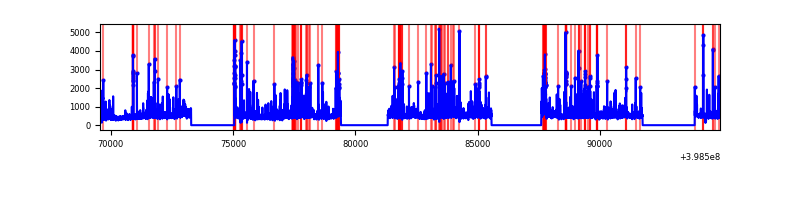 |
Top three noisy pixels from each quadrant. If the there are fewer than three noisy pixels in the level2.evt file, extra rows are filled as -1
| Pixel properties | Quadrant properties | ||||||
|---|---|---|---|---|---|---|---|
| Quadrant | DetID | PixID | Counts | Sigma | Mean | Median | Sigma |
| A | 15 | 237 | 2856781 | 6930.84 | 2081 | 2046 | 411.9 |
| A | 10 | 83 | 711279 | 1721.9 | 2081 | 2046 | 411.9 |
| A | 13 | 248 | 96925 | 230.35 | 2081 | 2046 | 411.9 |
| B | 0 | 213 | 467174 | 1166.68 | 2103 | 2049 | 398.7 |
| B | 0 | 190 | 268285 | 667.8 | 2103 | 2049 | 398.7 |
| B | 0 | 230 | 227047 | 564.37 | 2103 | 2049 | 398.7 |
| C | 15 | 214 | 735268 | 1565.05 | 2029 | 2040 | 468.5 |
| C | 14 | 254 | 504528 | 1072.54 | 2029 | 2040 | 468.5 |
| C | 0 | 10 | 210507 | 444.96 | 2029 | 2040 | 468.5 |
| D | 2 | 153 | 500948 | 1006.43 | 2052 | 1998 | 495.8 |
| D | 13 | 249 | 436544 | 876.52 | 2052 | 1998 | 495.8 |
| D | 2 | 249 | 272249 | 545.12 | 2052 | 1998 | 495.8 |
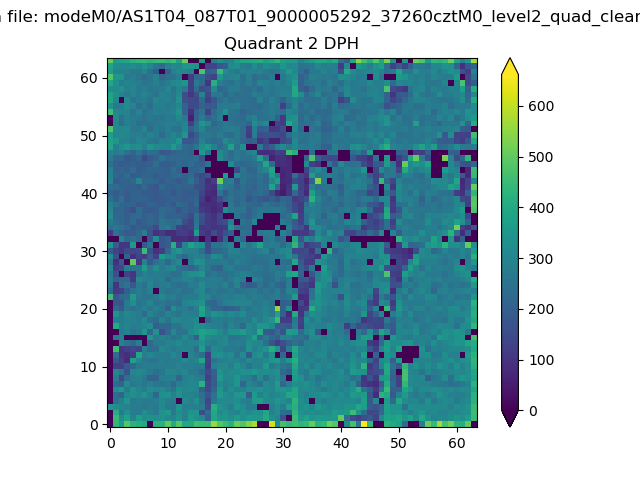
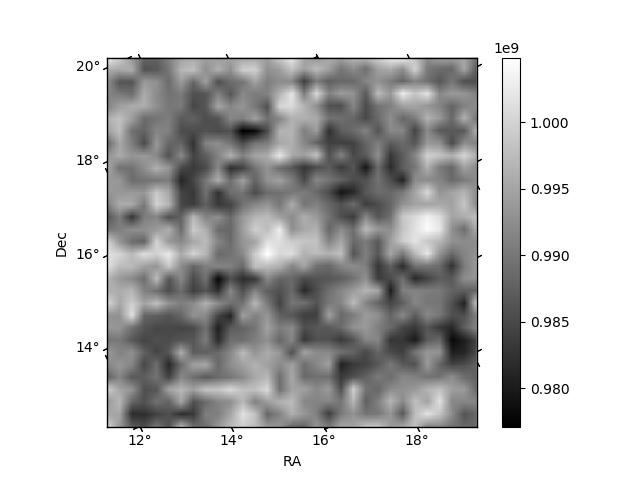
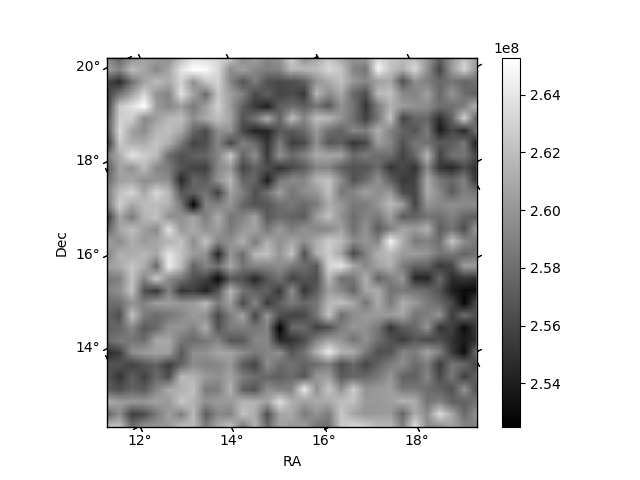
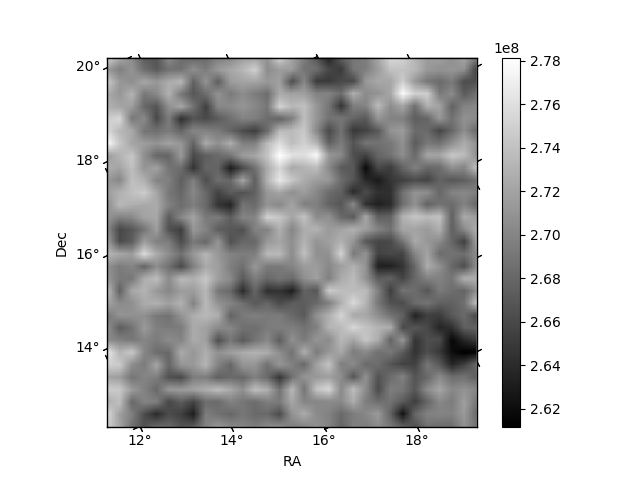
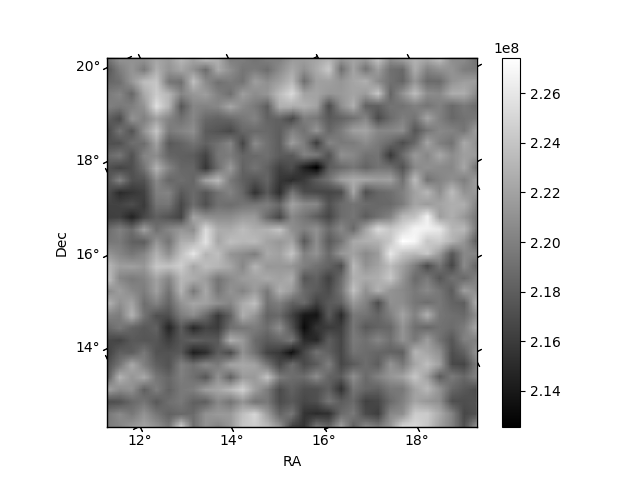
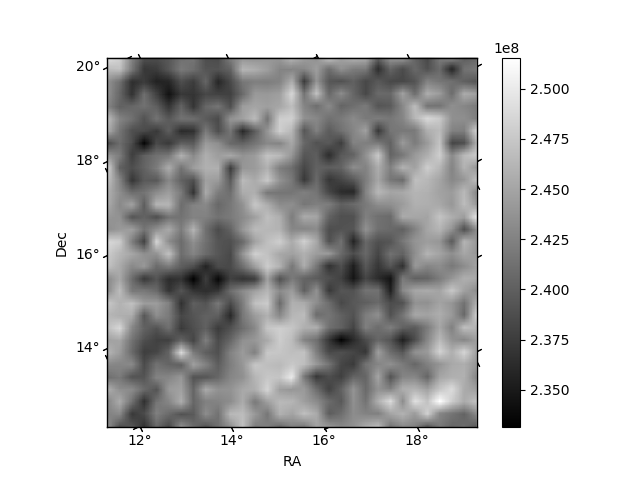
Histogram calculated using DETX and DETY for each event in the final _common_clean file
| Quadrant A | 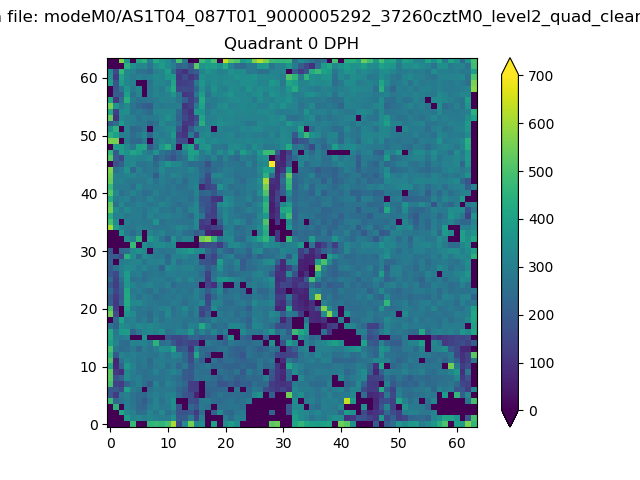 |
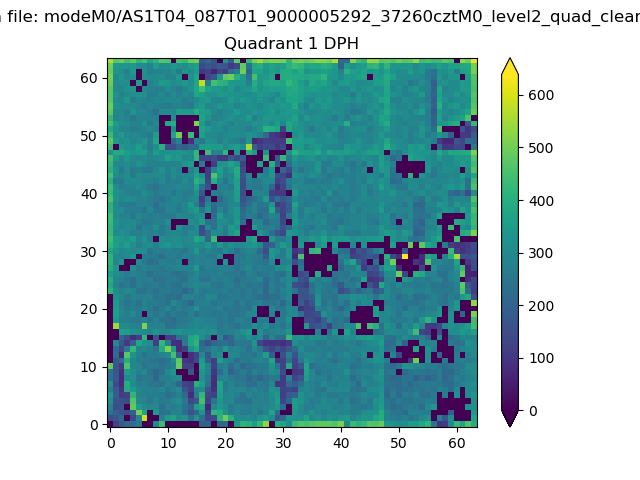 |
Quadrant B |
|---|---|---|---|
| Quadrant D | 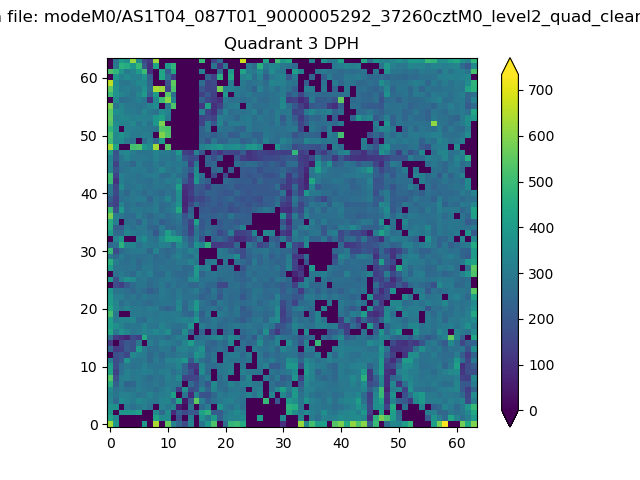 |
 |
Quadrant C |
| Plot type | Count rate plots | Images |
|---|---|---|
| Comparison with Poisson distribution Blue bars denote a histogram of data divided into 1 sec bins. Red curve is a Poisson curve with rate = median count rate of data. |
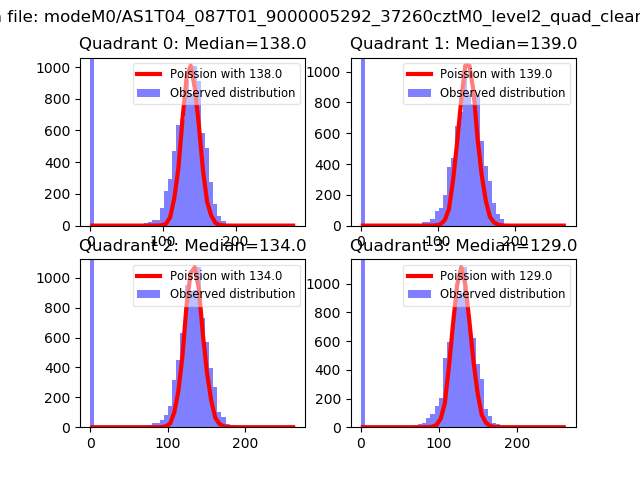 |
 |
| Quadrant-wise count rates Data is divided into 100 sec bins |
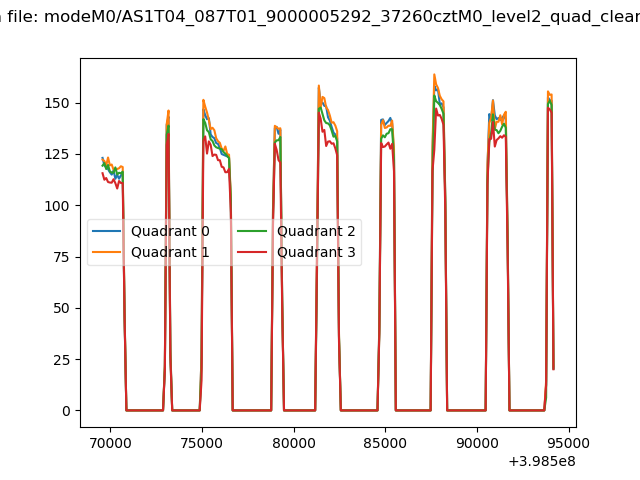 |
|
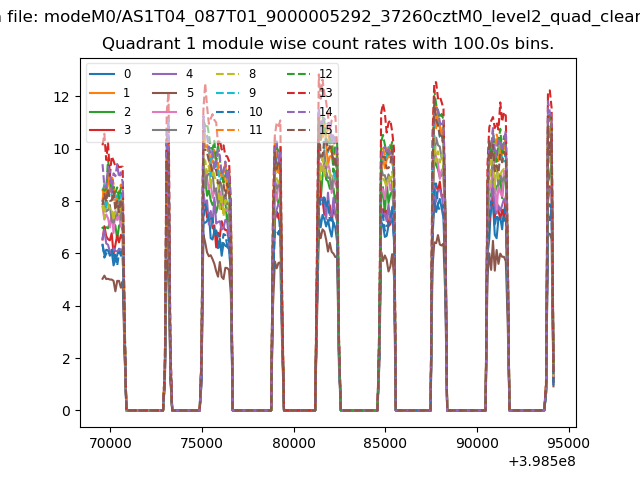
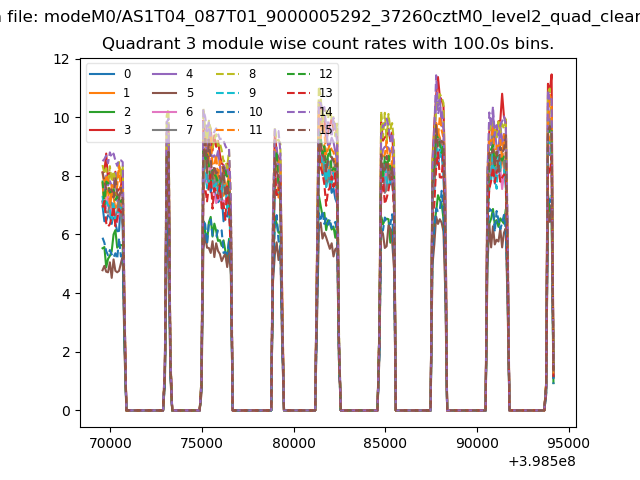
| Module-wise count rates for Quadrant A Data is divided into 100 sec bins |
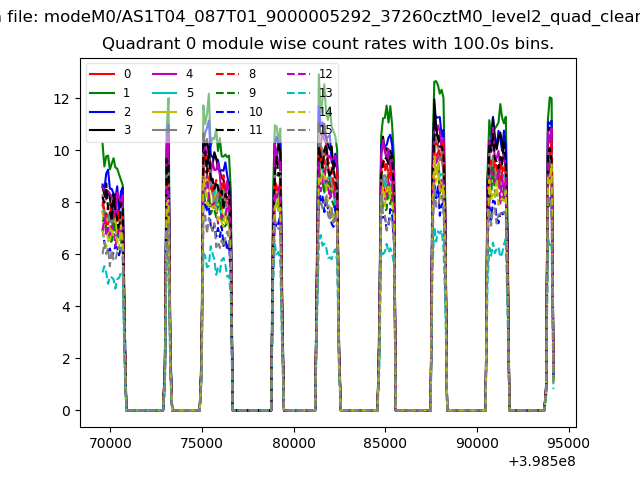 |
 |
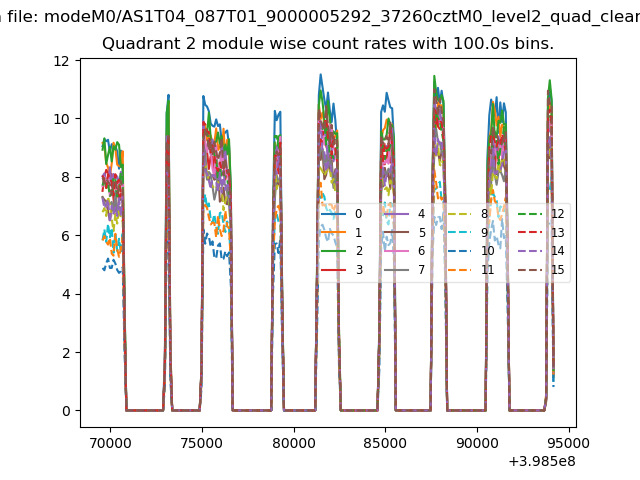
| Module-wise count rates for Quadrant B Data is divided into 100 sec bins |
 |
 |
| Module-wise count rates for Quadrant C Data is divided into 100 sec bins |
 |
 |
| Module-wise count rates for Quadrant D Data is divided into 100 sec bins |
 |
 |
| Parameter | Plot |
|---|---|
| CZT HV Monitor | 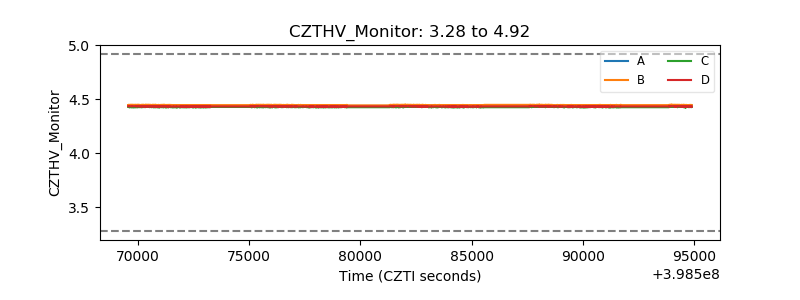 |
| D_VDD | 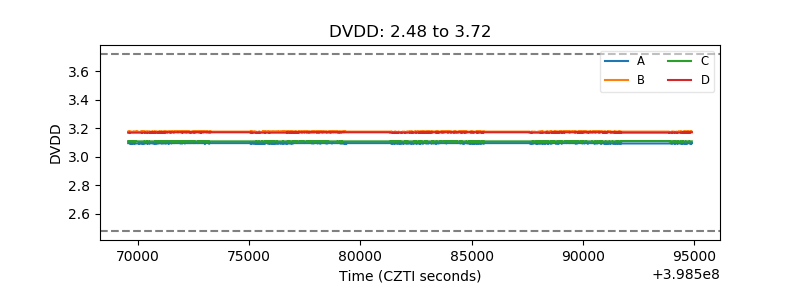 |
| Temperature 1 | 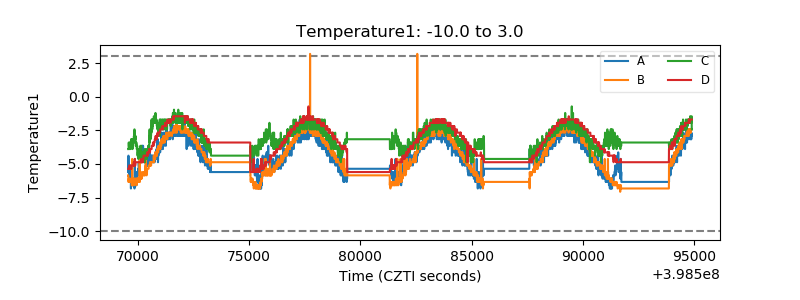 |
| Veto HV Monitor | 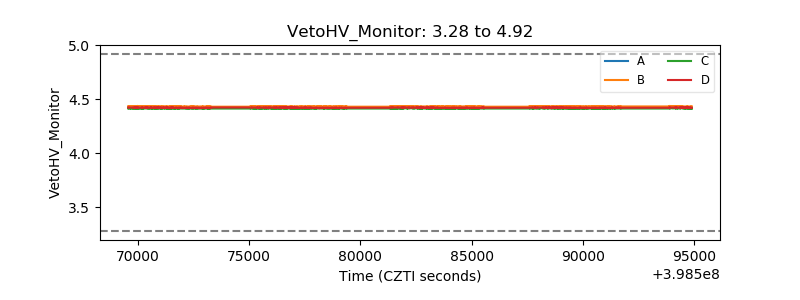 |
| Veto LLD | 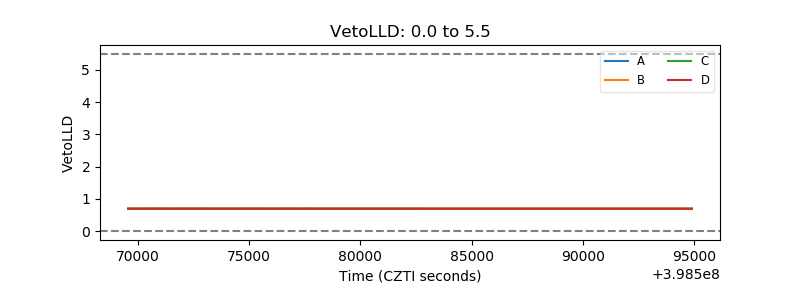 |
| Alpha Counter | 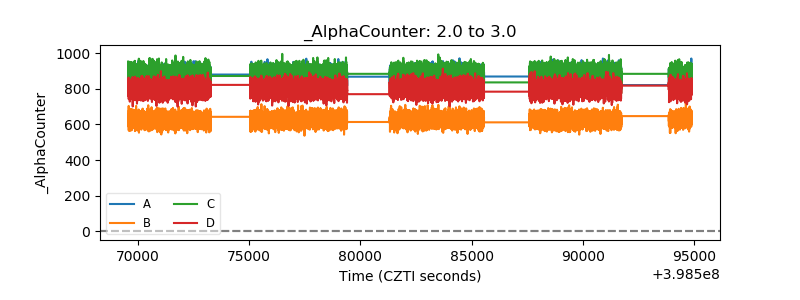 |
| _CPM_Rate | 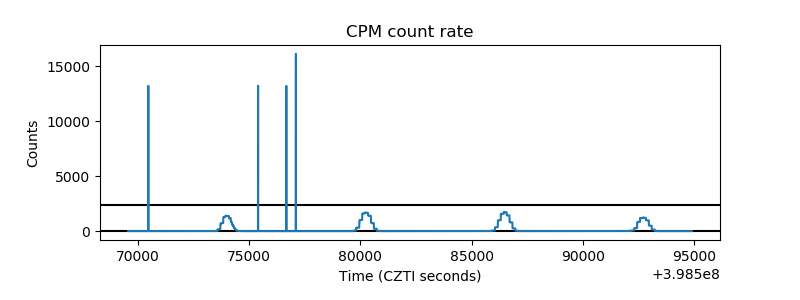 |
| CZT Counter | 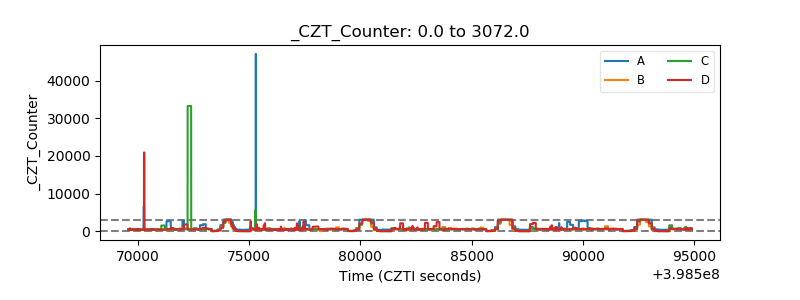 |
| +2.5 Volts monitor | 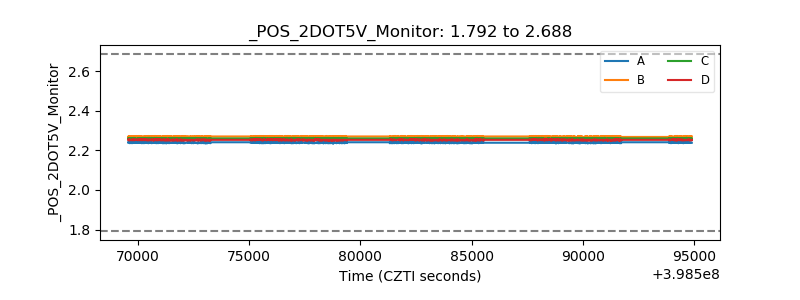 |
| +5 Volts monitor | 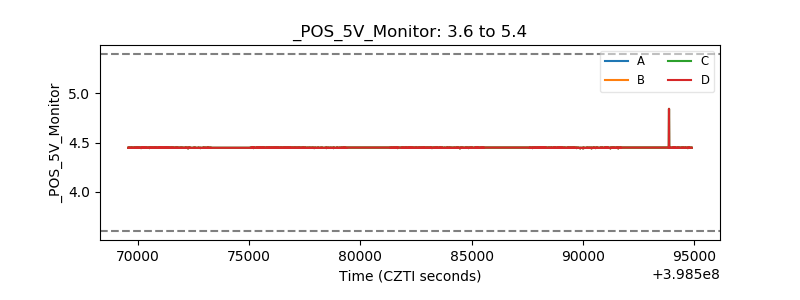 |
| _ROLL_ROT | 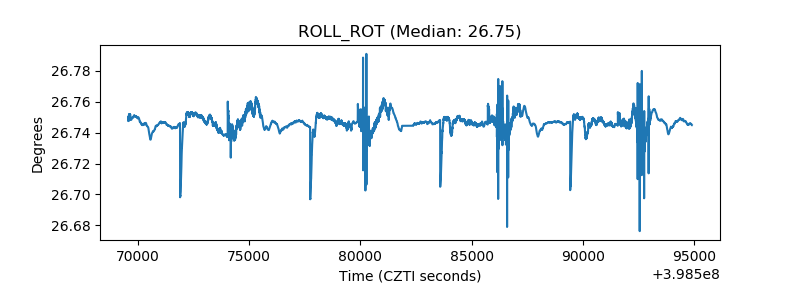 |
| _Roll_DEC | 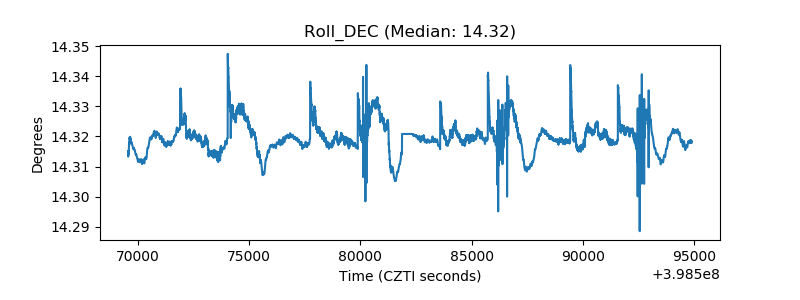 |
| _Roll_RA | 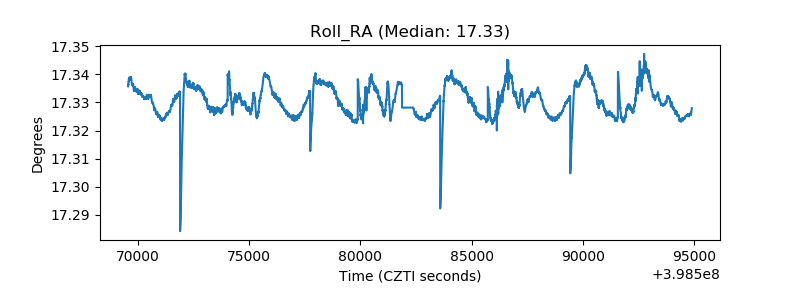 |
| Veto Counter |  |