| Param | Original file | Final file |
|---|---|---|
| Filename | modeM0/AS1T04_087T01_9000005292_37261cztM0_level2.evt | modeM0/AS1T04_087T01_9000005292_37261cztM0_level2_quad_clean.evt |
| Size (bytes) | 406,031,040 | 46,157,760 |
| Size | 387.2 MB | 44.0 MB |
| Events in quadrant A | 3,143,681 | 266,216 |
| Events in quadrant B | 2,873,802 | 266,005 |
| Events in quadrant C | 3,137,862 | 255,529 |
| Events in quadrant D | 2,793,907 | 250,938 |
| Mode M9 | |||
|---|---|---|---|
| Quadrant | BADHDUFLAG | Total packets | Discarded packets |
| A | 0 | 29 | 0 |
| B | 0 | 29 | 0 |
| C | 0 | 29 | 0 |
| D | 0 | 30 | 0 |
| Mode SS | |||
|---|---|---|---|
| Quadrant | BADHDUFLAG | Total packets | Discarded packets |
| A | 0 | 104 | 0 |
| B | 0 | 104 | 0 |
| C | 0 | 104 | 0 |
| D | 0 | 104 | 0 |
| Mode M0 | |||
|---|---|---|---|
| Quadrant | BADHDUFLAG | Total packets | Discarded packets |
| A | 0 | 12318 | 3 |
| B | 0 | 11492 | 2 |
| C | 0 | 12373 | 2 |
| D | 0 | 11456 | 2 |
| Quadrant | Total seconds | Saturated seconds | Saturation percentage |
|---|---|---|---|
| A | 5116 | 111 | 2.169664% |
| B | 5116 | 29 | 0.566849% |
| C | 5116 | 55 | 1.075059% |
| D | 5116 | 43 | 0.840500% |
Noise dominated data is calculated using 1-second bins in cleaned event files. If a bin has >2000 counts, and if more than 50% of those come from <1% of pixels, then it is considered to be noise-dominated and hence unusable.
| Quadrant | # 1 sec bins | Bins with >0 counts | Bins with >2000 counts | High rate bins dominated by noise | Noise dominated (total time) | Noise dominated (detector-on time) | Marked lightcurve |
|---|---|---|---|---|---|---|---|
| A | 7269 | 5142 | 70 | 70 | 0.96% | 1.36% | 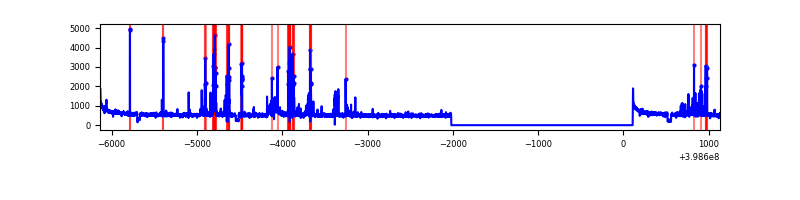 |
| B | 7269 | 5142 | 18 | 18 | 0.25% | 0.35% | 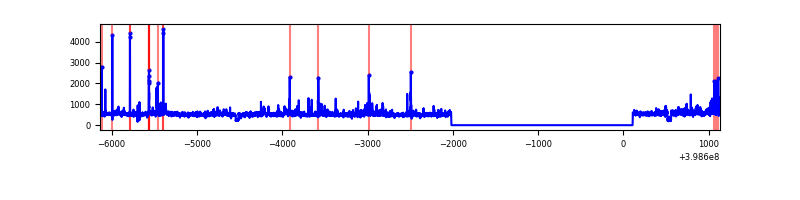 |
| C | 7269 | 5142 | 56 | 56 | 0.77% | 1.09% | 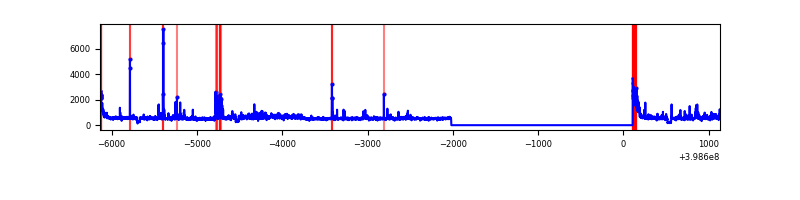 |
| D | 7269 | 5142 | 30 | 30 | 0.41% | 0.58% | 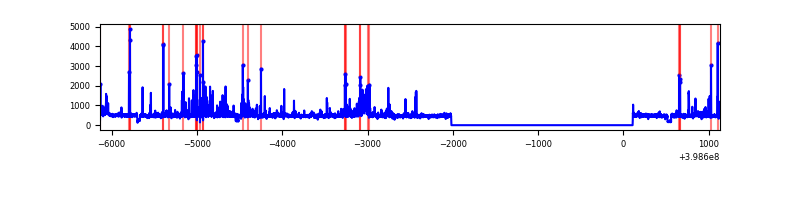 |
Top three noisy pixels from each quadrant. If the there are fewer than three noisy pixels in the level2.evt file, extra rows are filled as -1
| Pixel properties | Quadrant properties | ||||||
|---|---|---|---|---|---|---|---|
| Quadrant | DetID | PixID | Counts | Sigma | Mean | Median | Sigma |
| A | 15 | 237 | 341357 | 2667.41 | 636 | 625 | 127.7 |
| A | 10 | 83 | 258230 | 2016.65 | 636 | 625 | 127.7 |
| A | 13 | 248 | 39483 | 304.2 | 636 | 625 | 127.7 |
| B | 0 | 213 | 155475 | 1285.74 | 628 | 613 | 120.4 |
| B | 0 | 190 | 89270 | 736.07 | 628 | 613 | 120.4 |
| B | 0 | 230 | 66830 | 549.76 | 628 | 613 | 120.4 |
| C | 14 | 254 | 386538 | 2734.34 | 605 | 610 | 141.1 |
| C | 15 | 214 | 219667 | 1552.04 | 605 | 610 | 141.1 |
| C | 0 | 10 | 163442 | 1153.68 | 605 | 610 | 141.1 |
| D | 2 | 153 | 183246 | 1218.55 | 617 | 601 | 149.9 |
| D | 13 | 249 | 52516 | 346.36 | 617 | 601 | 149.9 |
| D | 2 | 249 | 45834 | 301.78 | 617 | 601 | 149.9 |
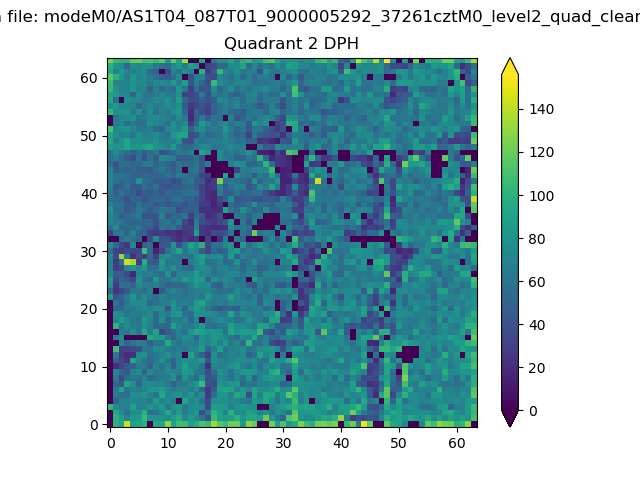
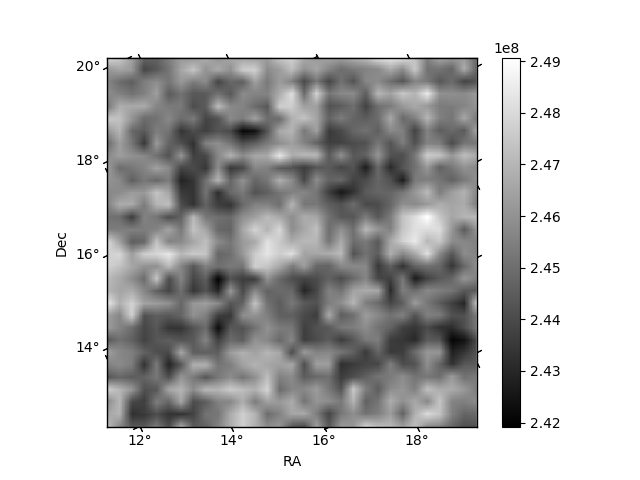
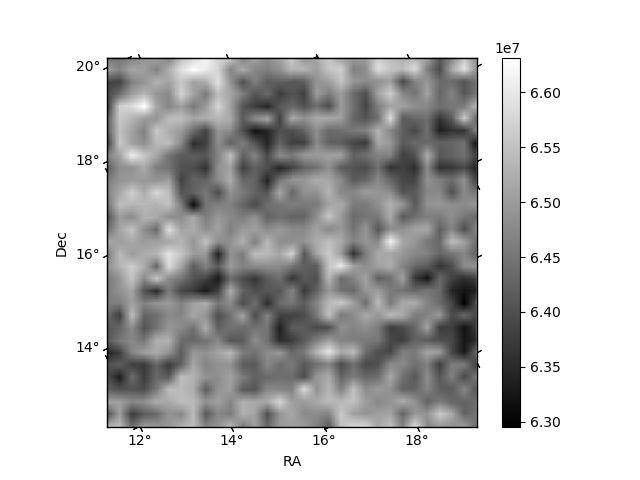
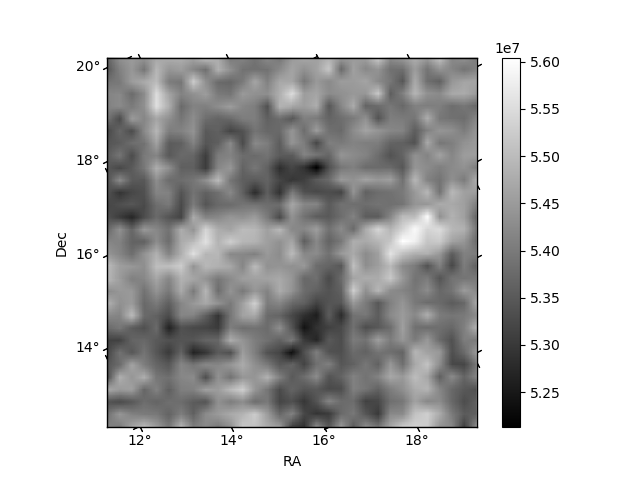
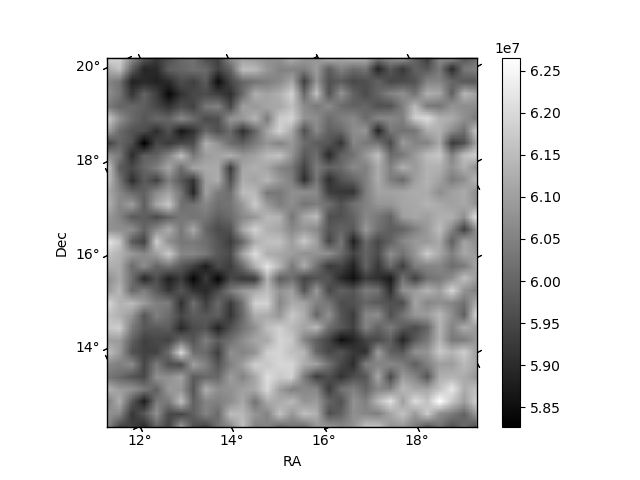
Histogram calculated using DETX and DETY for each event in the final _common_clean file
| Quadrant A | 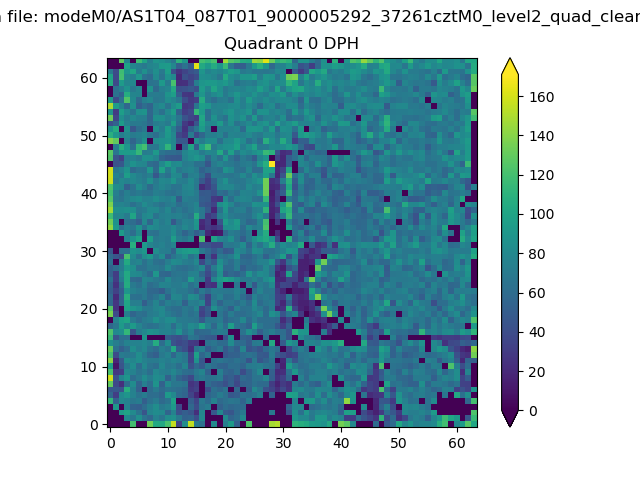 |
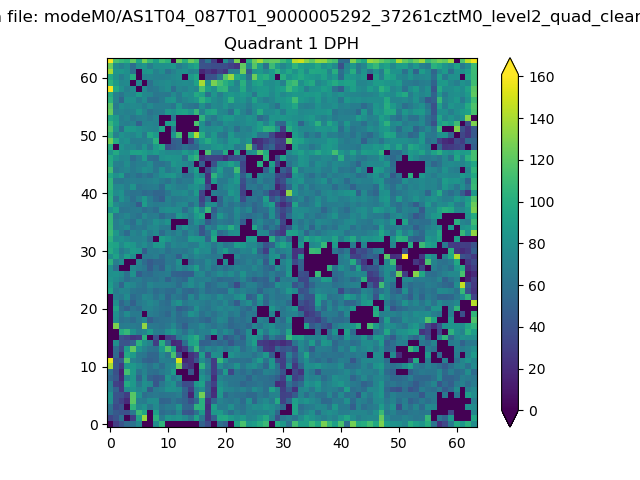 |
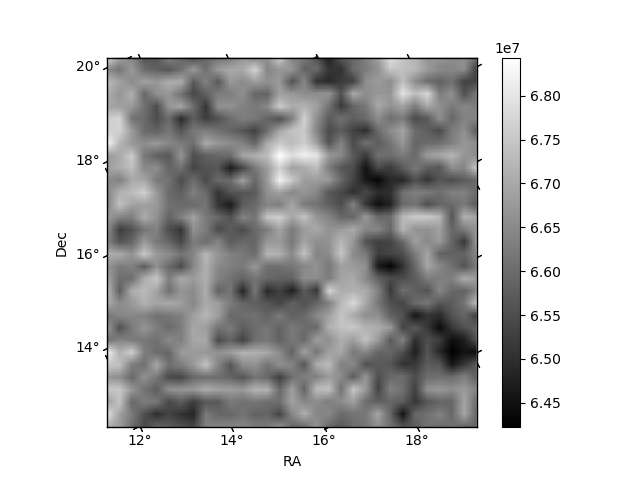
Quadrant B |
|---|---|---|---|
| Quadrant D | 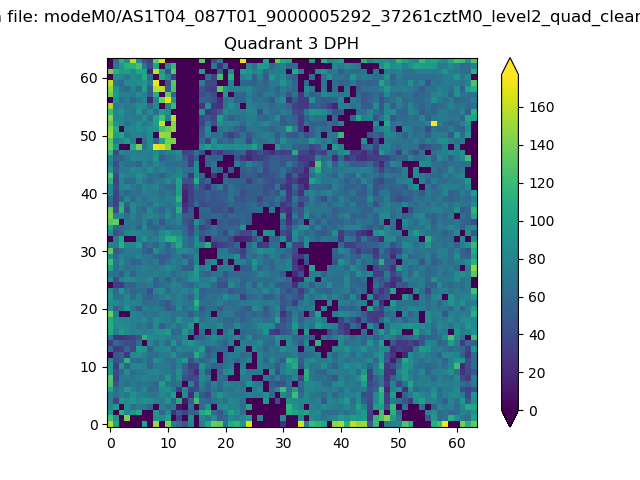 |
 |
Quadrant C |
| Plot type | Count rate plots | Images |
|---|---|---|
| Comparison with Poisson distribution Blue bars denote a histogram of data divided into 1 sec bins. Red curve is a Poisson curve with rate = median count rate of data. |
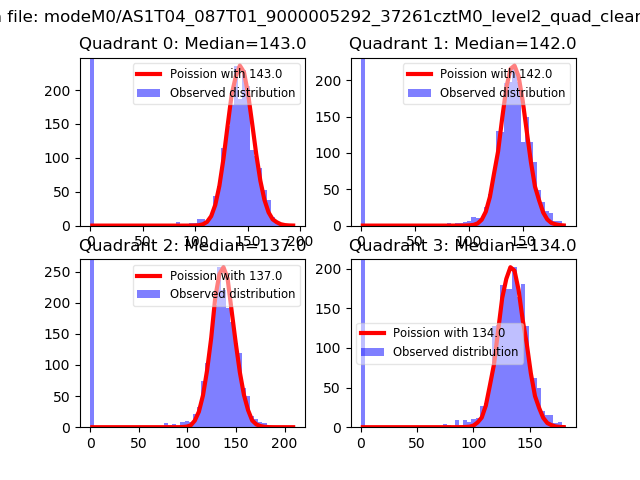 |
 |
| Quadrant-wise count rates Data is divided into 100 sec bins |
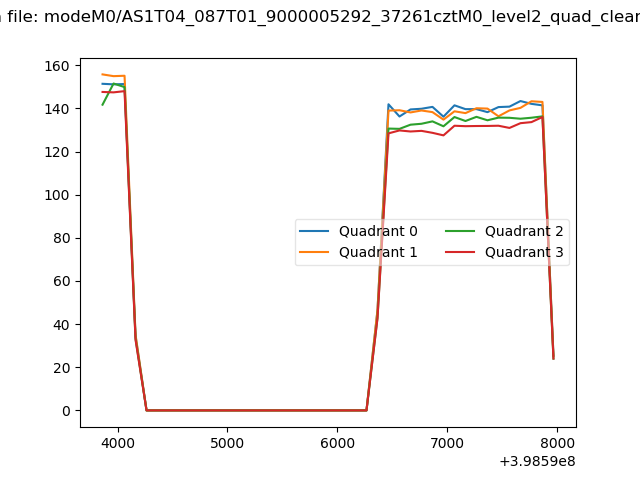 |
|
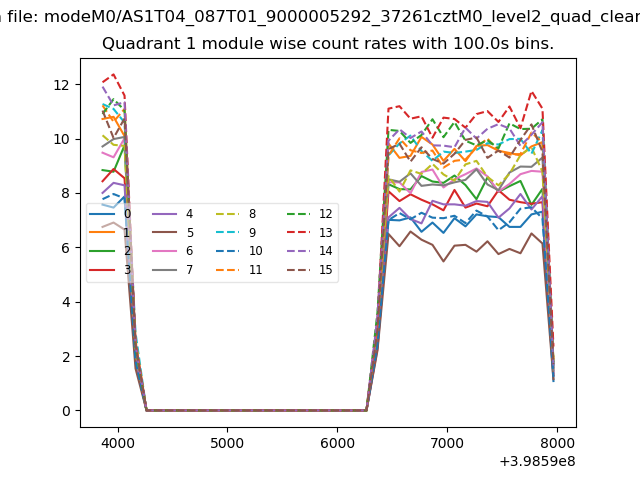
| Module-wise count rates for Quadrant A Data is divided into 100 sec bins |
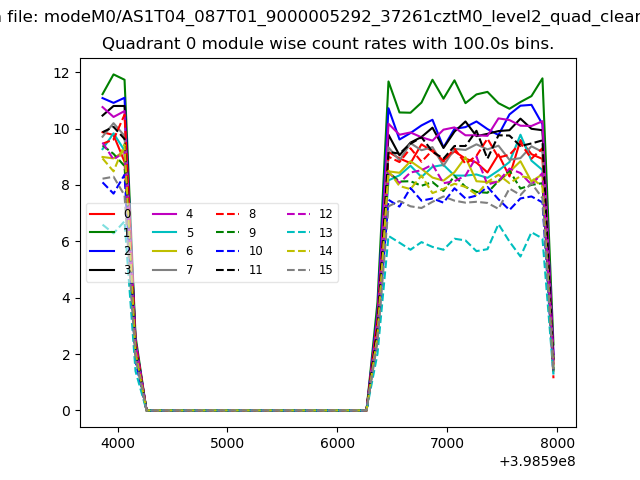 |
 |
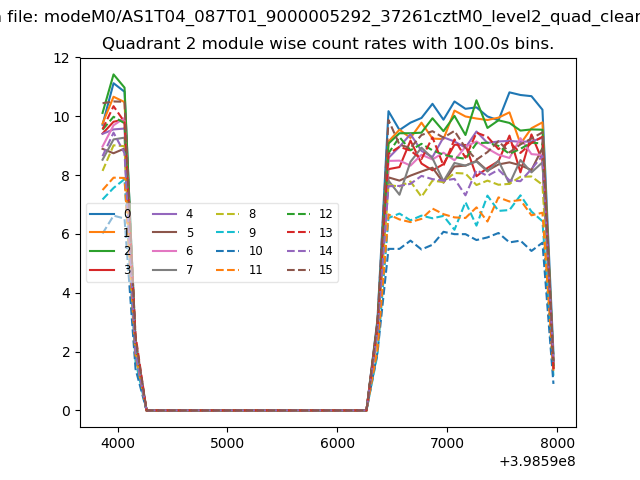
| Module-wise count rates for Quadrant B Data is divided into 100 sec bins |
 |
 |
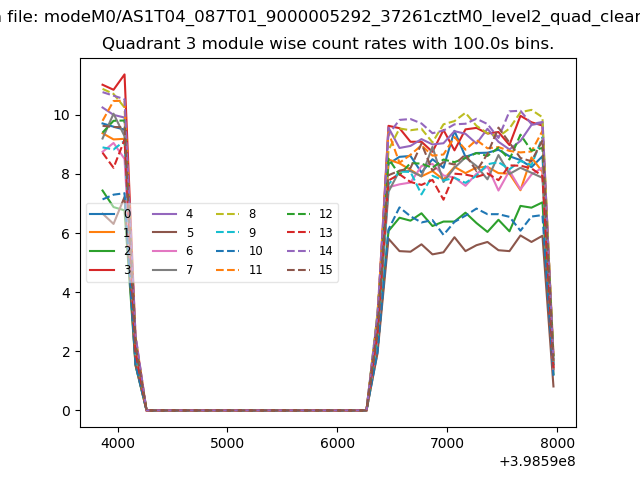
| Module-wise count rates for Quadrant C Data is divided into 100 sec bins |
 |
 |
| Module-wise count rates for Quadrant D Data is divided into 100 sec bins |
 |
 |
| Parameter | Plot |
|---|---|
| CZT HV Monitor | 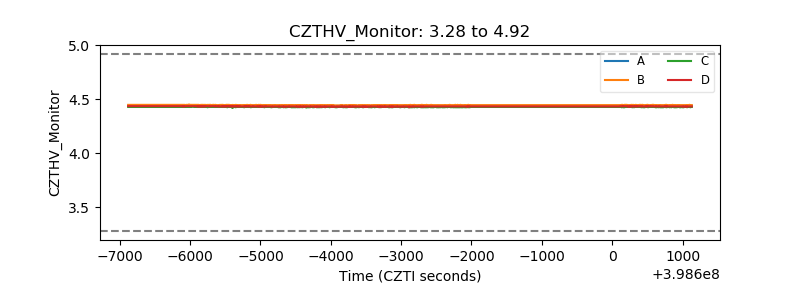 |
| D_VDD |  |
| Temperature 1 | 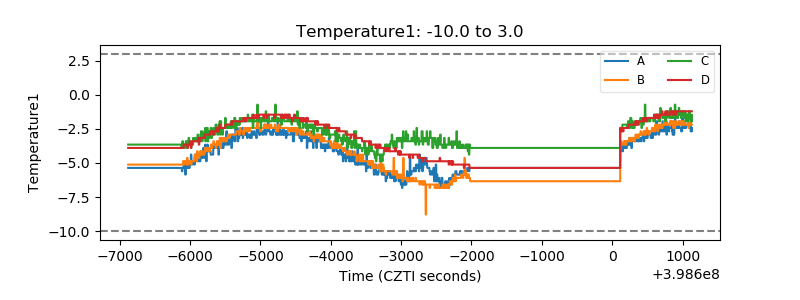 |
| Veto HV Monitor | 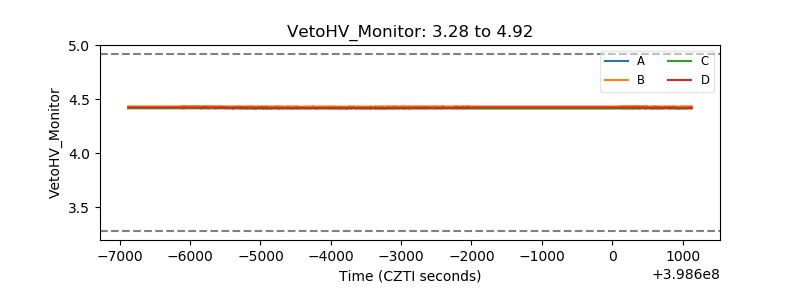 |
| Veto LLD | 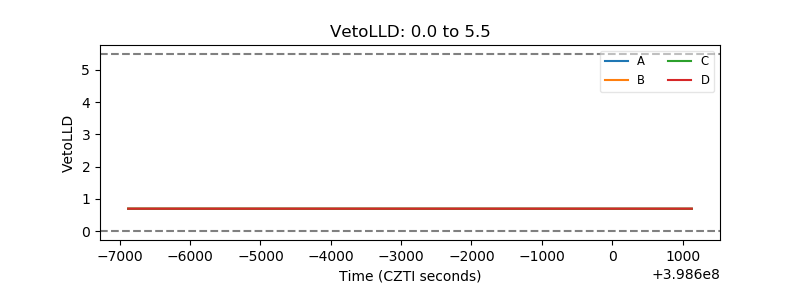 |
| Alpha Counter | 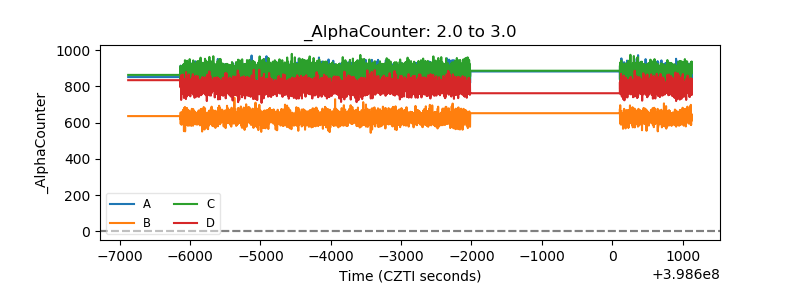 |
| _CPM_Rate | 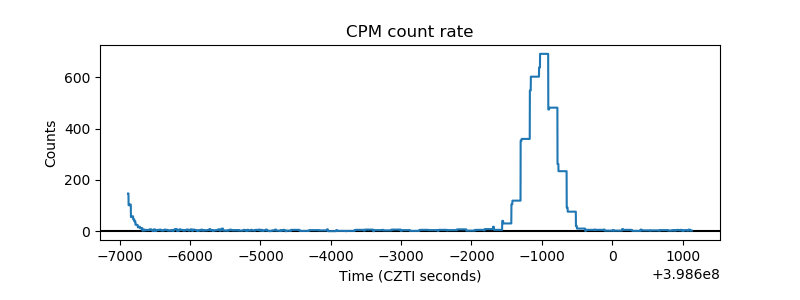 |
| CZT Counter | 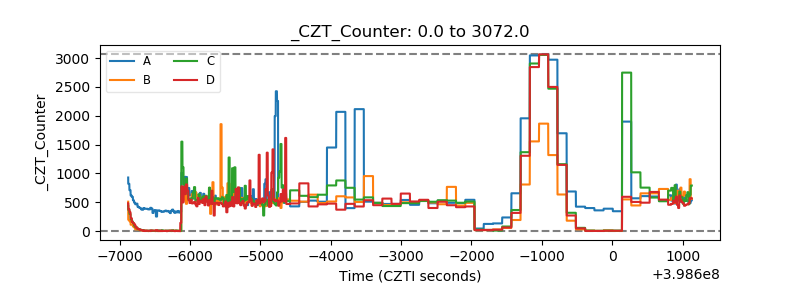 |
| +2.5 Volts monitor | 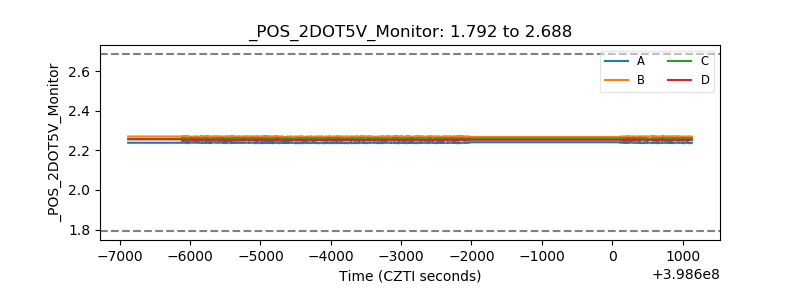 |
| +5 Volts monitor | 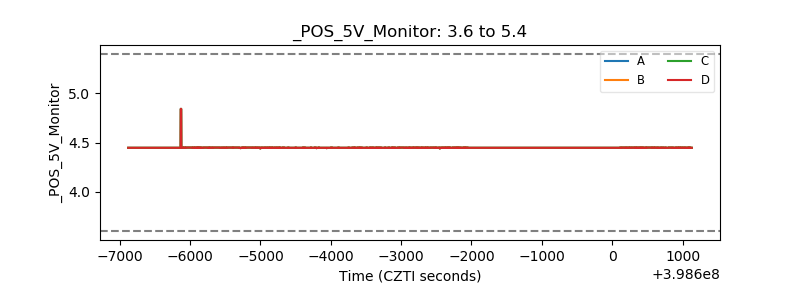 |
| _ROLL_ROT | 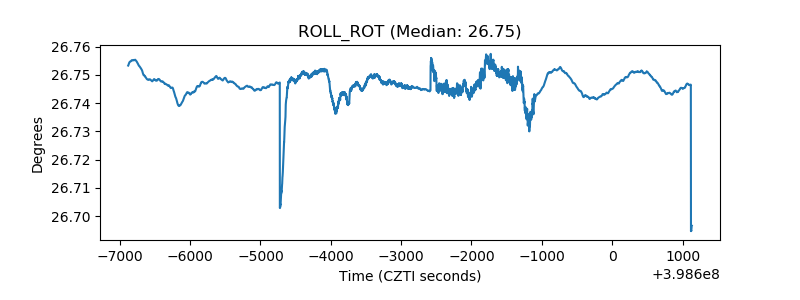 |
| _Roll_DEC | 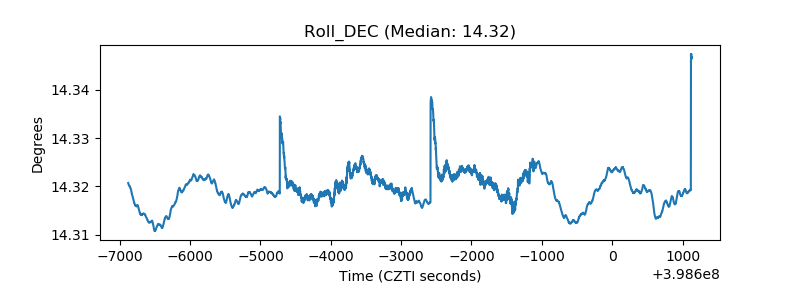 |
| _Roll_RA | 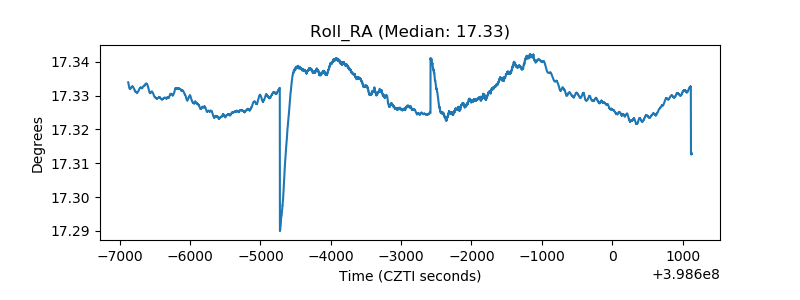 |
| Veto Counter | 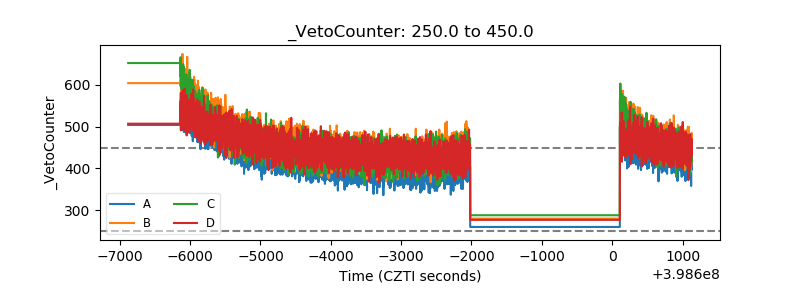 |