| Param | Original file | Final file |
|---|---|---|
| Filename | modeM0/AS1T04_087T01_9000005292_37262cztM0_level2.evt | modeM0/AS1T04_087T01_9000005292_37262cztM0_level2_quad_clean.evt |
| Size (bytes) | 425,407,680 | 46,877,760 |
| Size | 405.7 MB | 44.7 MB |
| Events in quadrant A | 3,144,096 | 274,226 |
| Events in quadrant B | 3,309,367 | 271,872 |
| Events in quadrant C | 3,244,823 | 262,518 |
| Events in quadrant D | 2,844,387 | 258,259 |
| Mode M9 | |||
|---|---|---|---|
| Quadrant | BADHDUFLAG | Total packets | Discarded packets |
| A | 0 | 26 | 0 |
| B | 0 | 26 | 0 |
| C | 0 | 26 | 0 |
| D | 0 | 27 | 0 |
| Mode SS | |||
|---|---|---|---|
| Quadrant | BADHDUFLAG | Total packets | Discarded packets |
| A | 0 | 102 | 0 |
| B | 0 | 102 | 0 |
| C | 0 | 102 | 0 |
| D | 0 | 102 | 0 |
| Mode M0 | |||
|---|---|---|---|
| Quadrant | BADHDUFLAG | Total packets | Discarded packets |
| A | 0 | 12378 | 3 |
| B | 0 | 13046 | 2 |
| C | 0 | 12740 | 2 |
| D | 0 | 11699 | 2 |
| Quadrant | Total seconds | Saturated seconds | Saturation percentage |
|---|---|---|---|
| A | 5020 | 185 | 3.685259% |
| B | 5020 | 133 | 2.649402% |
| C | 5020 | 59 | 1.175299% |
| D | 5020 | 108 | 2.151394% |
Noise dominated data is calculated using 1-second bins in cleaned event files. If a bin has >2000 counts, and if more than 50% of those come from <1% of pixels, then it is considered to be noise-dominated and hence unusable.
| Quadrant | # 1 sec bins | Bins with >0 counts | Bins with >2000 counts | High rate bins dominated by noise | Noise dominated (total time) | Noise dominated (detector-on time) | Marked lightcurve |
|---|---|---|---|---|---|---|---|
| A | 7138 | 5046 | 149 | 149 | 2.09% | 2.95% | 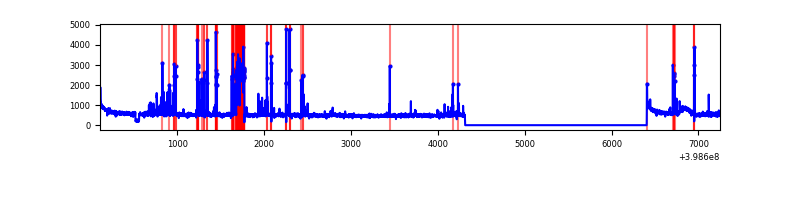 |
| B | 7138 | 5046 | 61 | 61 | 0.85% | 1.21% | 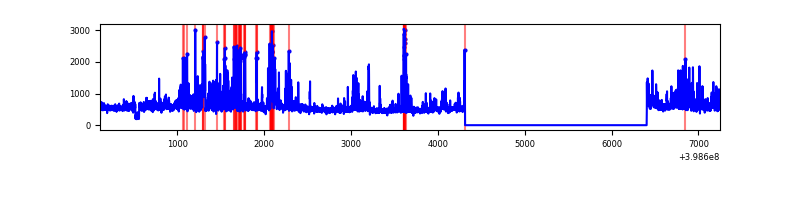 |
| C | 7138 | 5046 | 44 | 44 | 0.62% | 0.87% | 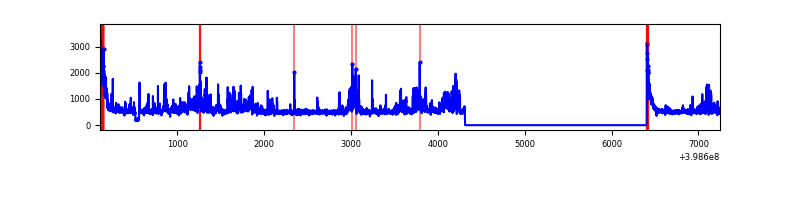 |
| D | 7138 | 5046 | 84 | 84 | 1.18% | 1.66% | 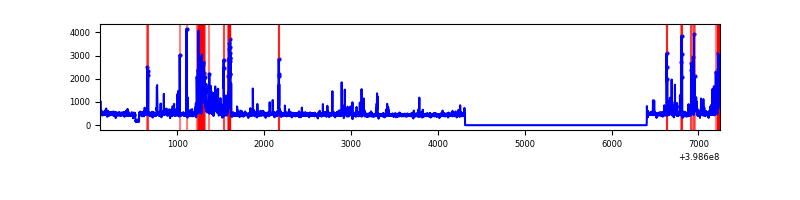 |
Top three noisy pixels from each quadrant. If the there are fewer than three noisy pixels in the level2.evt file, extra rows are filled as -1
| Pixel properties | Quadrant properties | ||||||
|---|---|---|---|---|---|---|---|
| Quadrant | DetID | PixID | Counts | Sigma | Mean | Median | Sigma |
| A | 15 | 237 | 473972 | 3913.34 | 595 | 584 | 121.0 |
| A | 10 | 83 | 261137 | 2153.91 | 595 | 584 | 121.0 |
| A | 13 | 248 | 74502 | 611.06 | 595 | 584 | 121.0 |
| B | 0 | 190 | 506196 | 4423.87 | 594 | 578 | 114.3 |
| B | 5 | 172 | 162283 | 1414.83 | 594 | 578 | 114.3 |
| B | 0 | 230 | 122929 | 1070.5 | 594 | 578 | 114.3 |
| C | 14 | 254 | 576776 | 4281.81 | 576 | 580 | 134.6 |
| C | 15 | 214 | 213837 | 1584.75 | 576 | 580 | 134.6 |
| C | 0 | 10 | 175579 | 1300.45 | 576 | 580 | 134.6 |
| D | 2 | 153 | 225649 | 1575.93 | 582 | 566 | 142.8 |
| D | 12 | 227 | 139296 | 971.32 | 582 | 566 | 142.8 |
| D | 2 | 249 | 96078 | 668.73 | 582 | 566 | 142.8 |
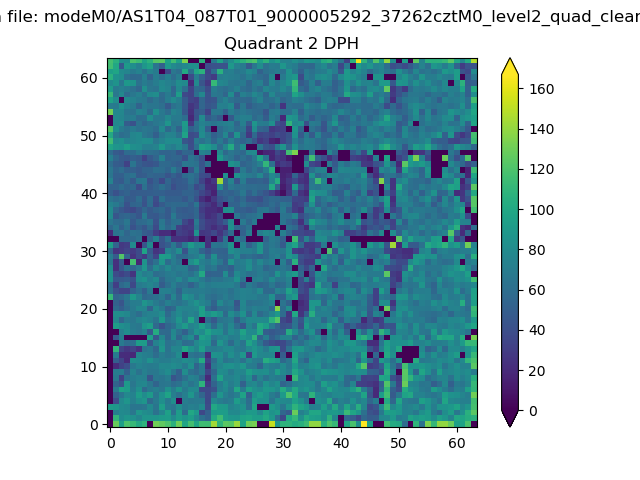
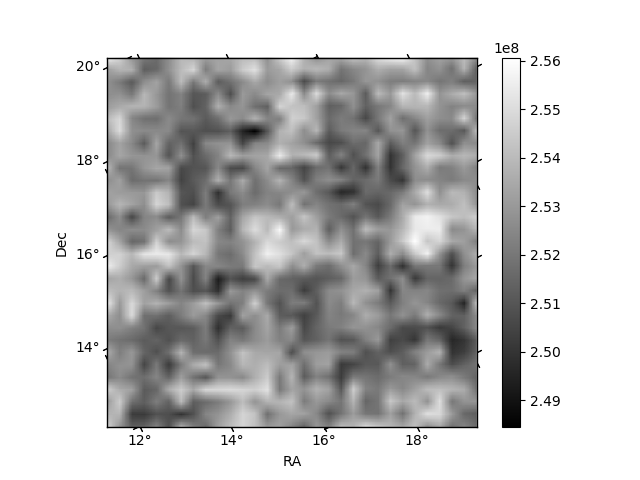
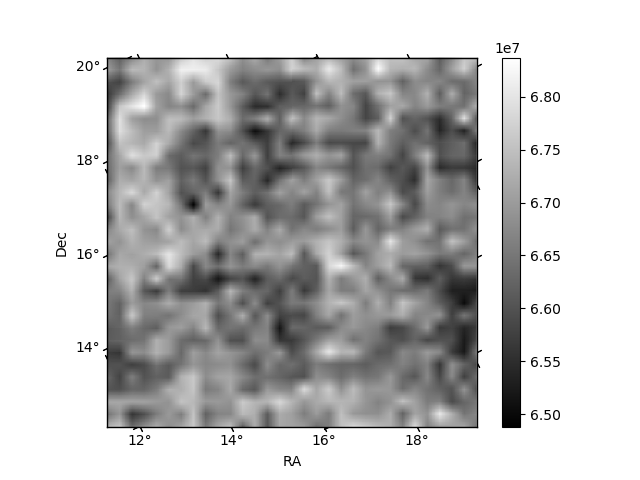
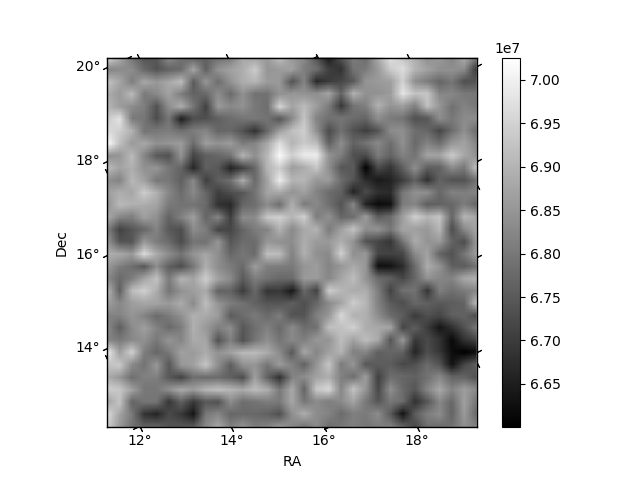
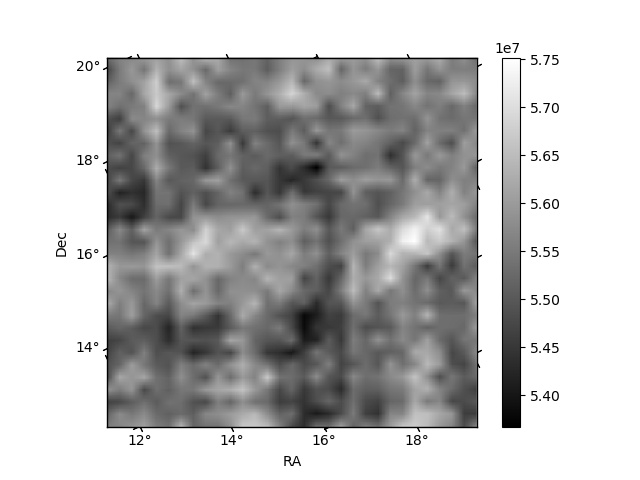
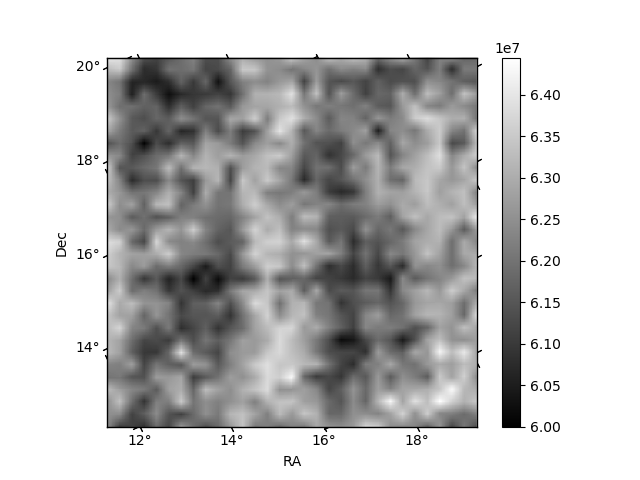
Histogram calculated using DETX and DETY for each event in the final _common_clean file
| Quadrant A | 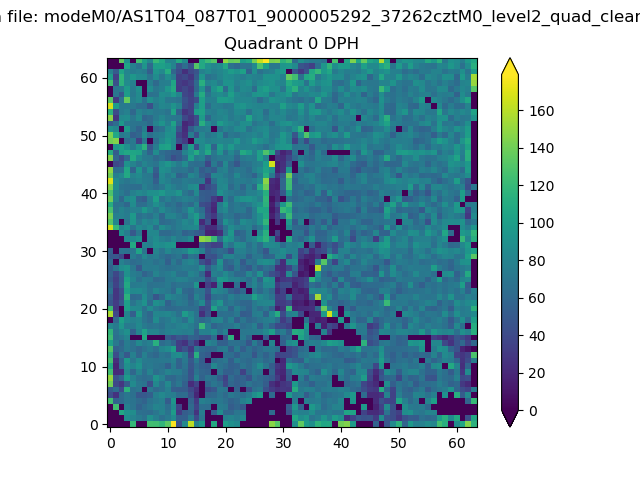 |
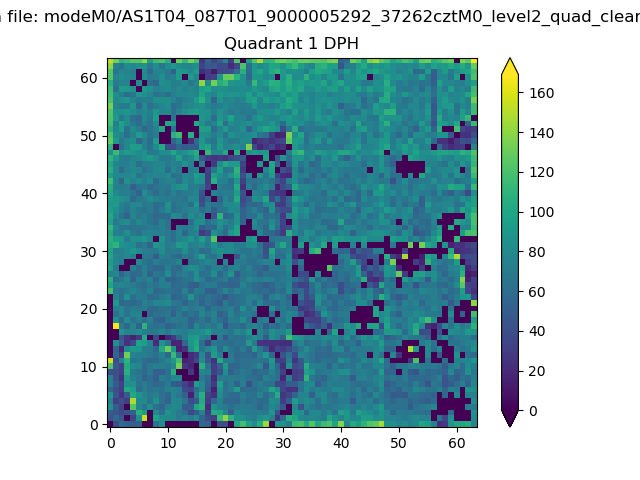 |
Quadrant B |
|---|---|---|---|
| Quadrant D | 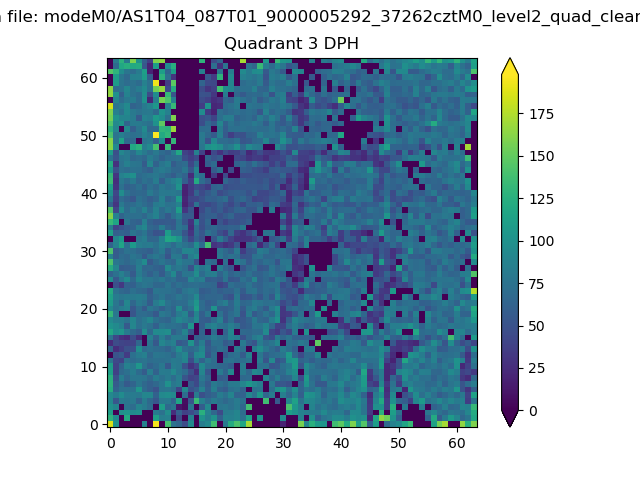 |
 |
Quadrant C |
| Plot type | Count rate plots | Images |
|---|---|---|
| Comparison with Poisson distribution Blue bars denote a histogram of data divided into 1 sec bins. Red curve is a Poisson curve with rate = median count rate of data. |
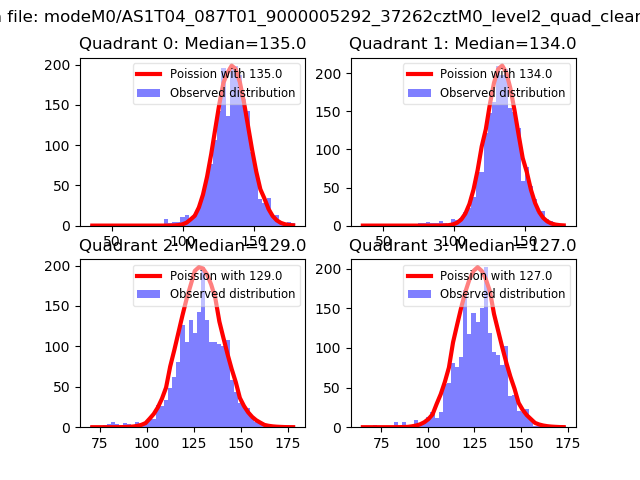 |
 |
| Quadrant-wise count rates Data is divided into 100 sec bins |
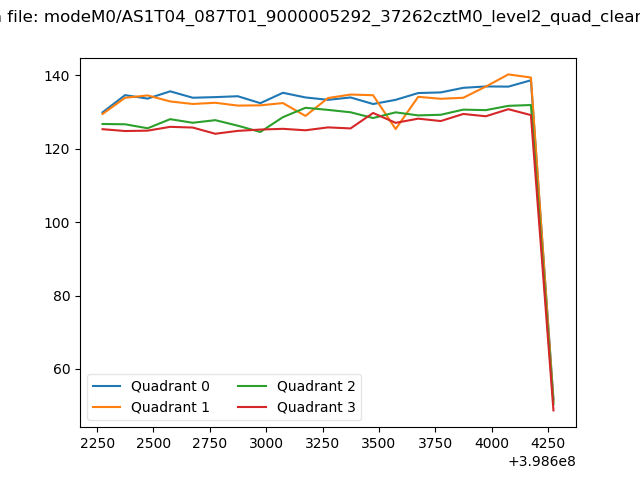 |
|
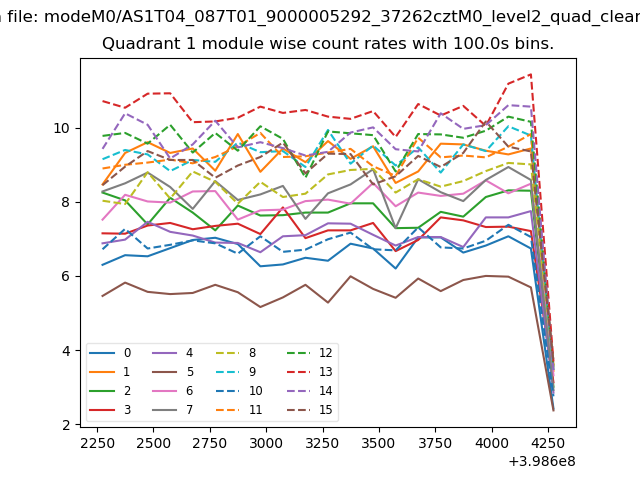
| Module-wise count rates for Quadrant A Data is divided into 100 sec bins |
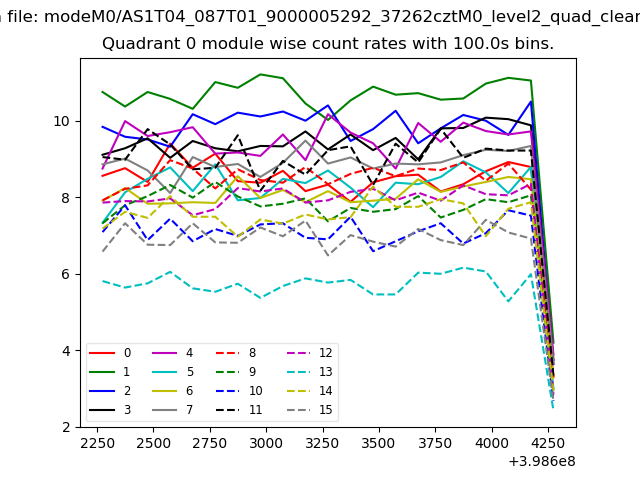 |
 |
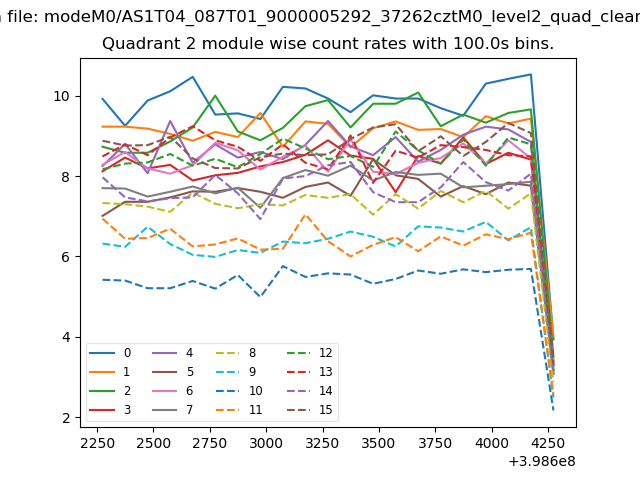
| Module-wise count rates for Quadrant B Data is divided into 100 sec bins |
 |
 |
| Module-wise count rates for Quadrant C Data is divided into 100 sec bins |
 |
 |
| Module-wise count rates for Quadrant D Data is divided into 100 sec bins |
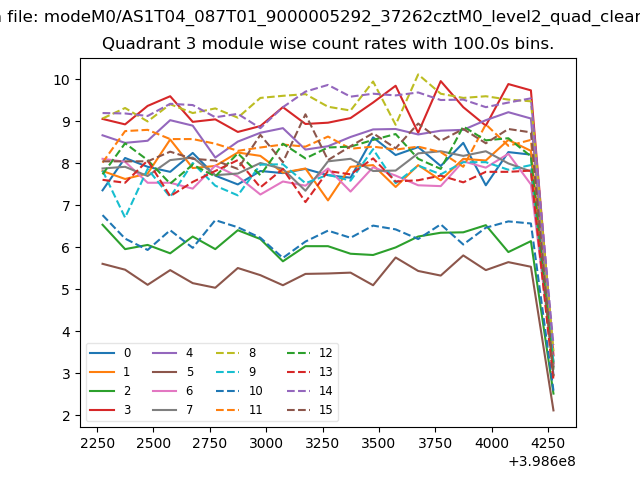 |
 |
| Parameter | Plot |
|---|---|
| CZT HV Monitor | 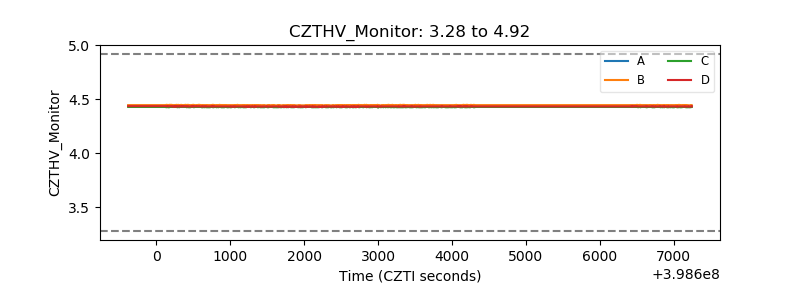 |
| D_VDD | 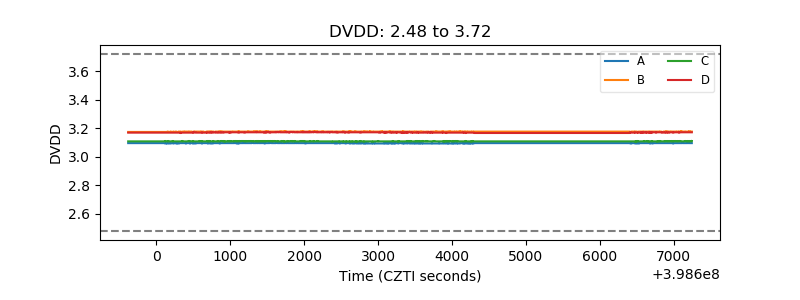 |
| Temperature 1 | 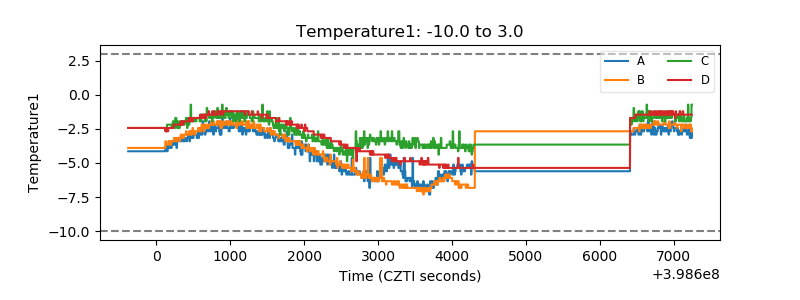 |
| Veto HV Monitor | 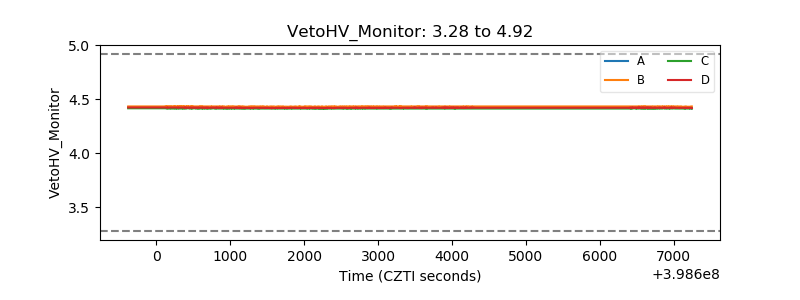 |
| Veto LLD | 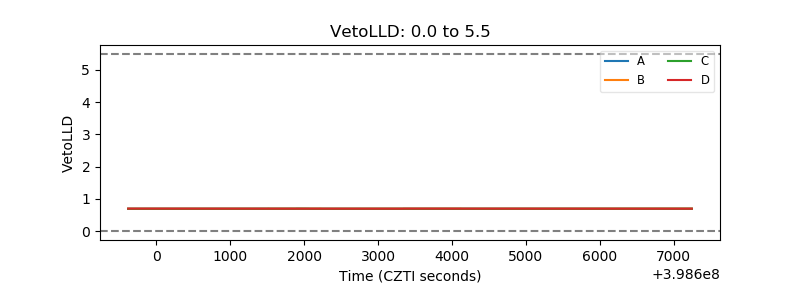 |
| Alpha Counter | 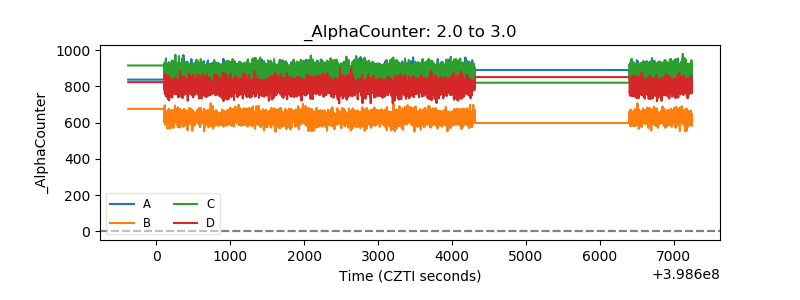 |
| _CPM_Rate | 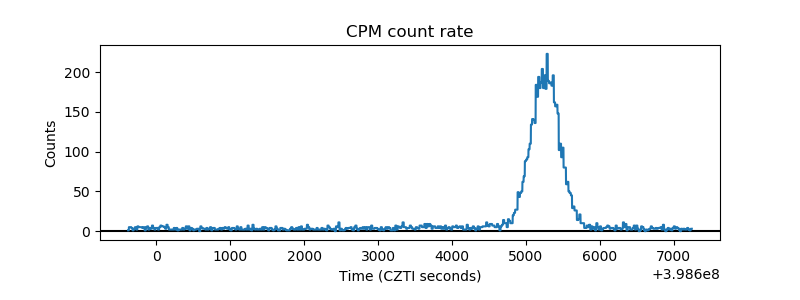 |
| CZT Counter | 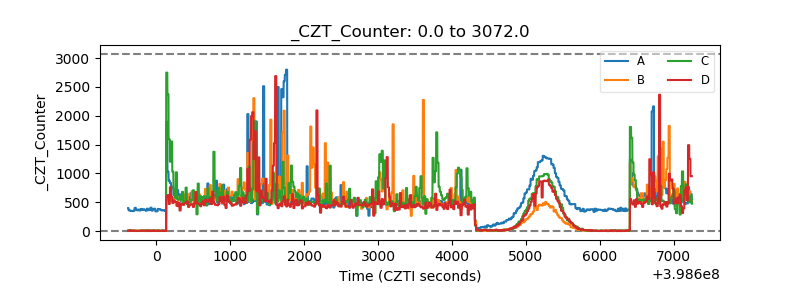 |
| +2.5 Volts monitor | 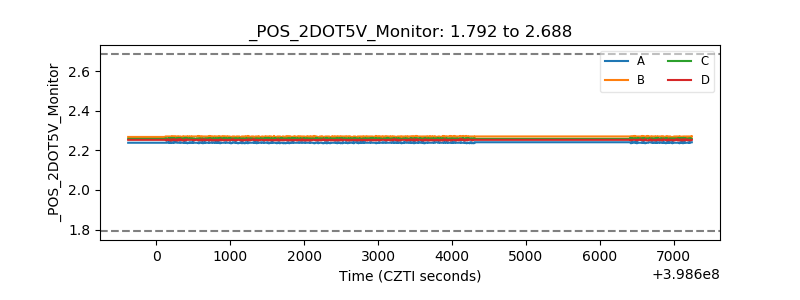 |
| +5 Volts monitor | 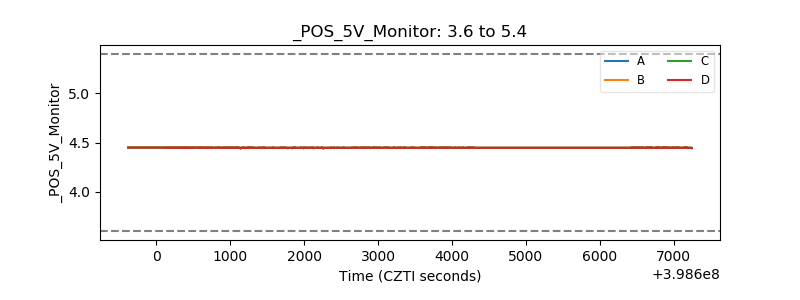 |
| _ROLL_ROT | 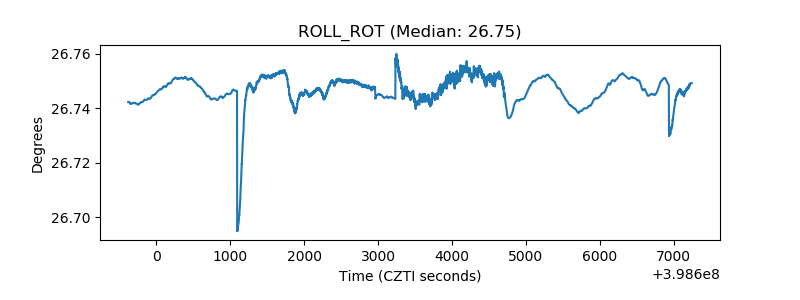 |
| _Roll_DEC | 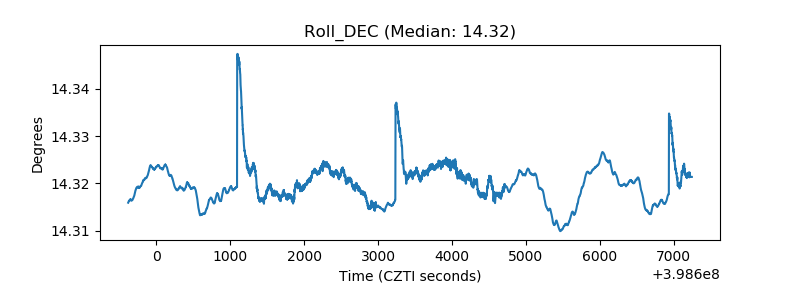 |
| _Roll_RA | 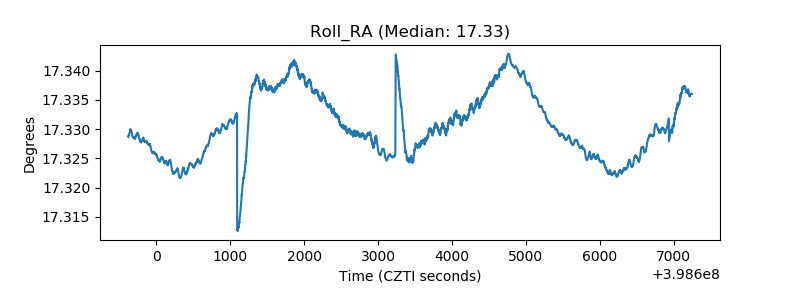 |
| Veto Counter | 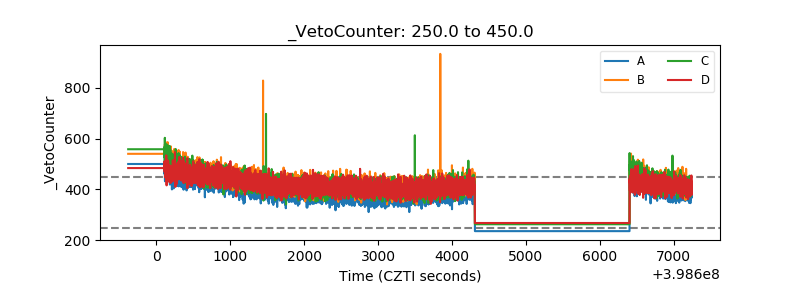 |