| Param | Original file | Final file |
|---|---|---|
| Filename | modeM0/AS1T04_087T01_9000005292_37263cztM0_level2.evt | modeM0/AS1T04_087T01_9000005292_37263cztM0_level2_quad_clean.evt |
| Size (bytes) | 419,400,000 | 56,764,800 |
| Size | 400.0 MB | 54.1 MB |
| Events in quadrant A | 3,032,381 | 345,874 |
| Events in quadrant B | 3,102,028 | 348,348 |
| Events in quadrant C | 2,863,633 | 335,208 |
| Events in quadrant D | 3,345,651 | 320,227 |
| Mode M9 | |||
|---|---|---|---|
| Quadrant | BADHDUFLAG | Total packets | Discarded packets |
| A | 0 | 30 | 0 |
| B | 0 | 30 | 0 |
| C | 0 | 30 | 0 |
| D | 0 | 31 | 0 |
| Mode SS | |||
|---|---|---|---|
| Quadrant | BADHDUFLAG | Total packets | Discarded packets |
| A | 0 | 108 | 0 |
| B | 0 | 108 | 0 |
| C | 0 | 108 | 0 |
| D | 0 | 108 | 0 |
| Mode M0 | |||
|---|---|---|---|
| Quadrant | BADHDUFLAG | Total packets | Discarded packets |
| A | 0 | 12289 | 3 |
| B | 0 | 12709 | 2 |
| C | 0 | 11627 | 2 |
| D | 0 | 13578 | 2 |
| Quadrant | Total seconds | Saturated seconds | Saturation percentage |
|---|---|---|---|
| A | 5264 | 99 | 1.880699% |
| B | 5264 | 78 | 1.481763% |
| C | 5264 | 47 | 0.892857% |
| D | 5264 | 236 | 4.483283% |
Noise dominated data is calculated using 1-second bins in cleaned event files. If a bin has >2000 counts, and if more than 50% of those come from <1% of pixels, then it is considered to be noise-dominated and hence unusable.
| Quadrant | # 1 sec bins | Bins with >0 counts | Bins with >2000 counts | High rate bins dominated by noise | Noise dominated (total time) | Noise dominated (detector-on time) | Marked lightcurve |
|---|---|---|---|---|---|---|---|
| A | 7087 | 5265 | 62 | 62 | 0.87% | 1.18% | 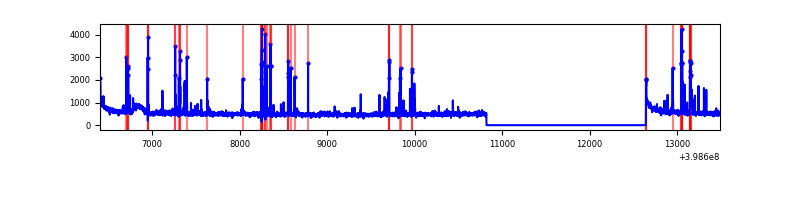 |
| B | 7087 | 5265 | 28 | 28 | 0.40% | 0.53% | 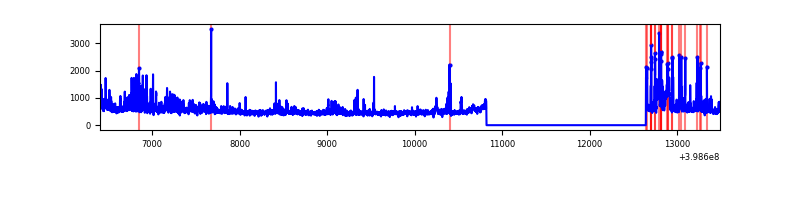 |
| C | 7087 | 5265 | 33 | 33 | 0.47% | 0.63% | 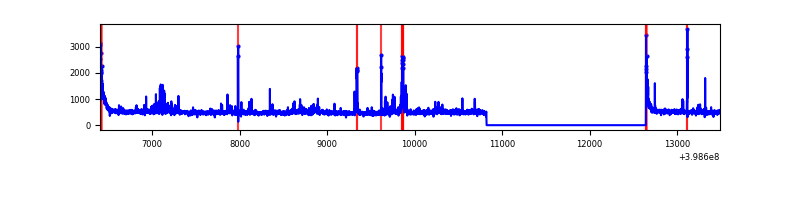 |
| D | 7087 | 5265 | 185 | 185 | 2.61% | 3.51% | 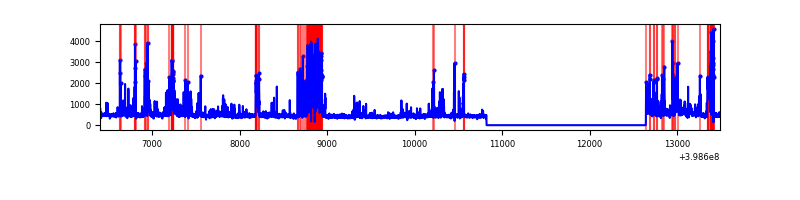 |
Top three noisy pixels from each quadrant. If the there are fewer than three noisy pixels in the level2.evt file, extra rows are filled as -1
| Pixel properties | Quadrant properties | ||||||
|---|---|---|---|---|---|---|---|
| Quadrant | DetID | PixID | Counts | Sigma | Mean | Median | Sigma |
| A | 10 | 83 | 271406 | 2202.09 | 609 | 598 | 123.0 |
| A | 15 | 237 | 181955 | 1474.71 | 609 | 598 | 123.0 |
| A | 15 | 222 | 66372 | 534.84 | 609 | 598 | 123.0 |
| B | 0 | 190 | 219038 | 1863.94 | 605 | 590 | 117.2 |
| B | 5 | 172 | 208789 | 1776.49 | 605 | 590 | 117.2 |
| B | 0 | 213 | 134427 | 1141.98 | 605 | 590 | 117.2 |
| C | 15 | 214 | 224445 | 1630.86 | 587 | 590 | 137.3 |
| C | 14 | 254 | 189558 | 1376.7 | 587 | 590 | 137.3 |
| C | 0 | 10 | 107247 | 777.03 | 587 | 590 | 137.3 |
| D | 2 | 249 | 526680 | 3681.28 | 583 | 568 | 142.9 |
| D | 13 | 249 | 290229 | 2026.8 | 583 | 568 | 142.9 |
| D | 2 | 153 | 174443 | 1216.63 | 583 | 568 | 142.9 |
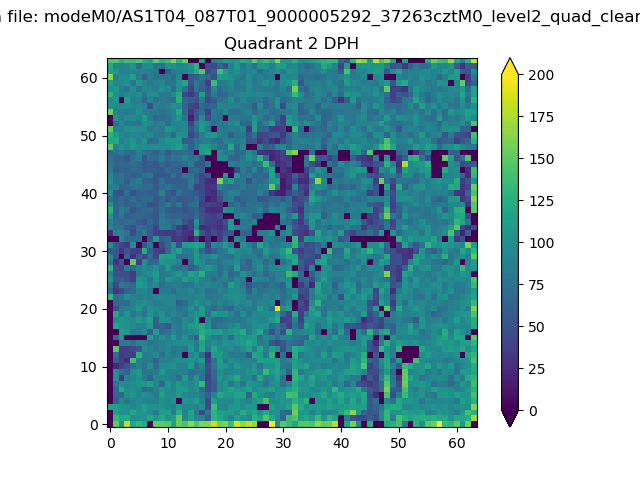
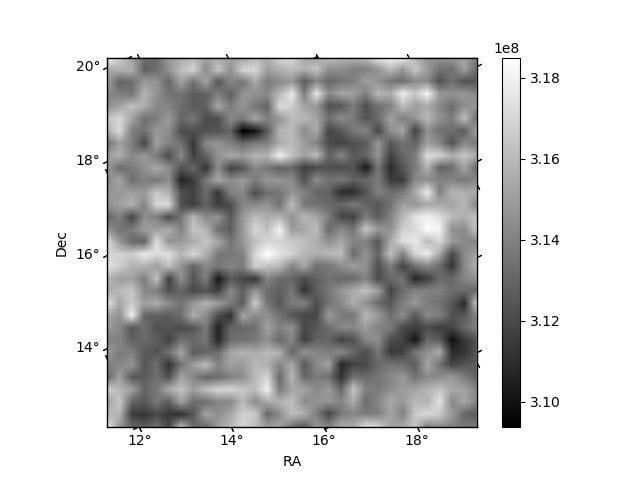
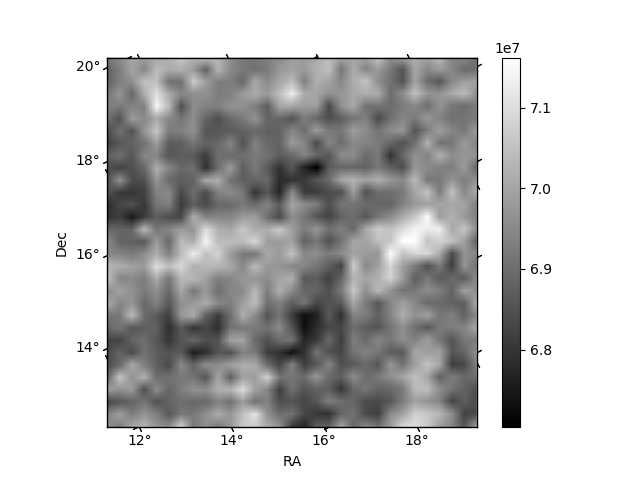
Histogram calculated using DETX and DETY for each event in the final _common_clean file
| Quadrant A | 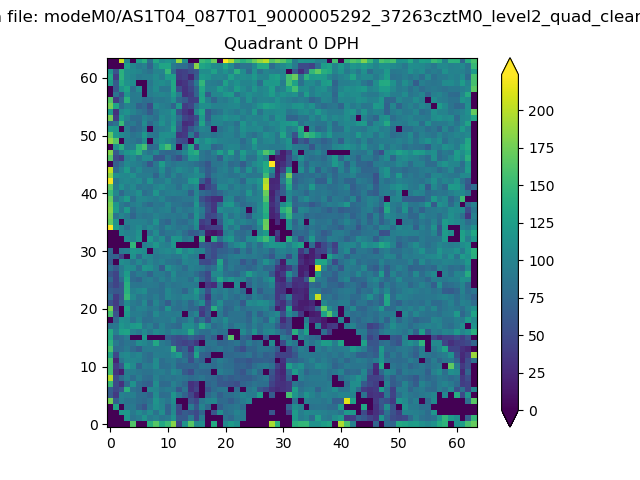 |
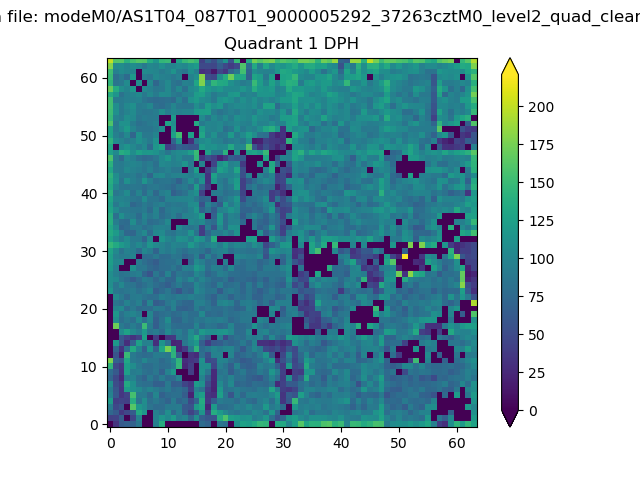 |
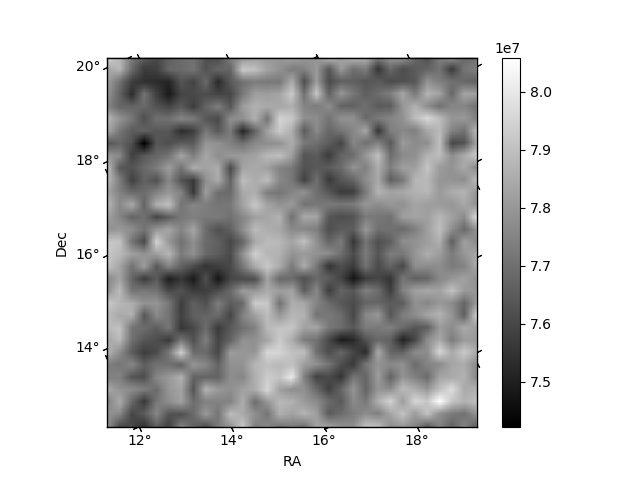
Quadrant B |
|---|---|---|---|
| Quadrant D | 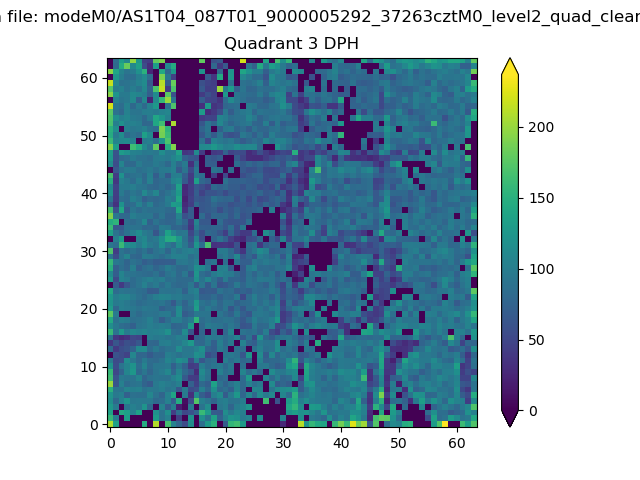 |
 |
Quadrant C |
| Plot type | Count rate plots | Images |
|---|---|---|
| Comparison with Poisson distribution Blue bars denote a histogram of data divided into 1 sec bins. Red curve is a Poisson curve with rate = median count rate of data. |
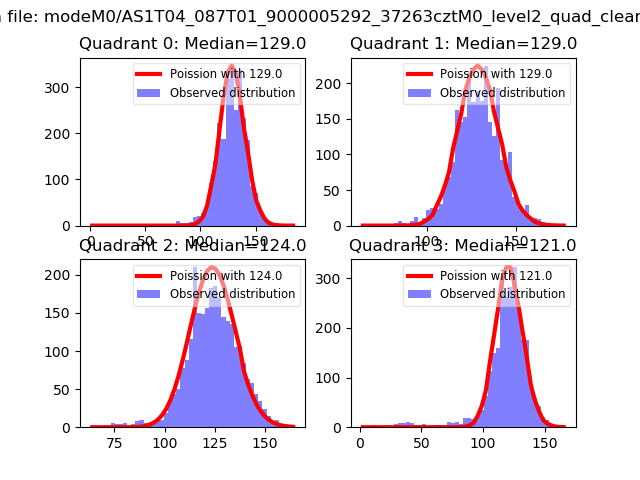 |
 |
| Quadrant-wise count rates Data is divided into 100 sec bins |
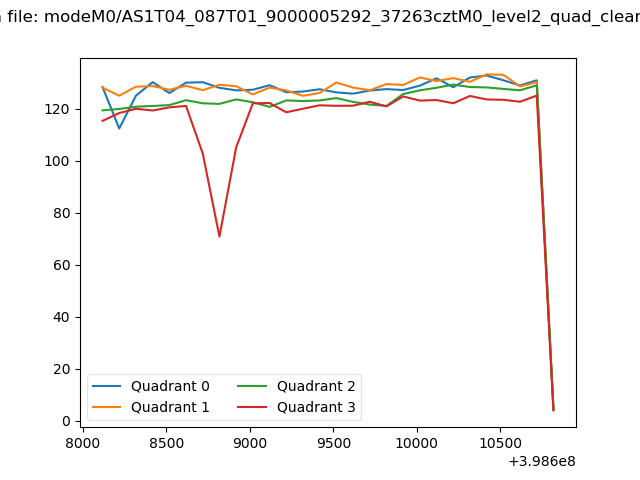 |
|
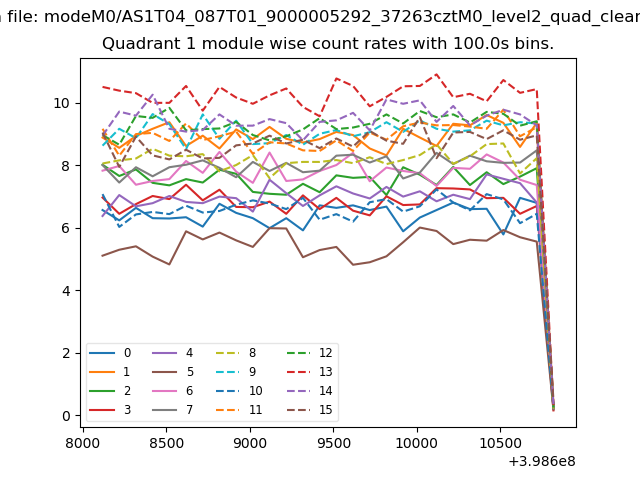
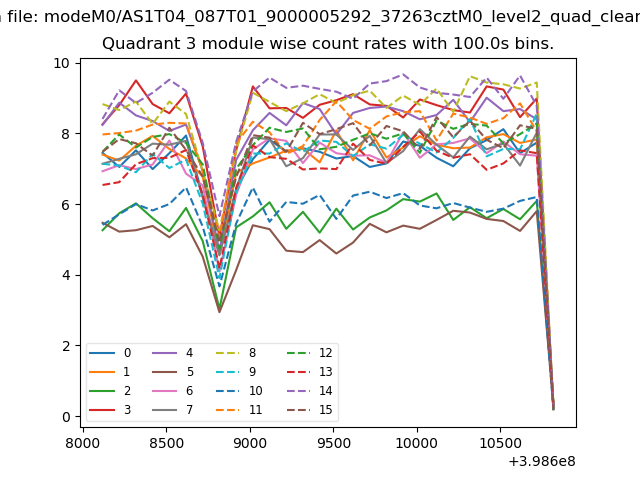
| Module-wise count rates for Quadrant A Data is divided into 100 sec bins |
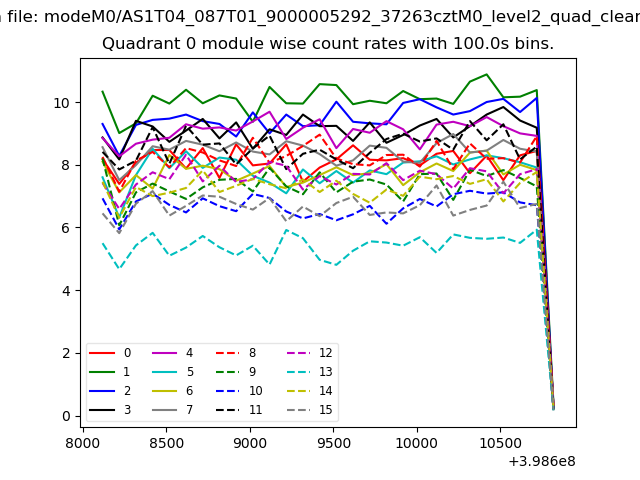 |
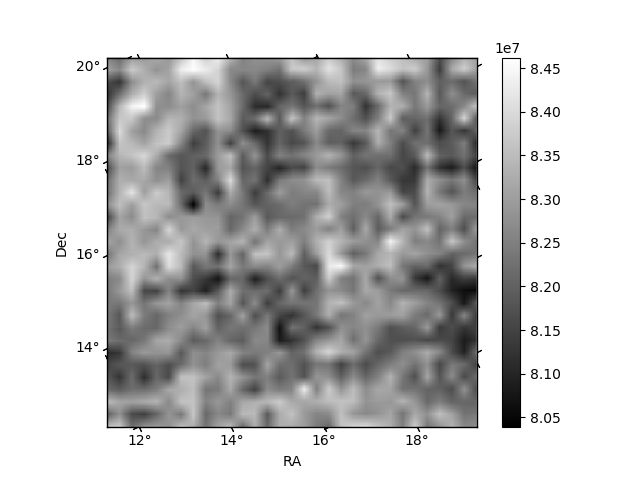 |
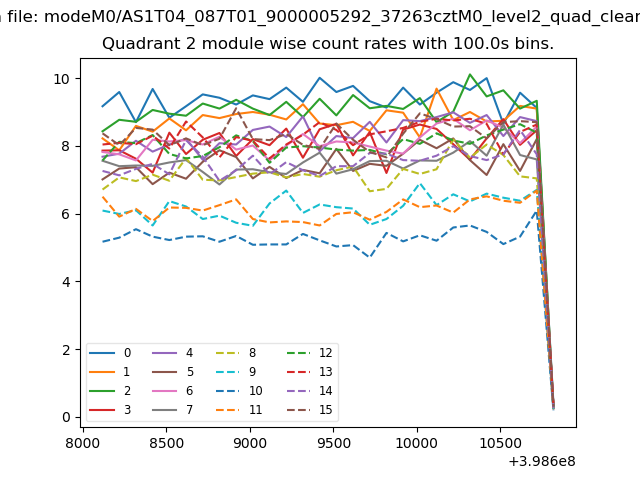
| Module-wise count rates for Quadrant B Data is divided into 100 sec bins |
 |
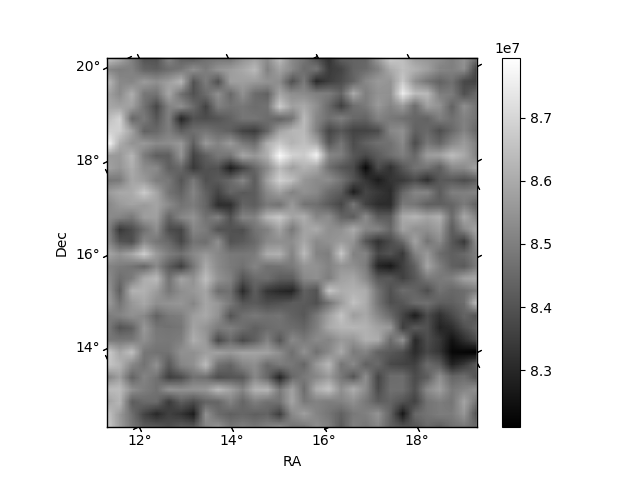 |
| Module-wise count rates for Quadrant C Data is divided into 100 sec bins |
 |
 |
| Module-wise count rates for Quadrant D Data is divided into 100 sec bins |
 |
 |
| Parameter | Plot |
|---|---|
| CZT HV Monitor | 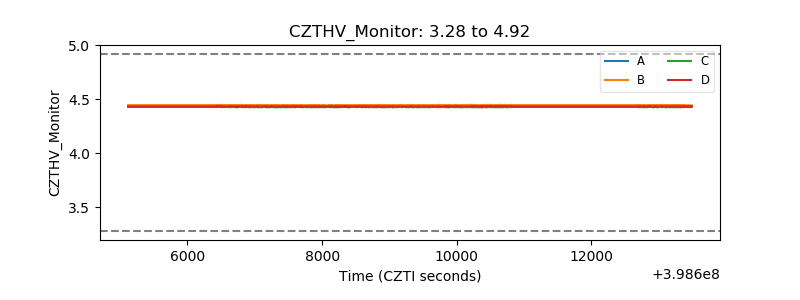 |
| D_VDD | 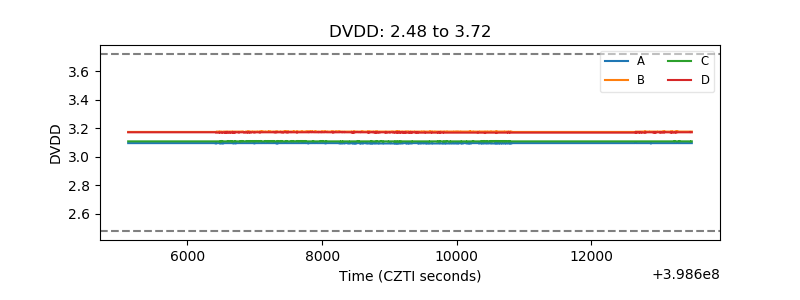 |
| Temperature 1 | 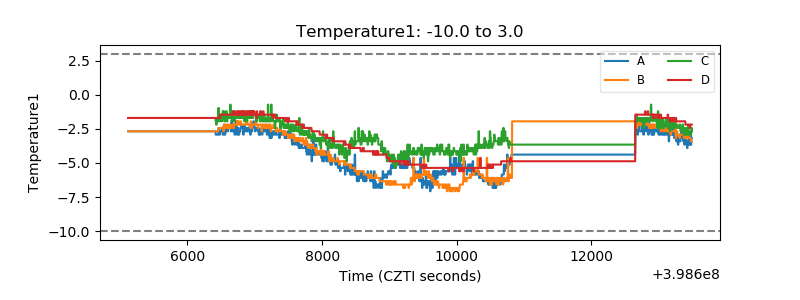 |
| Veto HV Monitor | 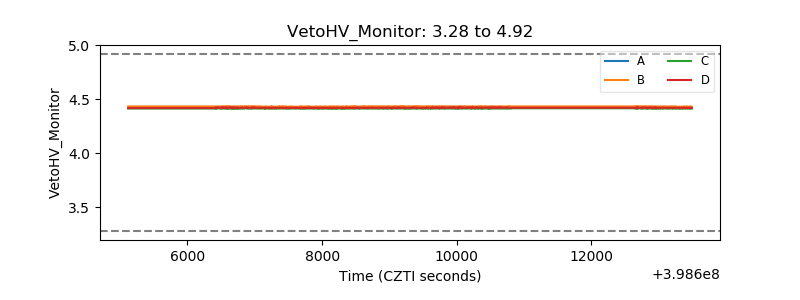 |
| Veto LLD | 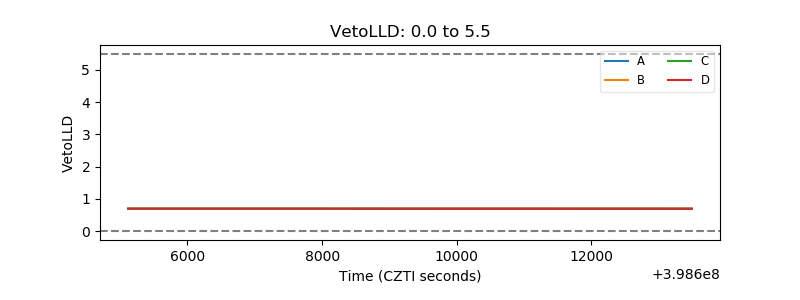 |
| Alpha Counter | 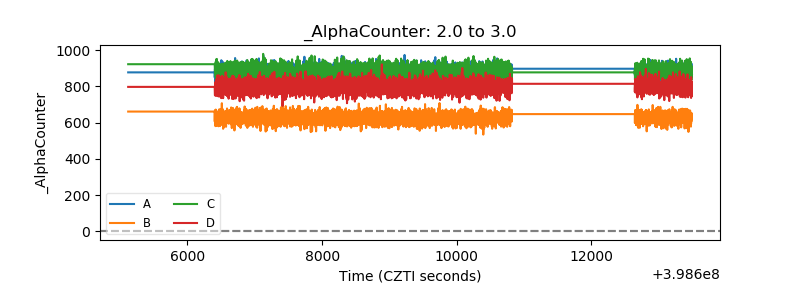 |
| _CPM_Rate | 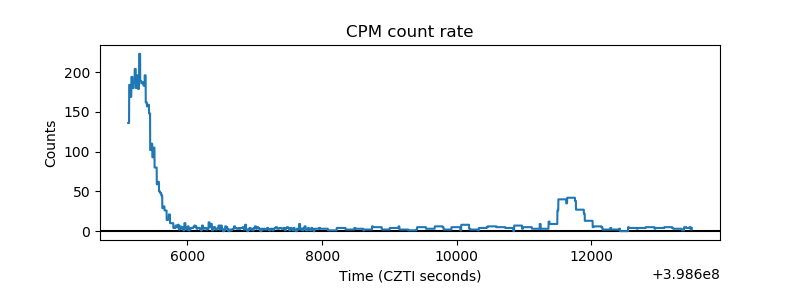 |
| CZT Counter | 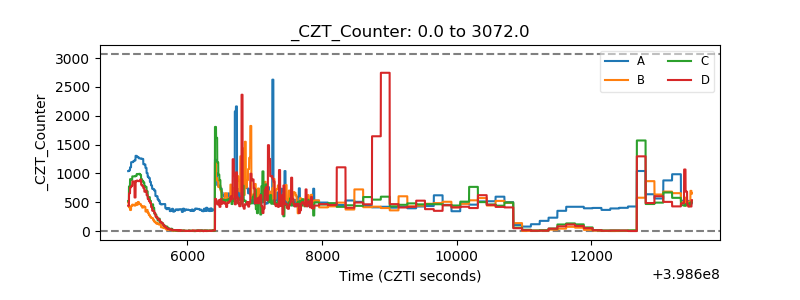 |
| +2.5 Volts monitor | 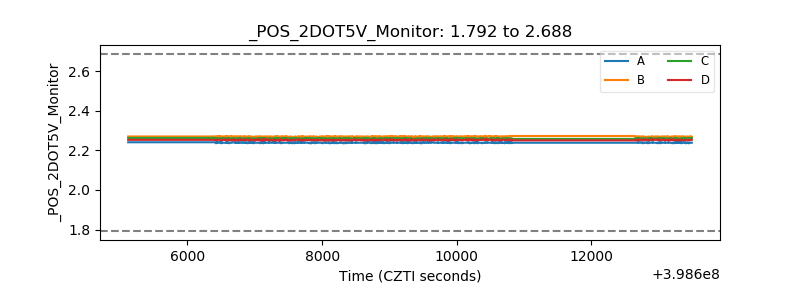 |
| +5 Volts monitor | 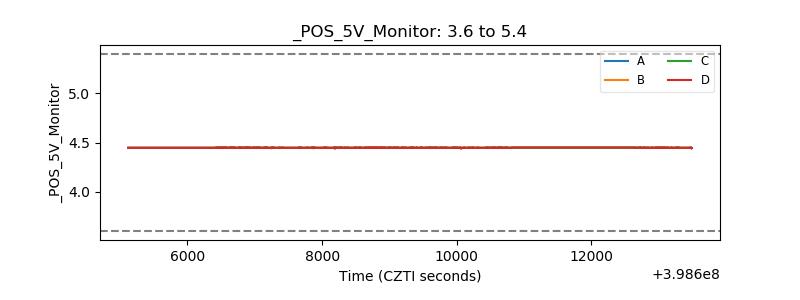 |
| _ROLL_ROT | 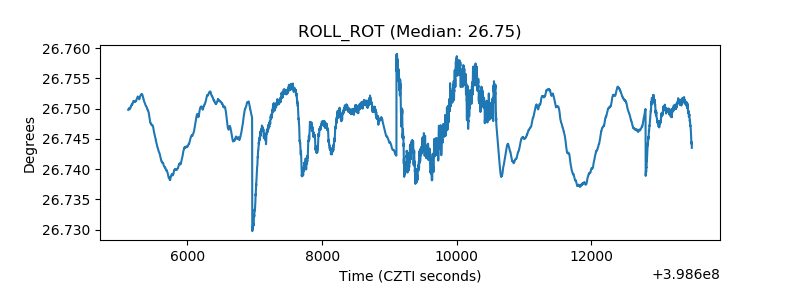 |
| _Roll_DEC | 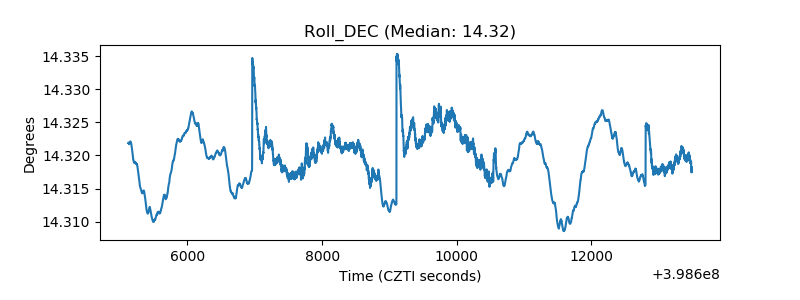 |
| _Roll_RA | 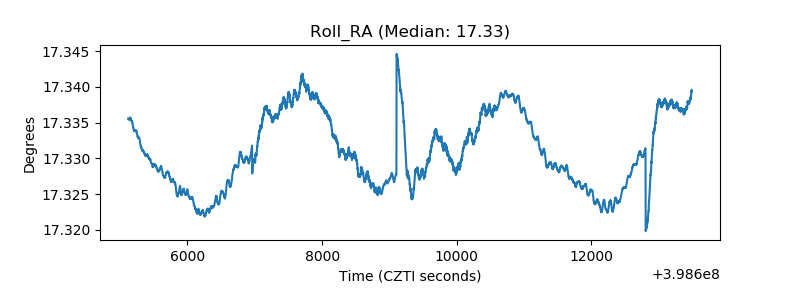 |
| Veto Counter | 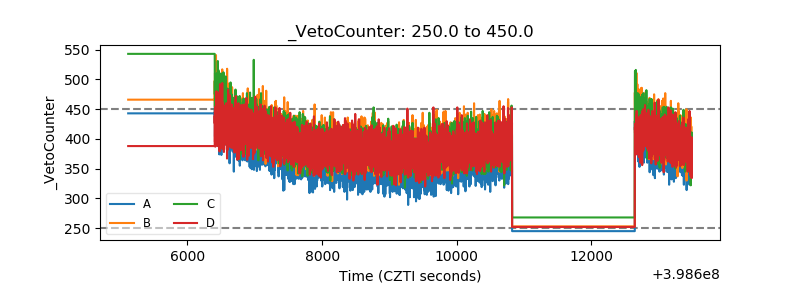 |