| Param | Original file | Final file |
|---|---|---|
| Filename | modeM0/AS1T04_087T01_9000005292_37264cztM0_level2.evt | modeM0/AS1T04_087T01_9000005292_37264cztM0_level2_quad_clean.evt |
| Size (bytes) | 481,711,680 | 68,313,600 |
| Size | 459.4 MB | 65.1 MB |
| Events in quadrant A | 4,543,021 | 418,719 |
| Events in quadrant B | 3,409,647 | 434,995 |
| Events in quadrant C | 2,973,030 | 419,801 |
| Events in quadrant D | 3,282,841 | 402,700 |
| Mode M9 | |||
|---|---|---|---|
| Quadrant | BADHDUFLAG | Total packets | Discarded packets |
| A | 0 | 24 | 0 |
| B | 0 | 24 | 0 |
| C | 0 | 24 | 0 |
| D | 0 | 25 | 0 |
| Mode SS | |||
|---|---|---|---|
| Quadrant | BADHDUFLAG | Total packets | Discarded packets |
| A | 0 | 116 | 0 |
| B | 0 | 116 | 0 |
| C | 0 | 116 | 0 |
| D | 0 | 116 | 0 |
| Mode M0 | |||
|---|---|---|---|
| Quadrant | BADHDUFLAG | Total packets | Discarded packets |
| A | 0 | 17186 | 3 |
| B | 0 | 13834 | 2 |
| C | 0 | 12202 | 2 |
| D | 0 | 13598 | 2 |
| Quadrant | Total seconds | Saturated seconds | Saturation percentage |
|---|---|---|---|
| A | 5599 | 299 | 5.340239% |
| B | 5599 | 137 | 2.446866% |
| C | 5599 | 74 | 1.321665% |
| D | 5599 | 188 | 3.357742% |
Noise dominated data is calculated using 1-second bins in cleaned event files. If a bin has >2000 counts, and if more than 50% of those come from <1% of pixels, then it is considered to be noise-dominated and hence unusable.
| Quadrant | # 1 sec bins | Bins with >0 counts | Bins with >2000 counts | High rate bins dominated by noise | Noise dominated (total time) | Noise dominated (detector-on time) | Marked lightcurve |
|---|---|---|---|---|---|---|---|
| A | 7091 | 5600 | 335 | 335 | 4.72% | 5.98% | 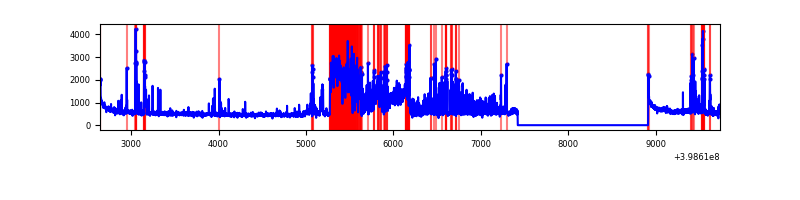 |
| B | 7091 | 5600 | 67 | 67 | 0.94% | 1.20% | 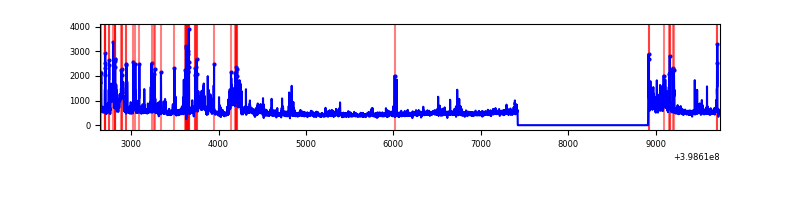 |
| C | 7091 | 5600 | 54 | 54 | 0.76% | 0.96% | 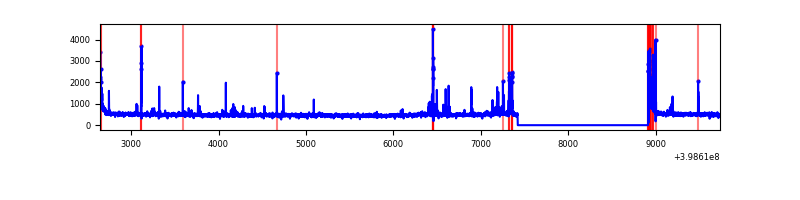 |
| D | 7091 | 5600 | 151 | 151 | 2.13% | 2.70% | 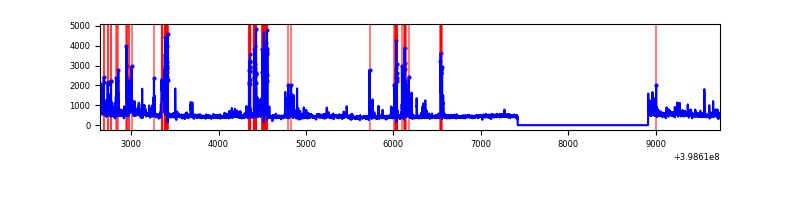 |
Top three noisy pixels from each quadrant. If the there are fewer than three noisy pixels in the level2.evt file, extra rows are filled as -1
| Pixel properties | Quadrant properties | ||||||
|---|---|---|---|---|---|---|---|
| Quadrant | DetID | PixID | Counts | Sigma | Mean | Median | Sigma |
| A | 15 | 223 | 1544263 | 11942.86 | 634 | 622 | 129.3 |
| A | 10 | 83 | 280417 | 2164.72 | 634 | 622 | 129.3 |
| A | 15 | 237 | 178440 | 1375.74 | 634 | 622 | 129.3 |
| B | 5 | 172 | 298962 | 2433.31 | 632 | 615 | 122.6 |
| B | 0 | 213 | 281881 | 2294.0 | 632 | 615 | 122.6 |
| B | 0 | 190 | 125397 | 1017.72 | 632 | 615 | 122.6 |
| C | 15 | 214 | 237803 | 1610.9 | 617 | 621 | 147.2 |
| C | 14 | 254 | 189351 | 1281.83 | 617 | 621 | 147.2 |
| C | 0 | 10 | 101964 | 688.31 | 617 | 621 | 147.2 |
| D | 13 | 249 | 518594 | 3409.73 | 614 | 597 | 151.9 |
| D | 2 | 153 | 133313 | 873.61 | 614 | 597 | 151.9 |
| D | 2 | 249 | 96941 | 634.19 | 614 | 597 | 151.9 |
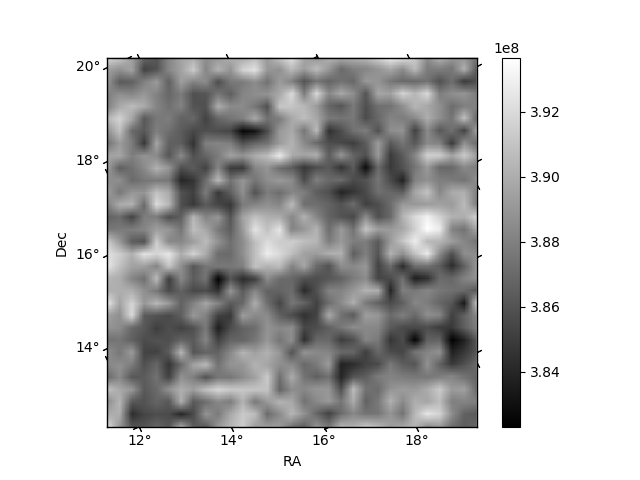
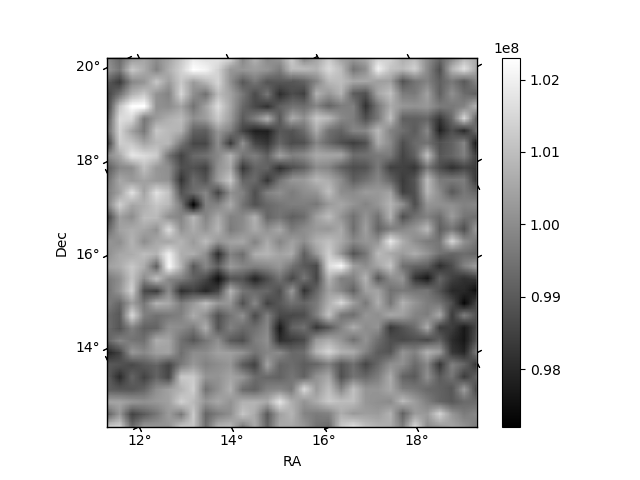
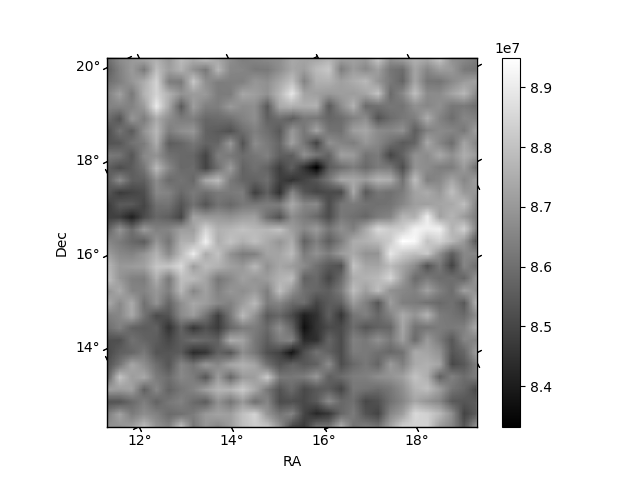
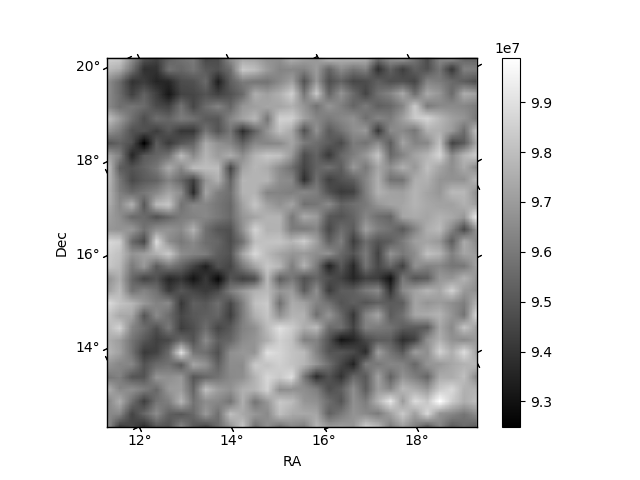
Histogram calculated using DETX and DETY for each event in the final _common_clean file
| Quadrant A | 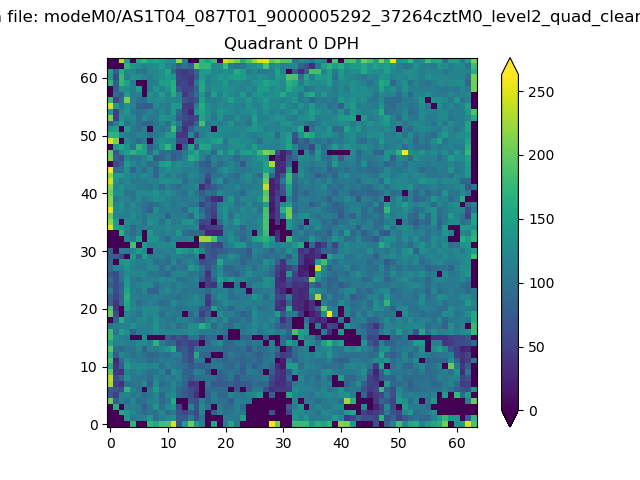 |
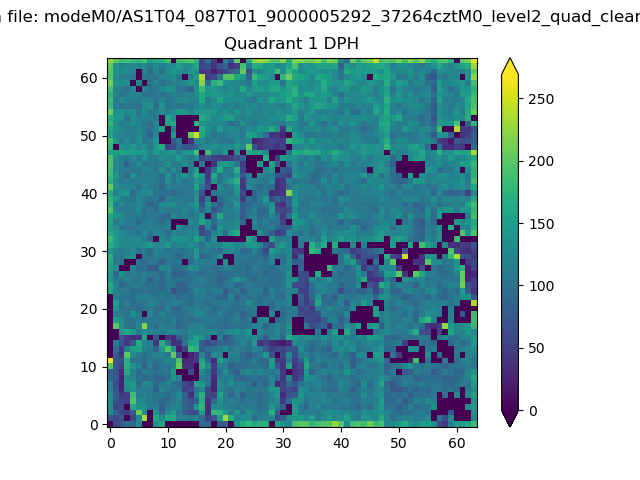 |
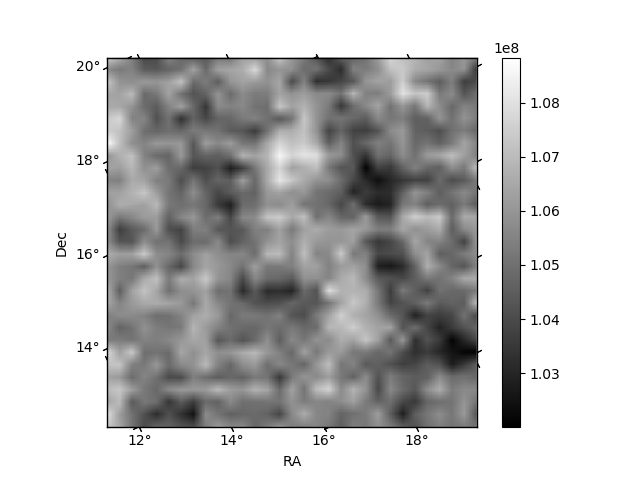
Quadrant B |
|---|---|---|---|
| Quadrant D | 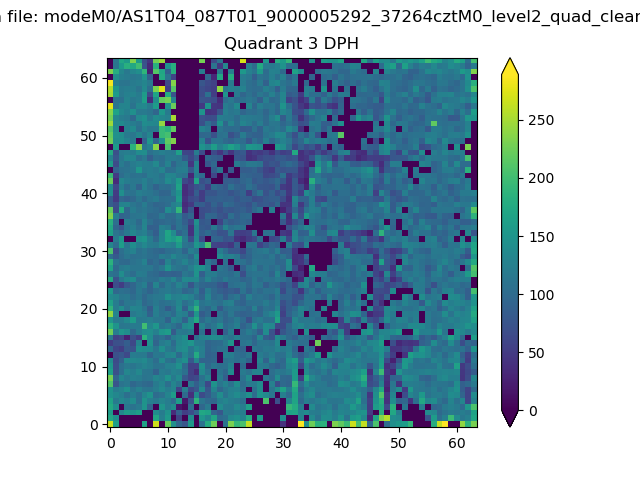 |
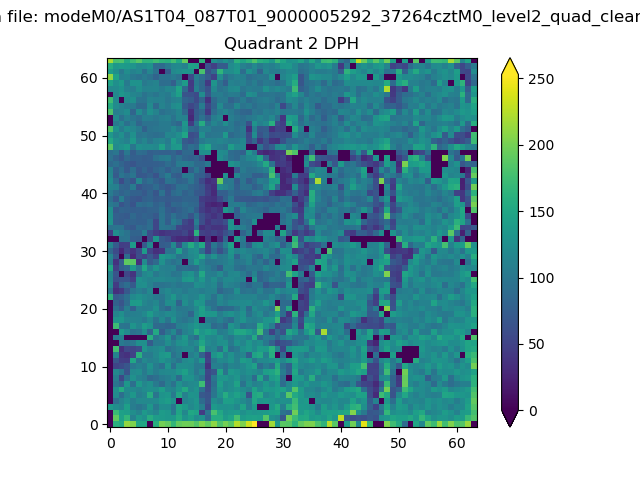 |
Quadrant C |
| Plot type | Count rate plots | Images |
|---|---|---|
| Comparison with Poisson distribution Blue bars denote a histogram of data divided into 1 sec bins. Red curve is a Poisson curve with rate = median count rate of data. |
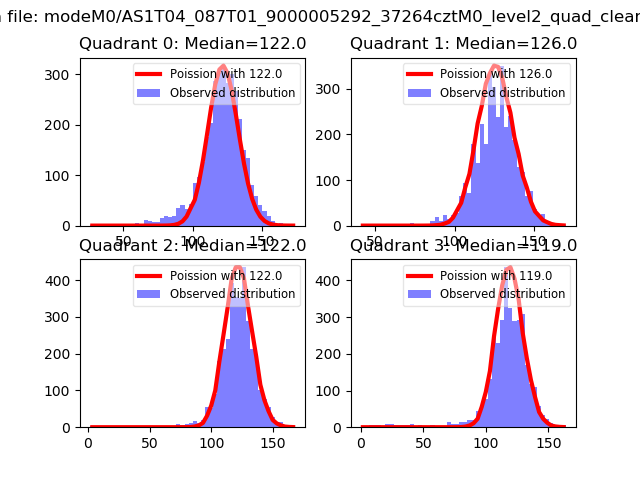 |
 |
| Quadrant-wise count rates Data is divided into 100 sec bins |
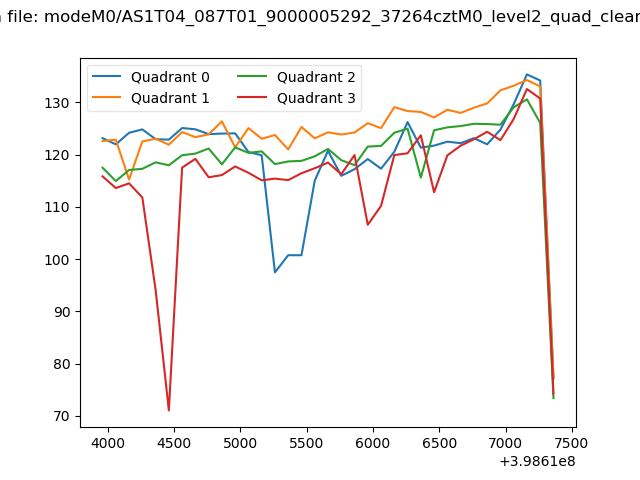 |
|
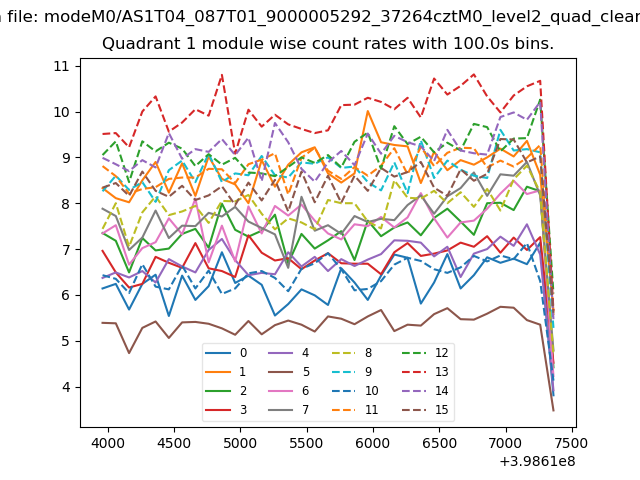
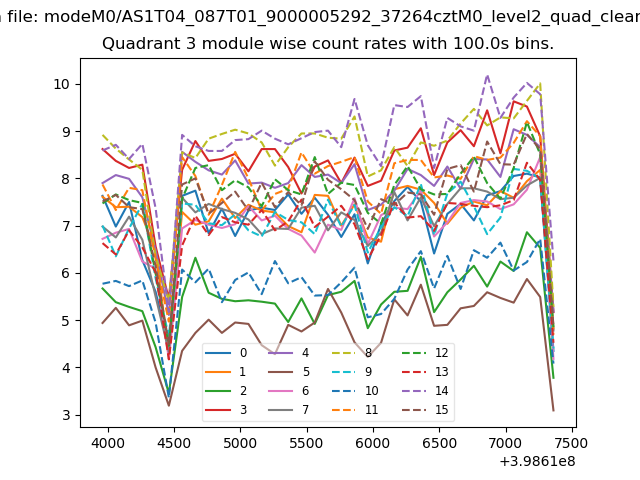
| Module-wise count rates for Quadrant A Data is divided into 100 sec bins |
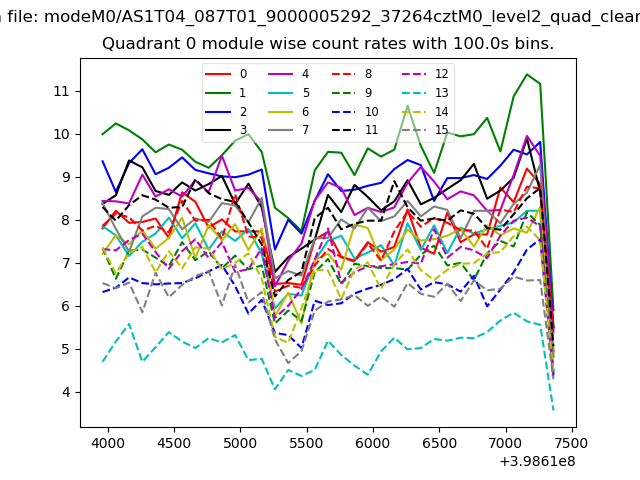 |
 |
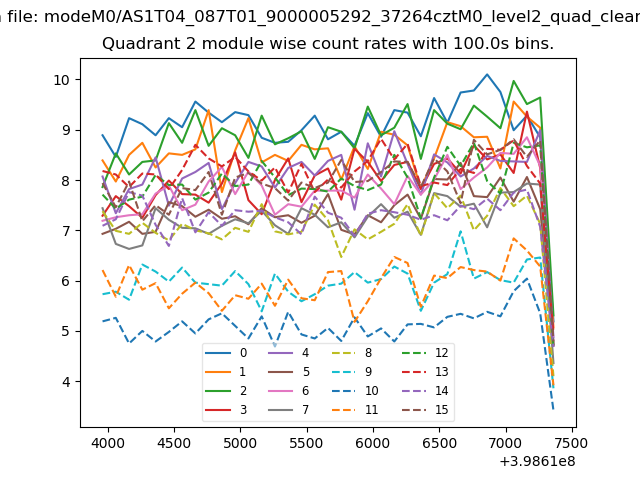
| Module-wise count rates for Quadrant B Data is divided into 100 sec bins |
 |
 |
| Module-wise count rates for Quadrant C Data is divided into 100 sec bins |
 |
 |
| Module-wise count rates for Quadrant D Data is divided into 100 sec bins |
 |
 |
| Parameter | Plot |
|---|---|
| CZT HV Monitor | 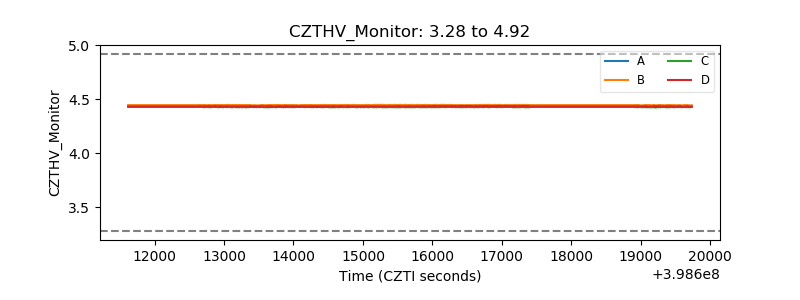 |
| D_VDD | 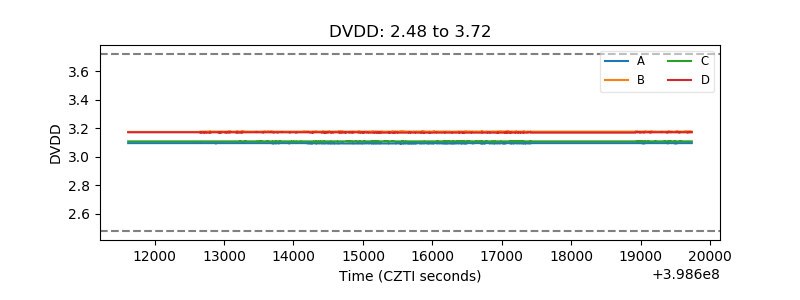 |
| Temperature 1 | 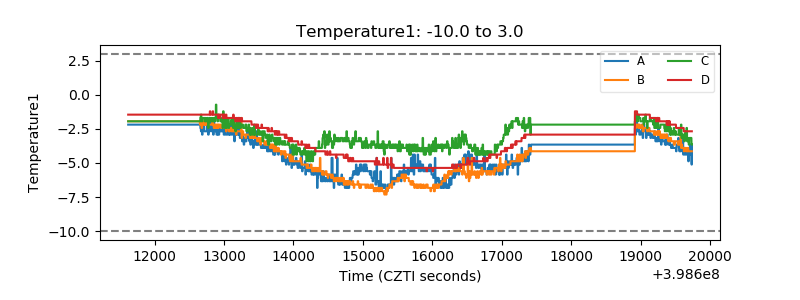 |
| Veto HV Monitor | 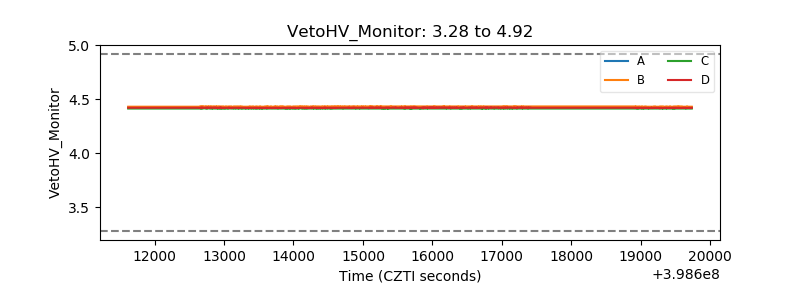 |
| Veto LLD | 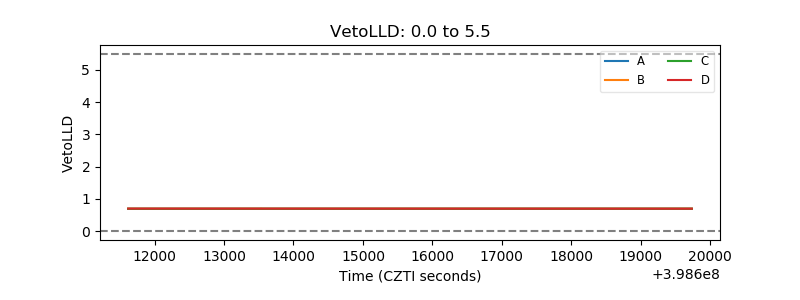 |
| Alpha Counter | 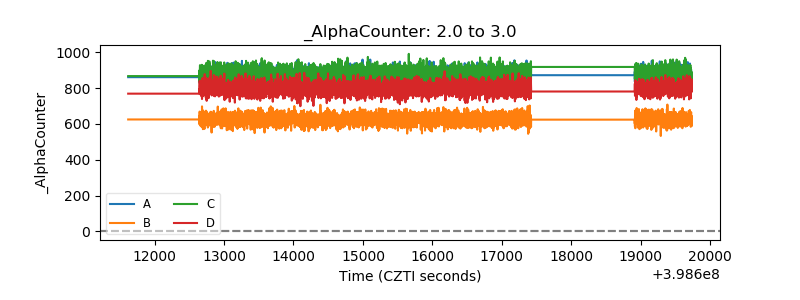 |
| _CPM_Rate | 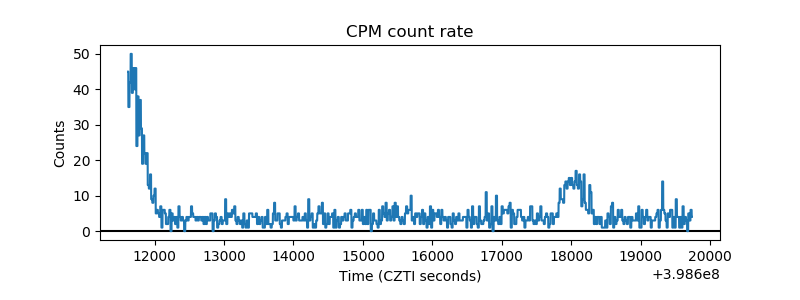 |
| CZT Counter | 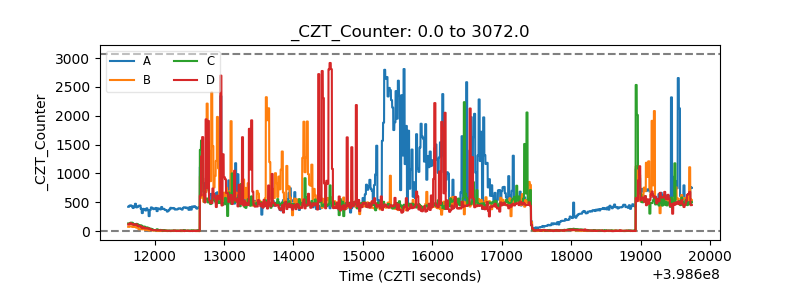 |
| +2.5 Volts monitor | 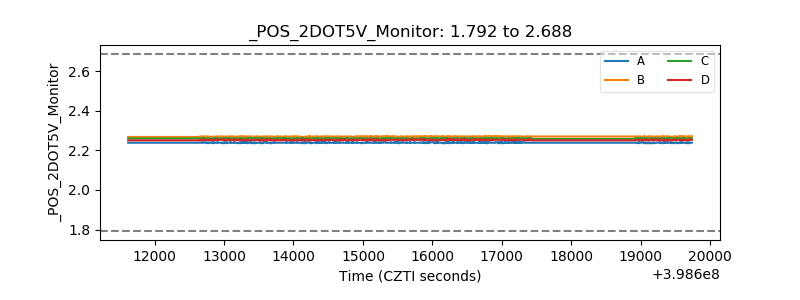 |
| +5 Volts monitor | 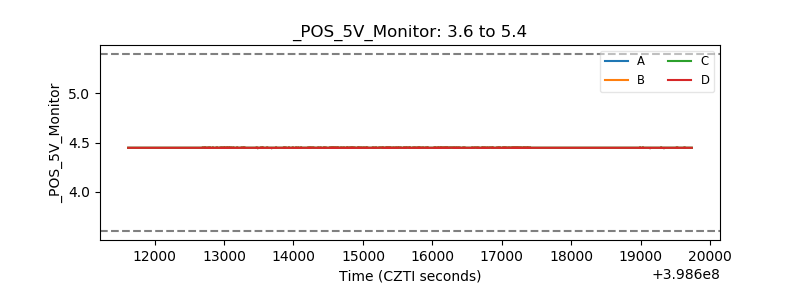 |
| _ROLL_ROT |  |
| _Roll_DEC | 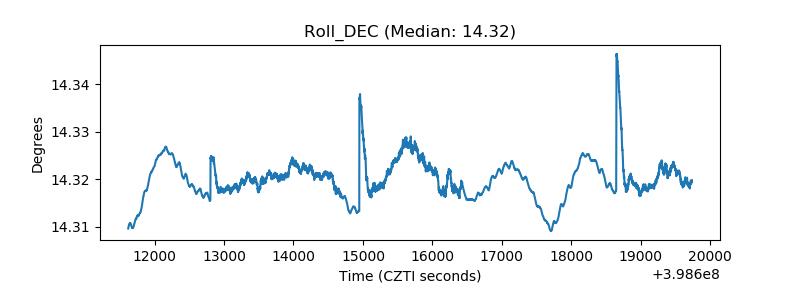 |
| _Roll_RA | 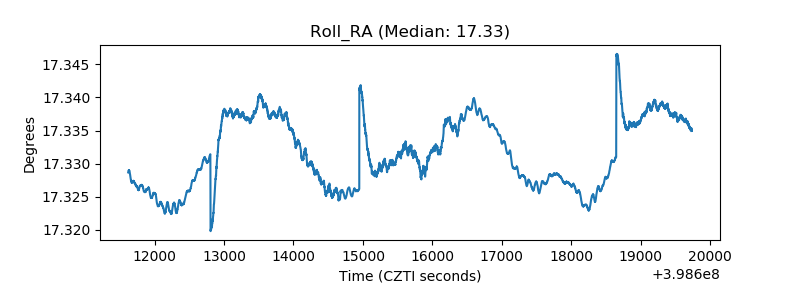 |
| Veto Counter | 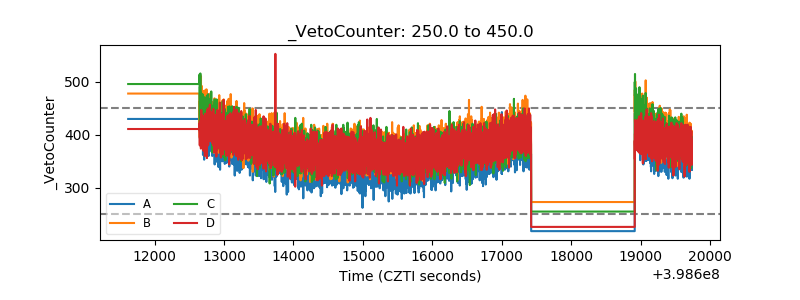 |