| Param | Original file | Final file |
|---|---|---|
| Filename | modeM0/AS1T04_087T01_9000005292_37265cztM0_level2.evt | modeM0/AS1T04_087T01_9000005292_37265cztM0_level2_quad_clean.evt |
| Size (bytes) | 439,657,920 | 77,892,480 |
| Size | 419.3 MB | 74.3 MB |
| Events in quadrant A | 3,246,495 | 496,239 |
| Events in quadrant B | 3,399,977 | 494,740 |
| Events in quadrant C | 3,265,958 | 481,674 |
| Events in quadrant D | 2,998,208 | 470,059 |
| Mode M9 | |||
|---|---|---|---|
| Quadrant | BADHDUFLAG | Total packets | Discarded packets |
| A | 0 | 19 | 0 |
| B | 0 | 19 | 0 |
| C | 0 | 19 | 0 |
| D | 0 | 20 | 0 |
| Mode SS | |||
|---|---|---|---|
| Quadrant | BADHDUFLAG | Total packets | Discarded packets |
| A | 0 | 122 | 0 |
| B | 0 | 122 | 0 |
| C | 0 | 122 | 0 |
| D | 0 | 122 | 0 |
| Mode M0 | |||
|---|---|---|---|
| Quadrant | BADHDUFLAG | Total packets | Discarded packets |
| A | 0 | 13552 | 3 |
| B | 0 | 14015 | 2 |
| C | 0 | 13333 | 2 |
| D | 0 | 13068 | 2 |
| Quadrant | Total seconds | Saturated seconds | Saturation percentage |
|---|---|---|---|
| A | 5950 | 65 | 1.092437% |
| B | 5950 | 88 | 1.478992% |
| C | 5950 | 106 | 1.781513% |
| D | 5950 | 35 | 0.588235% |
Noise dominated data is calculated using 1-second bins in cleaned event files. If a bin has >2000 counts, and if more than 50% of those come from <1% of pixels, then it is considered to be noise-dominated and hence unusable.
| Quadrant | # 1 sec bins | Bins with >0 counts | Bins with >2000 counts | High rate bins dominated by noise | Noise dominated (total time) | Noise dominated (detector-on time) | Marked lightcurve |
|---|---|---|---|---|---|---|---|
| A | 7262 | 5951 | 33 | 33 | 0.45% | 0.55% | 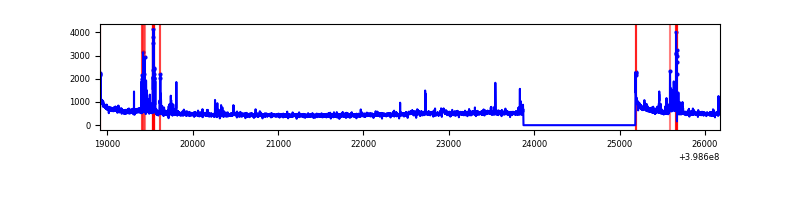 |
| B | 7262 | 5951 | 36 | 36 | 0.50% | 0.60% | 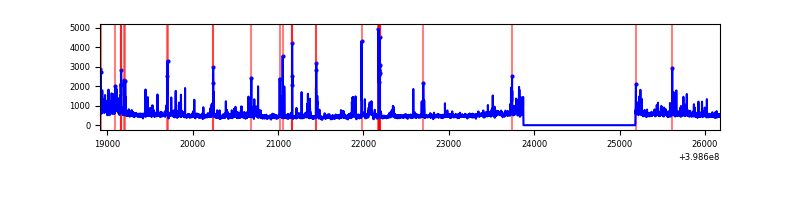 |
| C | 7262 | 5951 | 80 | 80 | 1.10% | 1.34% | 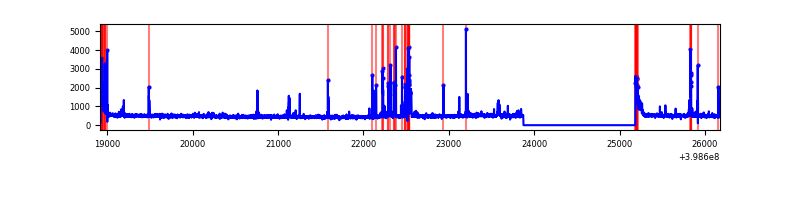 |
| D | 7262 | 5951 | 26 | 26 | 0.36% | 0.44% | 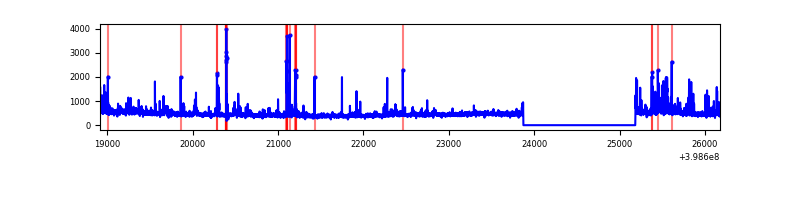 |
Top three noisy pixels from each quadrant. If the there are fewer than three noisy pixels in the level2.evt file, extra rows are filled as -1
| Pixel properties | Quadrant properties | ||||||
|---|---|---|---|---|---|---|---|
| Quadrant | DetID | PixID | Counts | Sigma | Mean | Median | Sigma |
| A | 10 | 83 | 290502 | 2096.49 | 678 | 664 | 138.2 |
| A | 15 | 237 | 229349 | 1654.15 | 678 | 664 | 138.2 |
| A | 15 | 223 | 30718 | 217.39 | 678 | 664 | 138.2 |
| B | 0 | 190 | 212789 | 1637.96 | 670 | 655 | 129.5 |
| B | 0 | 213 | 153968 | 1183.78 | 670 | 655 | 129.5 |
| B | 5 | 172 | 134107 | 1030.43 | 670 | 655 | 129.5 |
| C | 14 | 254 | 311136 | 2009.51 | 653 | 657 | 154.5 |
| C | 15 | 214 | 248778 | 1605.91 | 653 | 657 | 154.5 |
| C | 0 | 10 | 140083 | 902.4 | 653 | 657 | 154.5 |
| D | 12 | 218 | 94346 | 578.18 | 658 | 639 | 162.1 |
| D | 2 | 153 | 84409 | 516.87 | 658 | 639 | 162.1 |
| D | 13 | 249 | 74853 | 457.91 | 658 | 639 | 162.1 |
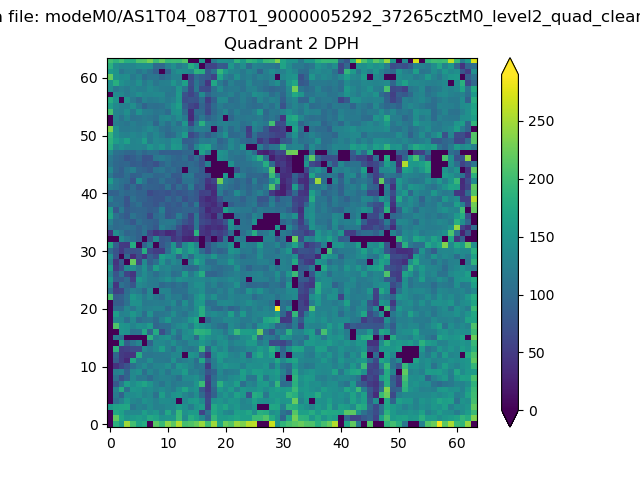
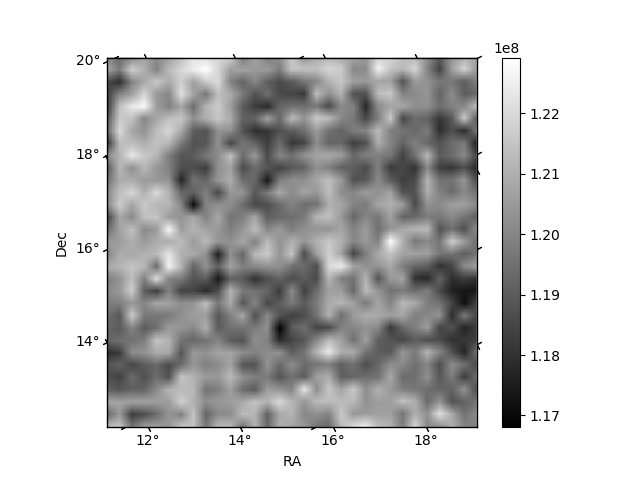
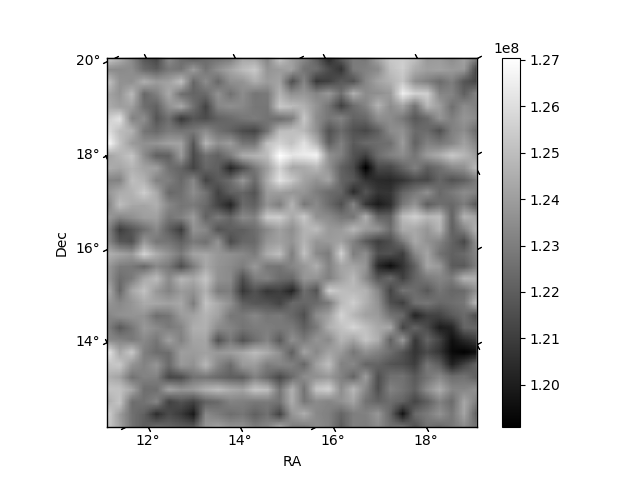
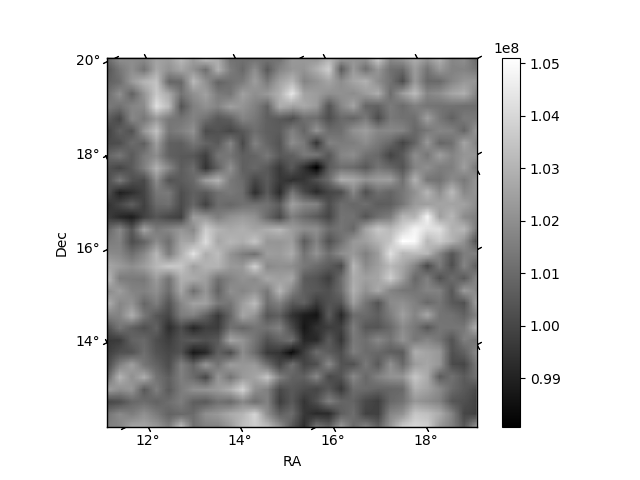
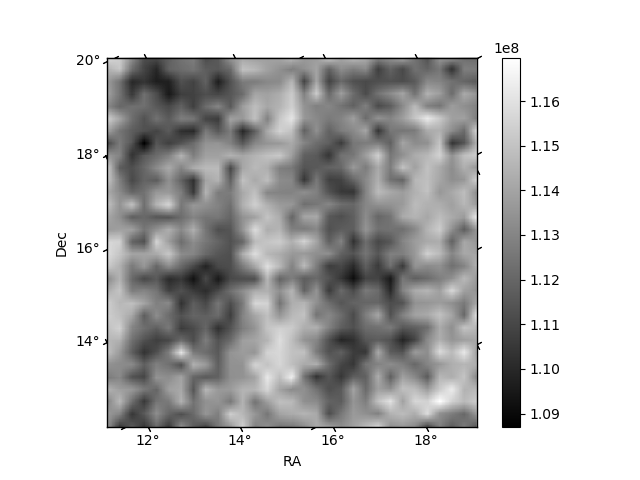
Histogram calculated using DETX and DETY for each event in the final _common_clean file
| Quadrant A | 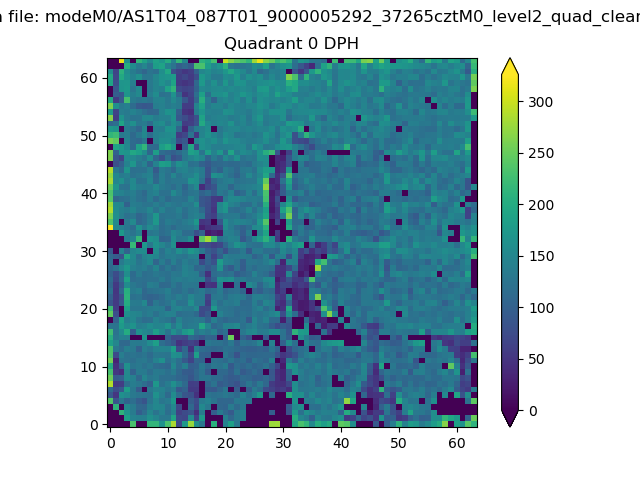 |
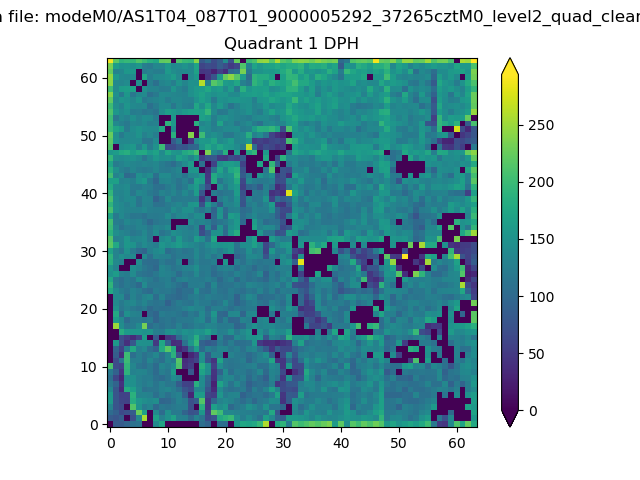 |
Quadrant B |
|---|---|---|---|
| Quadrant D | 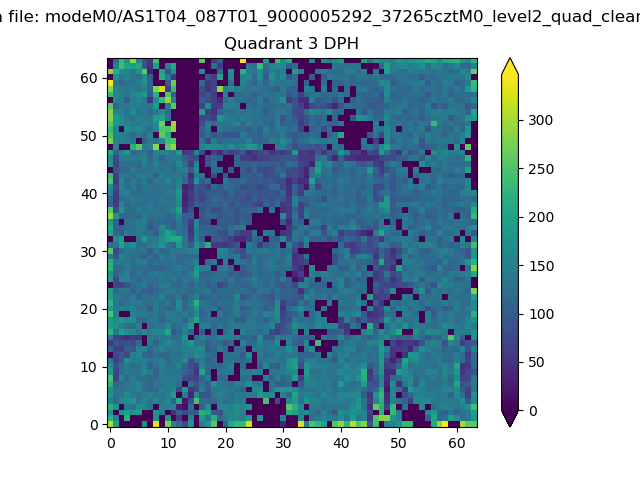 |
 |
Quadrant C |
| Plot type | Count rate plots | Images |
|---|---|---|
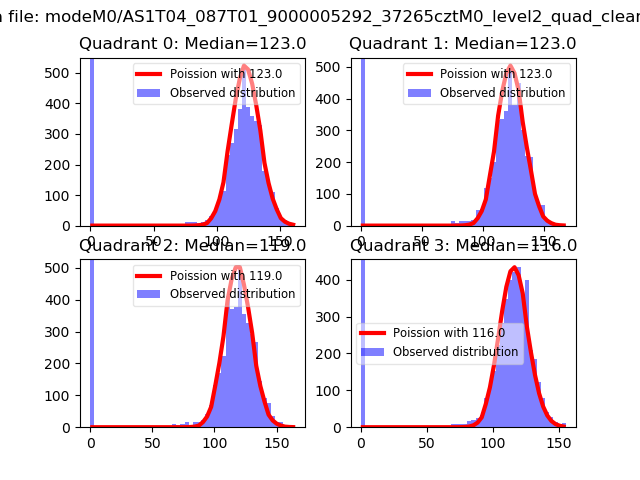
| Comparison with Poisson distribution Blue bars denote a histogram of data divided into 1 sec bins. Red curve is a Poisson curve with rate = median count rate of data. |
 |
 |
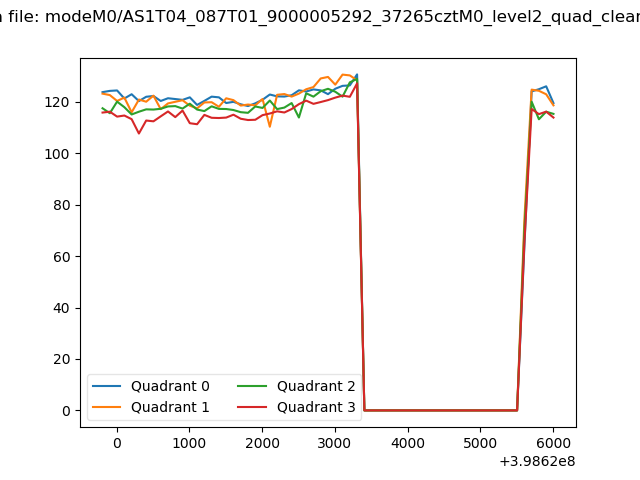
| Quadrant-wise count rates Data is divided into 100 sec bins |
 |
|
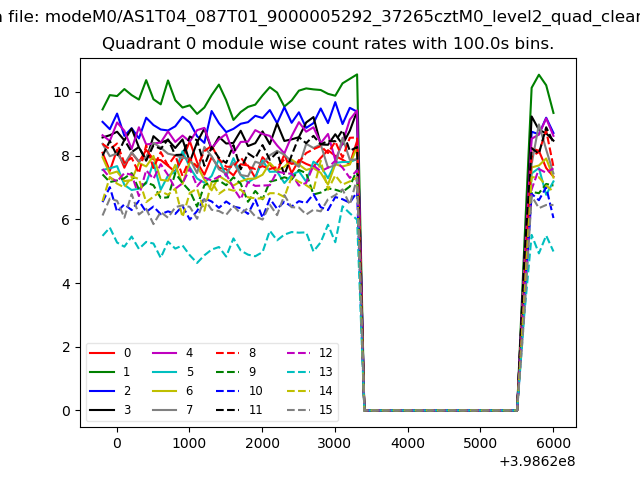
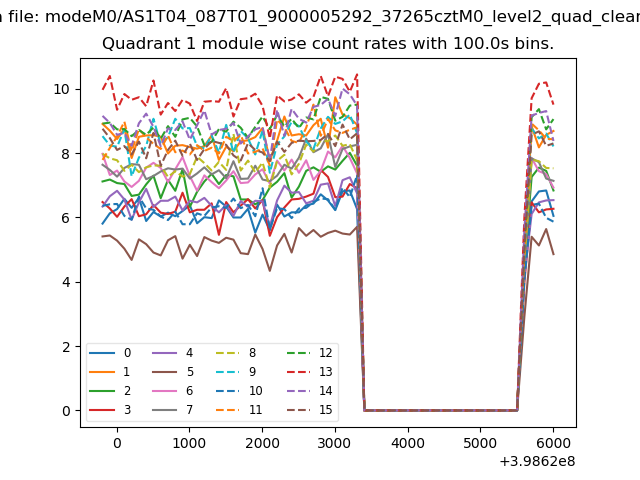
| Module-wise count rates for Quadrant A Data is divided into 100 sec bins |
 |
 |
| Module-wise count rates for Quadrant B Data is divided into 100 sec bins |
 |
 |
| Module-wise count rates for Quadrant C Data is divided into 100 sec bins |
 |
 |
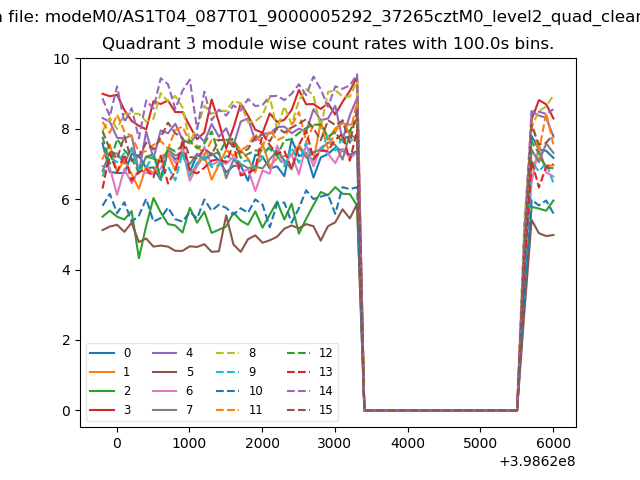
| Module-wise count rates for Quadrant D Data is divided into 100 sec bins |
 |
 |
| Parameter | Plot |
|---|---|
| CZT HV Monitor | 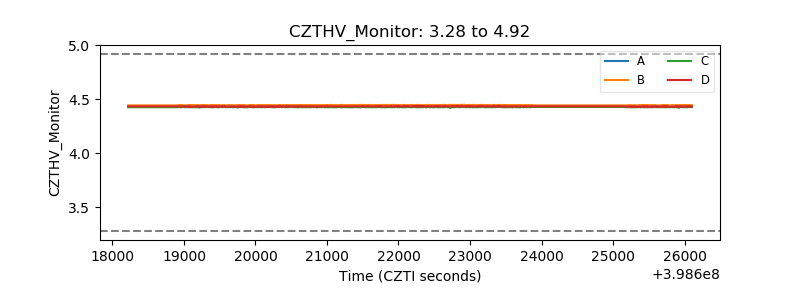 |
| D_VDD | 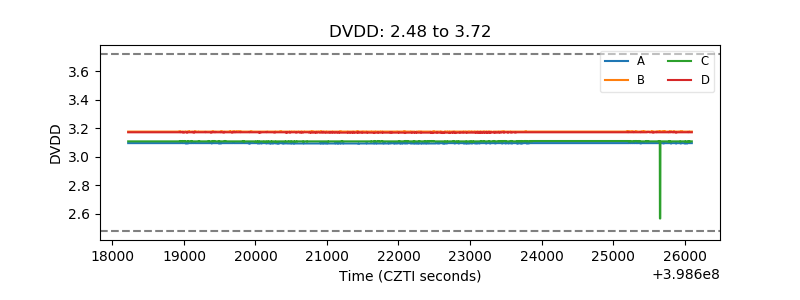 |
| Temperature 1 | 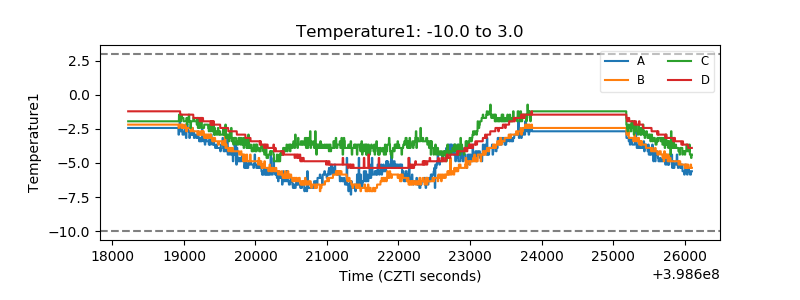 |
| Veto HV Monitor | 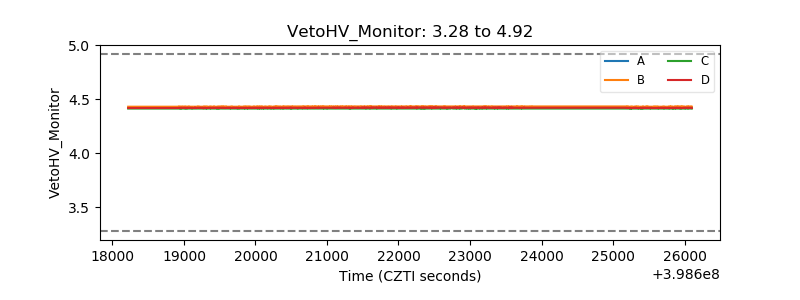 |
| Veto LLD | 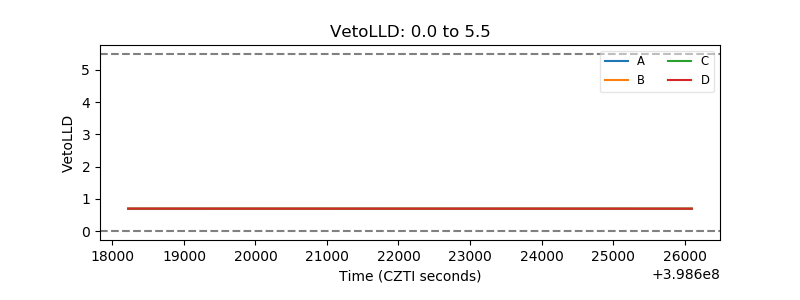 |
| Alpha Counter | 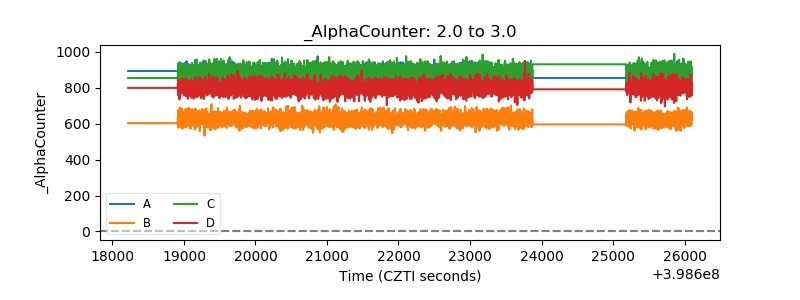 |
| _CPM_Rate | 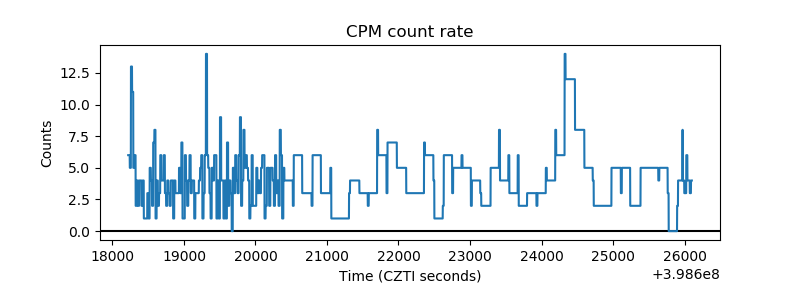 |
| CZT Counter | 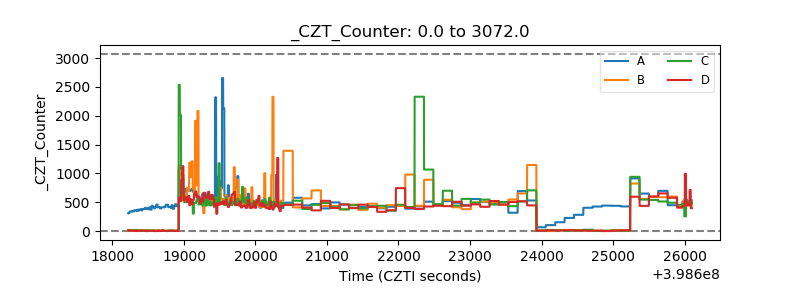 |
| +2.5 Volts monitor | 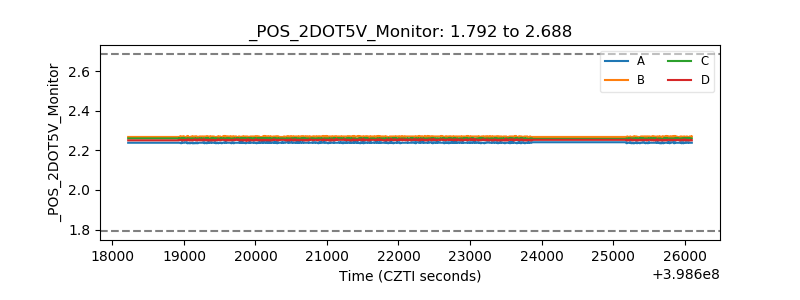 |
| +5 Volts monitor | 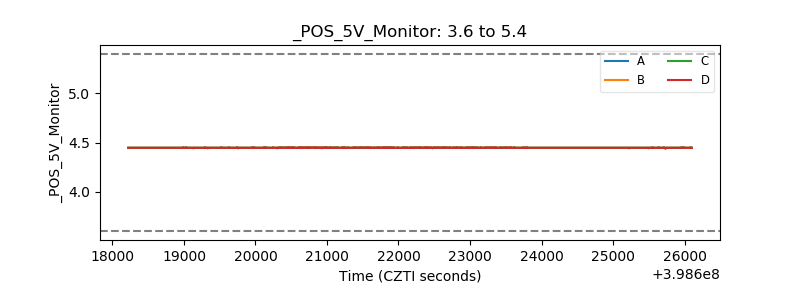 |
| _ROLL_ROT | 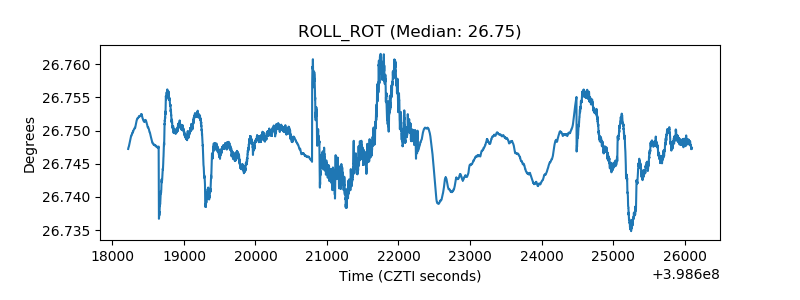 |
| _Roll_DEC | 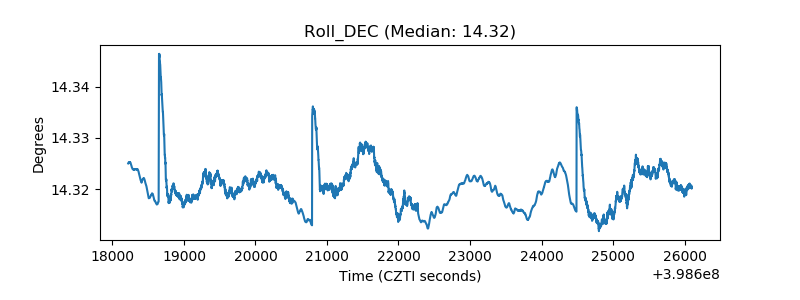 |
| _Roll_RA | 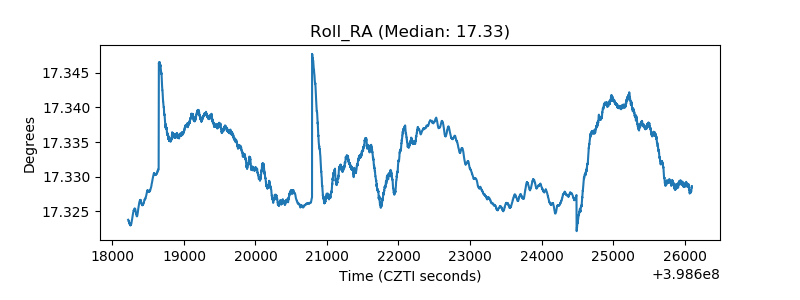 |
| Veto Counter | 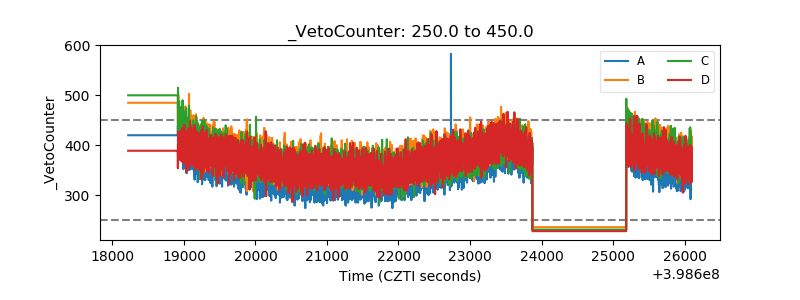 |