| Param | Original file | Final file |
|---|---|---|
| Filename | modeM0/AS1T04_087T01_9000005292_37266cztM0_level2.evt | modeM0/AS1T04_087T01_9000005292_37266cztM0_level2_quad_clean.evt |
| Size (bytes) | 389,243,520 | 69,822,720 |
| Size | 371.2 MB | 66.6 MB |
| Events in quadrant A | 2,843,964 | 443,712 |
| Events in quadrant B | 2,794,320 | 446,511 |
| Events in quadrant C | 2,820,404 | 433,088 |
| Events in quadrant D | 2,970,169 | 420,868 |
| Mode M9 | |||
|---|---|---|---|
| Quadrant | BADHDUFLAG | Total packets | Discarded packets |
| A | 0 | 13 | 0 |
| B | 0 | 13 | 0 |
| C | 0 | 13 | 0 |
| D | 0 | 13 | 0 |
| Mode SS | |||
|---|---|---|---|
| Quadrant | BADHDUFLAG | Total packets | Discarded packets |
| A | 0 | 108 | 0 |
| B | 0 | 108 | 0 |
| C | 0 | 108 | 0 |
| D | 0 | 108 | 0 |
| Mode M0 | |||
|---|---|---|---|
| Quadrant | BADHDUFLAG | Total packets | Discarded packets |
| A | 0 | 11868 | 2 |
| B | 0 | 11835 | 1 |
| C | 0 | 11625 | 1 |
| D | 0 | 12552 | 1 |
| Quadrant | Total seconds | Saturated seconds | Saturation percentage |
|---|---|---|---|
| A | 5282 | 55 | 1.041272% |
| B | 5282 | 48 | 0.908747% |
| C | 5282 | 64 | 1.211662% |
| D | 5282 | 30 | 0.567967% |
Noise dominated data is calculated using 1-second bins in cleaned event files. If a bin has >2000 counts, and if more than 50% of those come from <1% of pixels, then it is considered to be noise-dominated and hence unusable.
| Quadrant | # 1 sec bins | Bins with >0 counts | Bins with >2000 counts | High rate bins dominated by noise | Noise dominated (total time) | Noise dominated (detector-on time) | Marked lightcurve |
|---|---|---|---|---|---|---|---|
| A | 6594 | 5283 | 31 | 31 | 0.47% | 0.59% | 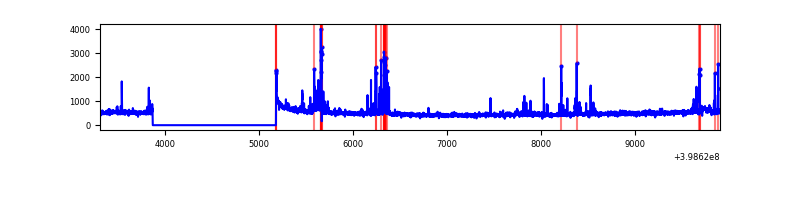 |
| B | 6594 | 5283 | 24 | 24 | 0.36% | 0.45% | 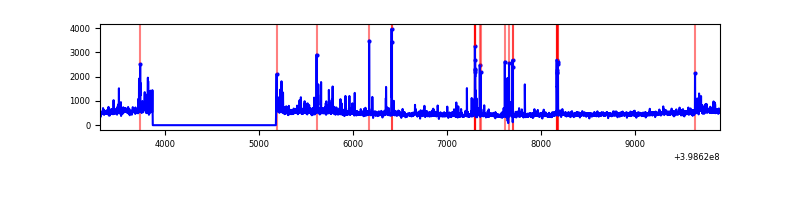 |
| C | 6594 | 5283 | 47 | 47 | 0.71% | 0.89% | 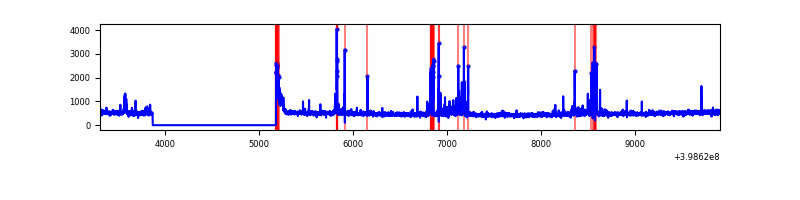 |
| D | 6594 | 5283 | 32 | 32 | 0.49% | 0.61% | 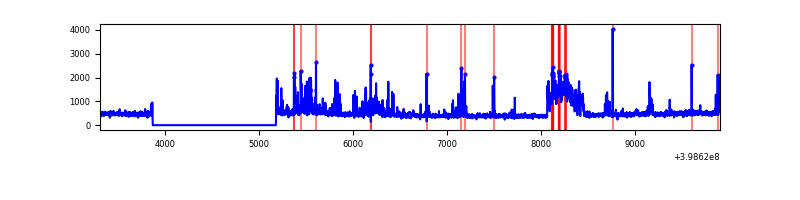 |
Top three noisy pixels from each quadrant. If the there are fewer than three noisy pixels in the level2.evt file, extra rows are filled as -1
| Pixel properties | Quadrant properties | ||||||
|---|---|---|---|---|---|---|---|
| Quadrant | DetID | PixID | Counts | Sigma | Mean | Median | Sigma |
| A | 15 | 237 | 209344 | 1703.99 | 600 | 588 | 122.5 |
| A | 10 | 83 | 204989 | 1668.44 | 600 | 588 | 122.5 |
| A | 15 | 223 | 46232 | 372.57 | 600 | 588 | 122.5 |
| B | 0 | 190 | 147534 | 1277.37 | 593 | 578 | 115.0 |
| B | 0 | 213 | 83373 | 719.67 | 593 | 578 | 115.0 |
| B | 5 | 172 | 80655 | 696.04 | 593 | 578 | 115.0 |
| C | 14 | 254 | 245724 | 1813.91 | 576 | 579 | 135.1 |
| C | 15 | 214 | 218436 | 1611.99 | 576 | 579 | 135.1 |
| C | 0 | 10 | 77027 | 565.66 | 576 | 579 | 135.1 |
| D | 12 | 17 | 396992 | 2771.75 | 582 | 566 | 143.0 |
| D | 12 | 218 | 94327 | 655.56 | 582 | 566 | 143.0 |
| D | 2 | 153 | 55584 | 384.68 | 582 | 566 | 143.0 |
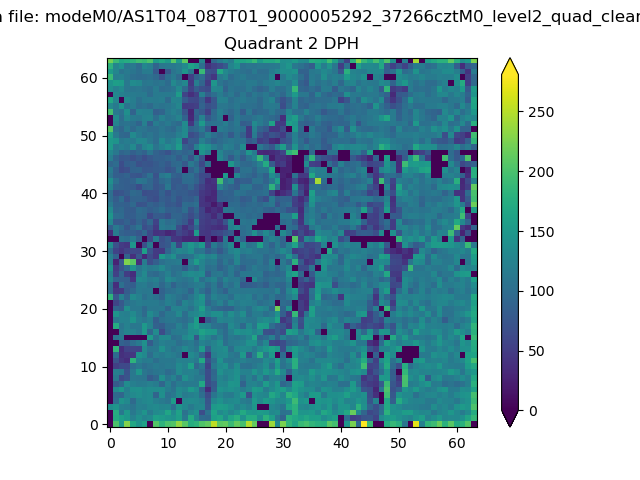
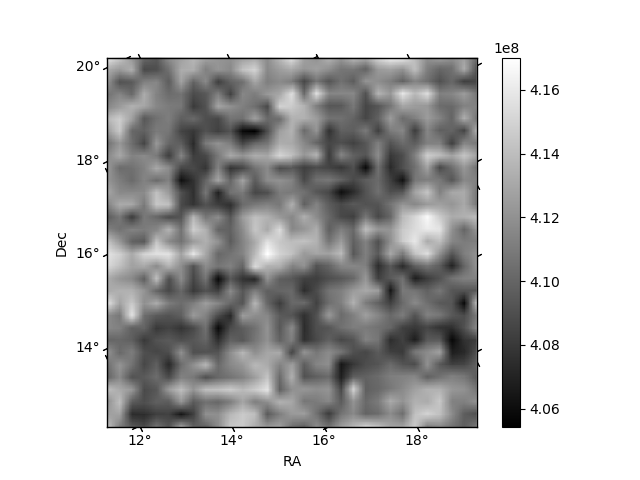
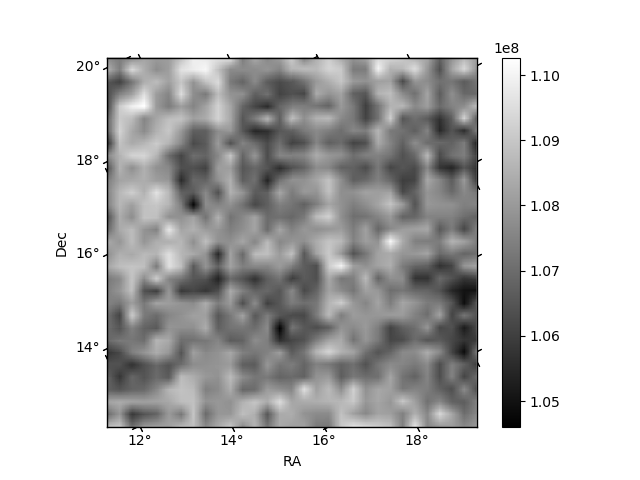
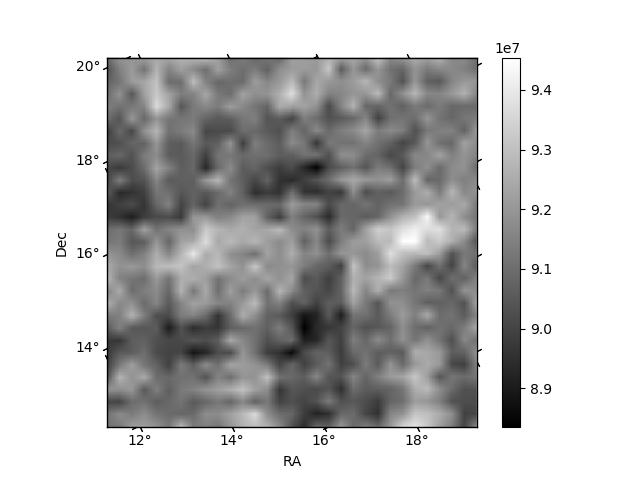
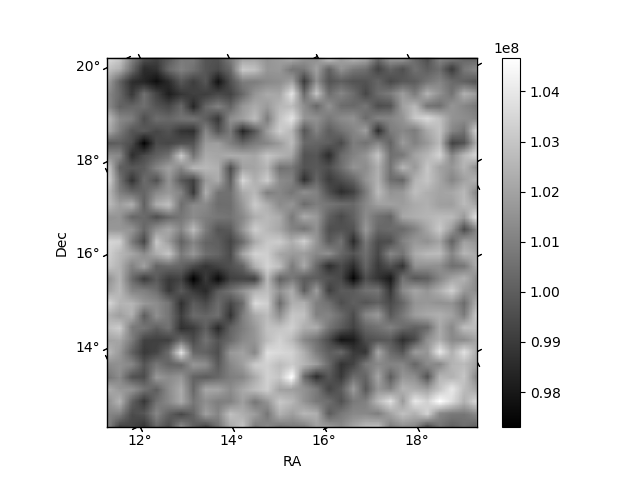
Histogram calculated using DETX and DETY for each event in the final _common_clean file
| Quadrant A | 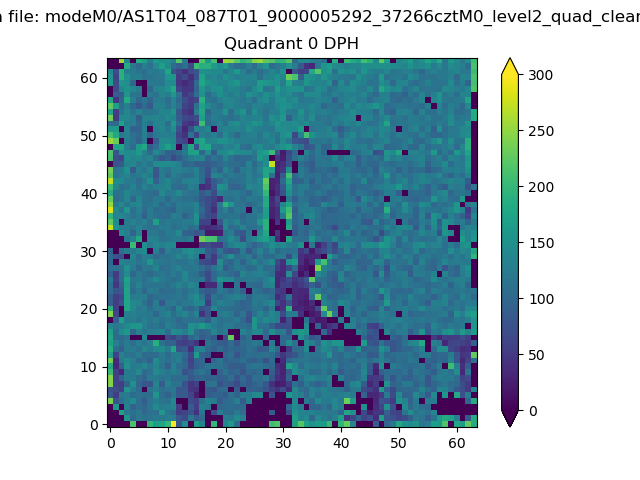 |
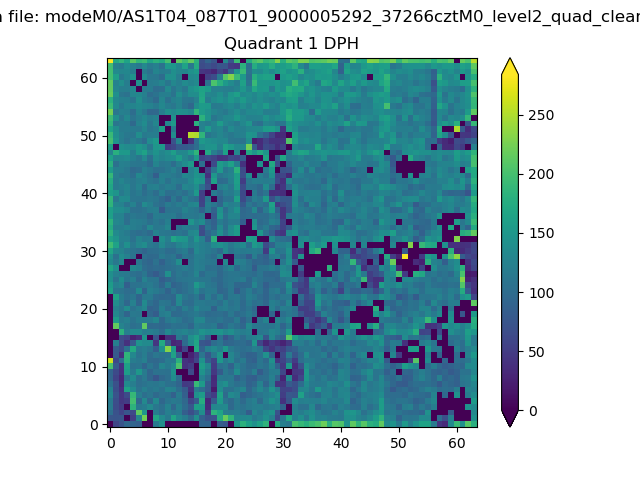 |
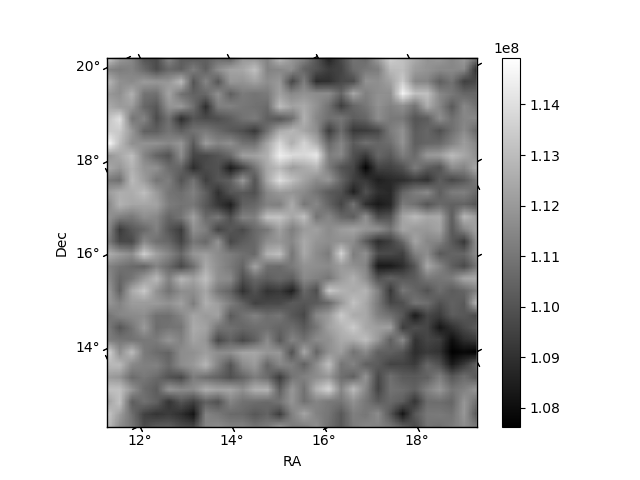
Quadrant B |
|---|---|---|---|
| Quadrant D | 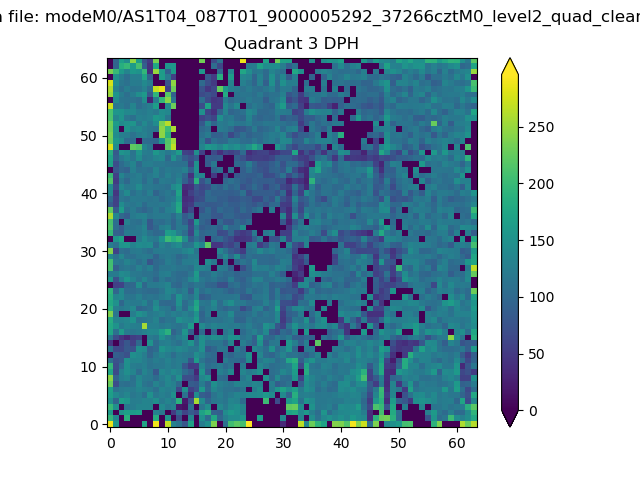 |
 |
Quadrant C |
| Plot type | Count rate plots | Images |
|---|---|---|
| Comparison with Poisson distribution Blue bars denote a histogram of data divided into 1 sec bins. Red curve is a Poisson curve with rate = median count rate of data. |
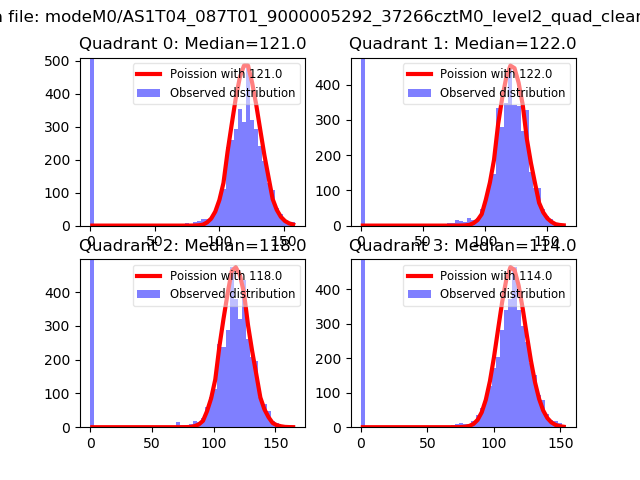 |
 |
| Quadrant-wise count rates Data is divided into 100 sec bins |
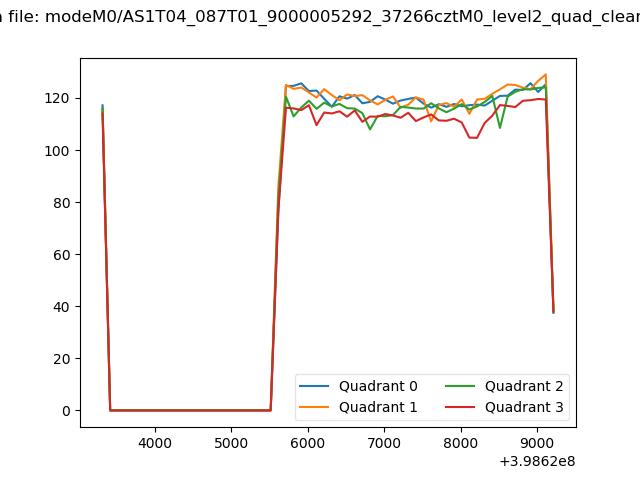 |
|
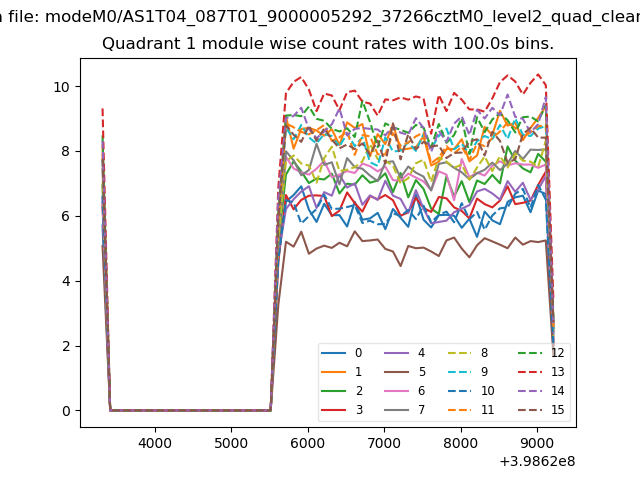
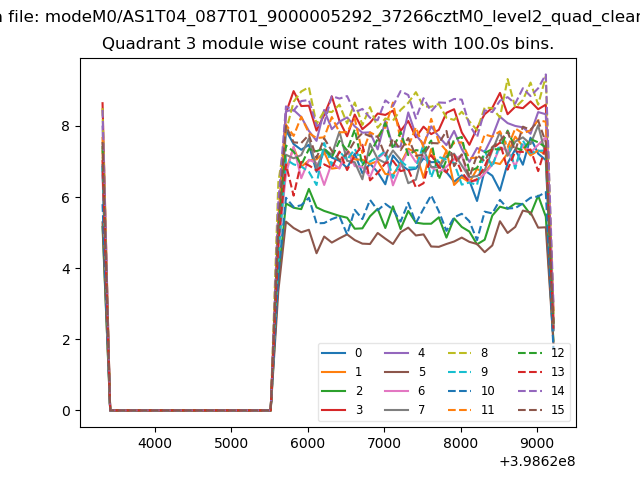
| Module-wise count rates for Quadrant A Data is divided into 100 sec bins |
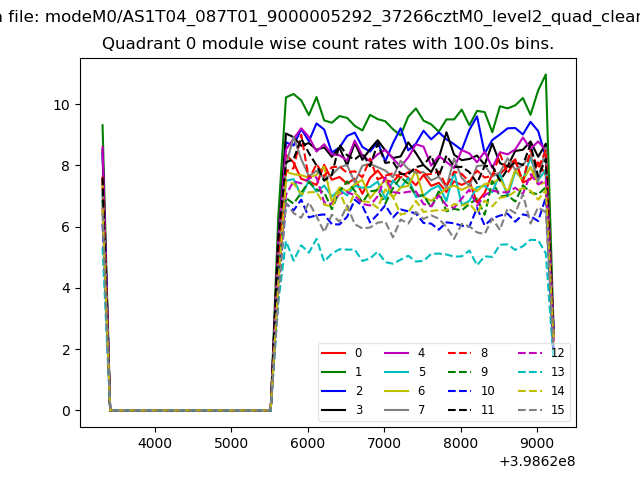 |
 |
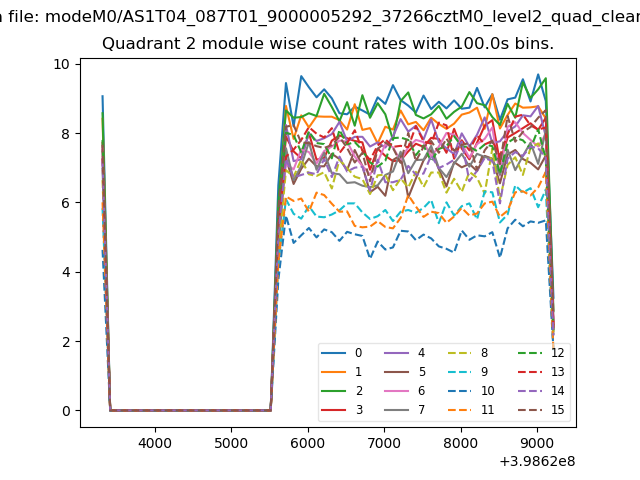
| Module-wise count rates for Quadrant B Data is divided into 100 sec bins |
 |
 |
| Module-wise count rates for Quadrant C Data is divided into 100 sec bins |
 |
 |
| Module-wise count rates for Quadrant D Data is divided into 100 sec bins |
 |
 |
| Parameter | Plot |
|---|---|
| CZT HV Monitor | 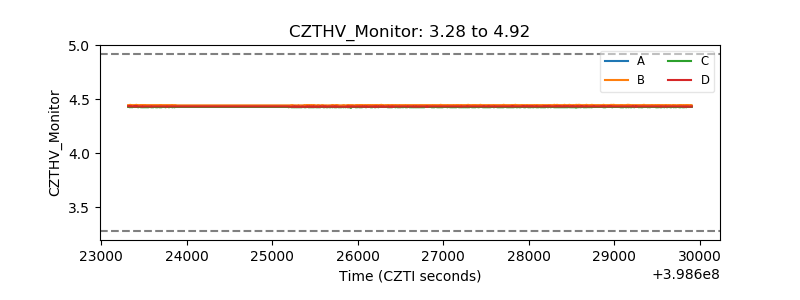 |
| D_VDD | 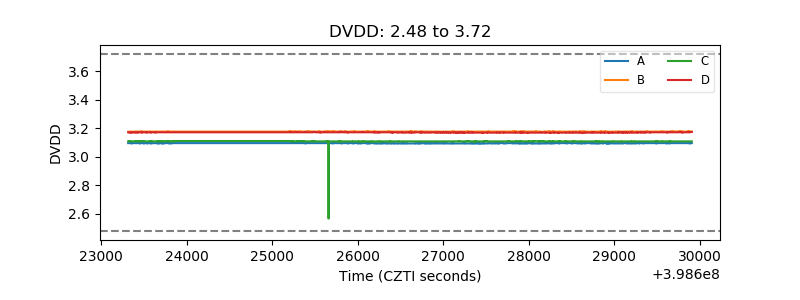 |
| Temperature 1 | 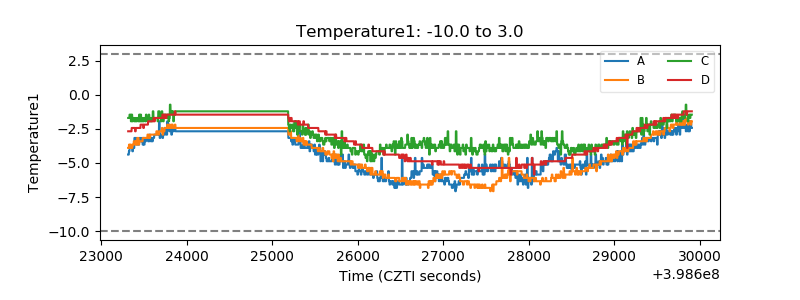 |
| Veto HV Monitor | 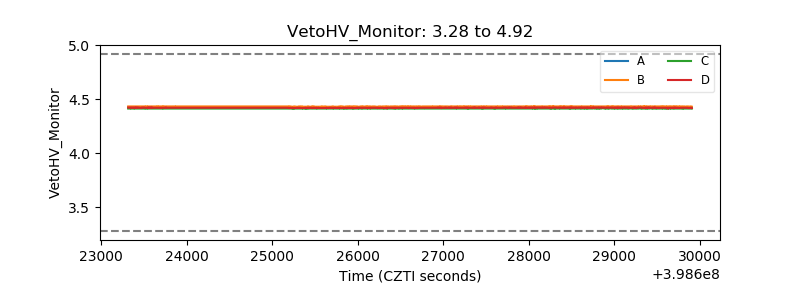 |
| Veto LLD | 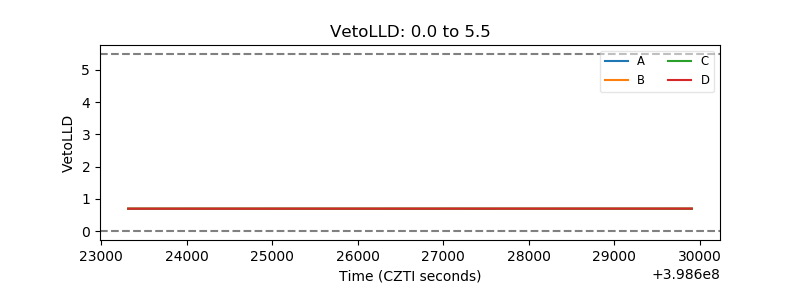 |
| Alpha Counter |  |
| _CPM_Rate | 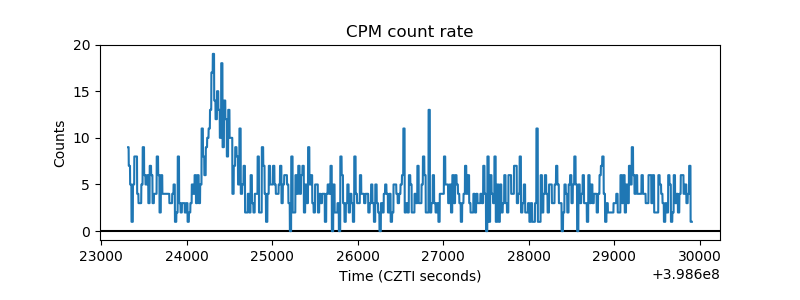 |
| CZT Counter | 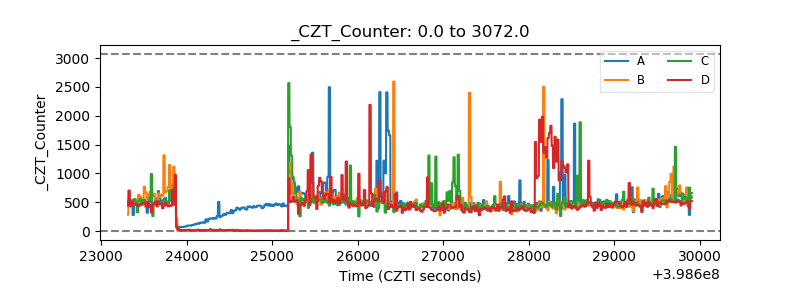 |
| +2.5 Volts monitor | 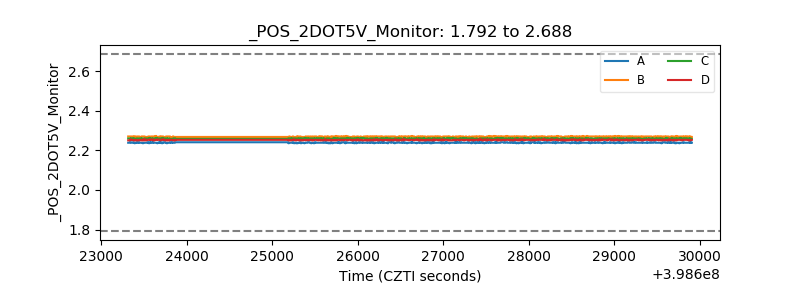 |
| +5 Volts monitor | 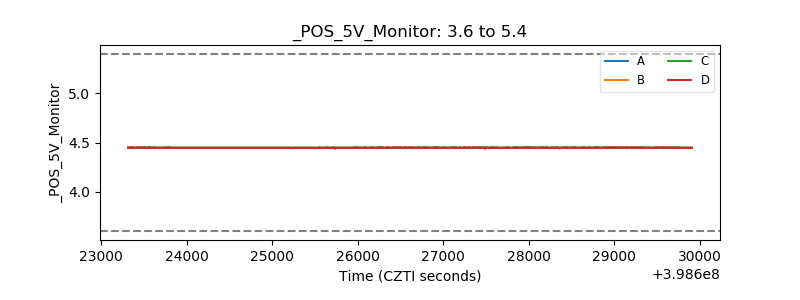 |
| _ROLL_ROT | 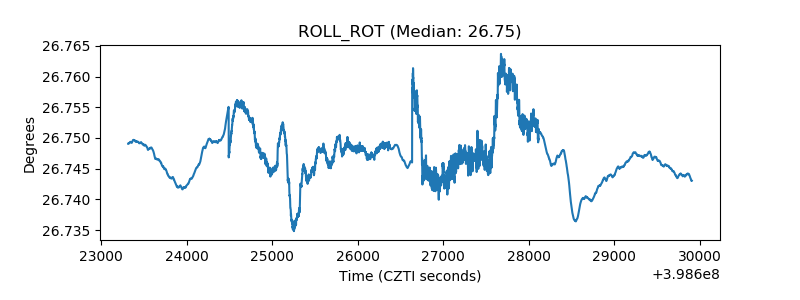 |
| _Roll_DEC | 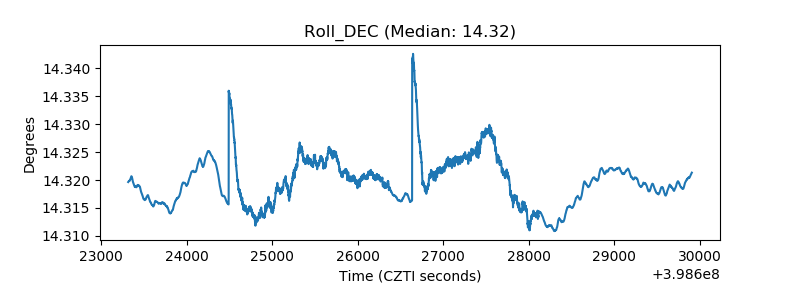 |
| _Roll_RA | 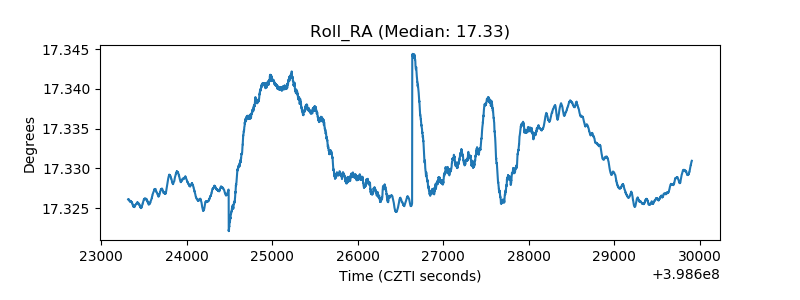 |
| Veto Counter | 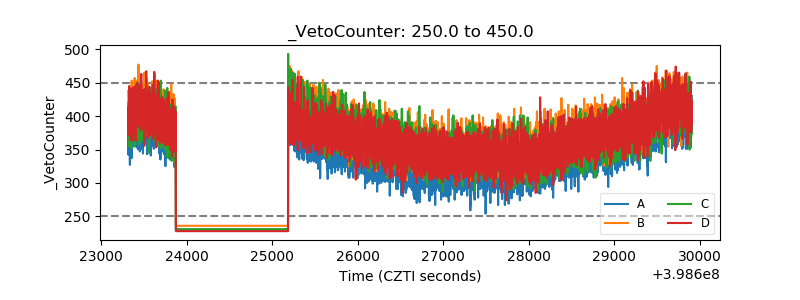 |