| Param | Original file | Final file |
|---|---|---|
| Filename | modeM0/AS1A10_094T11_9000005294cztM0_level2.fits | modeM0/AS1A10_094T11_9000005294cztM0_level2_quad_clean.evt |
| Size (bytes) | 61,770,240 | 85,844,160 |
| Size | 58.9 MB | 81.9 MB |
| Events in quadrant A | 357,120 | 551,331 |
| Events in quadrant B | 355,774 | 550,389 |
| Events in quadrant C | 365,724 | 524,860 |
| Events in quadrant D | 312,392 | 492,910 |
| Mode M9 | |||
|---|---|---|---|
| Quadrant | BADHDUFLAG | Total packets | Discarded packets |
| A | 0 | 14 | 0 |
| B | 0 | 14 | 0 |
| C | 0 | 14 | 0 |
| D | 0 | 14 | 0 |
| Mode M0 | |||
|---|---|---|---|
| Quadrant | BADHDUFLAG | Total packets | Discarded packets |
| A | 0 | 16434 | 0 |
| B | 0 | 15367 | 0 |
| C | 0 | 15479 | 0 |
| D | 0 | 17265 | 0 |
| Mode SS | |||
|---|---|---|---|
| Quadrant | BADHDUFLAG | Total packets | Discarded packets |
| A | 0 | 138 | 0 |
| B | 0 | 138 | 0 |
| C | 0 | 138 | 0 |
| D | 0 | 138 | 0 |
| Quadrant | Total seconds | Saturated seconds | Saturation percentage |
|---|---|---|---|
| A | 6893 | 124 | 1.798926% |
| B | 6893 | 39 | 0.565791% |
| C | 6893 | 54 | 0.783403% |
| D | 6893 | 146 | 2.118091% |
Noise dominated data is calculated using 1-second bins in cleaned event files. If a bin has >2000 counts, and if more than 50% of those come from <1% of pixels, then it is considered to be noise-dominated and hence unusable.
| Quadrant | # 1 sec bins | Bins with >0 counts | Bins with >2000 counts | High rate bins dominated by noise | Noise dominated (total time) | Noise dominated (detector-on time) | Marked lightcurve |
|---|---|---|---|---|---|---|---|
| A | 8236 | 6889 | 0 | 0 | 0.00% | 0.00% |  |
| B | 8236 | 6893 | 0 | 0 | 0.00% | 0.00% |  |
| C | 8236 | 6893 | 0 | 0 | 0.00% | 0.00% |  |
| D | 8236 | 6893 | 0 | 0 | 0.00% | 0.00% |  |
Top three noisy pixels from each quadrant. If the there are fewer than three noisy pixels in the level2.evt file, extra rows are filled as -1
| Pixel properties | Quadrant properties | ||||||
|---|---|---|---|---|---|---|---|
| Quadrant | DetID | PixID | Counts | Sigma | Mean | Median | Sigma |
| A | 14 | 188 | 453 | 14.8 | 92 | 87 | 24.7 |
| A | 14 | 204 | 347 | 10.51 | 92 | 87 | 24.7 |
| A | 7 | 110 | 290 | 8.21 | 92 | 87 | 24.7 |
| B | 2 | 9 | 319 | 11.03 | 94 | 89 | 20.8 |
| B | 3 | 80 | 279 | 9.11 | 94 | 89 | 20.8 |
| B | 2 | 8 | 268 | 8.59 | 94 | 89 | 20.8 |
| C | 1 | 80 | 320 | 8.77 | 96 | 91 | 26.1 |
| C | 1 | 81 | 314 | 8.54 | 96 | 91 | 26.1 |
| C | 3 | 202 | 307 | 8.27 | 96 | 91 | 26.1 |
| D | 10 | 113 | 261 | 7.12 | 89 | 81 | 25.3 |
| D | 12 | 6 | 248 | 6.6 | 89 | 81 | 25.3 |
| D | 7 | 3 | 242 | 6.37 | 89 | 81 | 25.3 |
Histogram calculated using DETX and DETY for each event in the final _common_clean file
| Quadrant A |  |
 |
Quadrant B |
|---|---|---|---|
| Quadrant D |  |
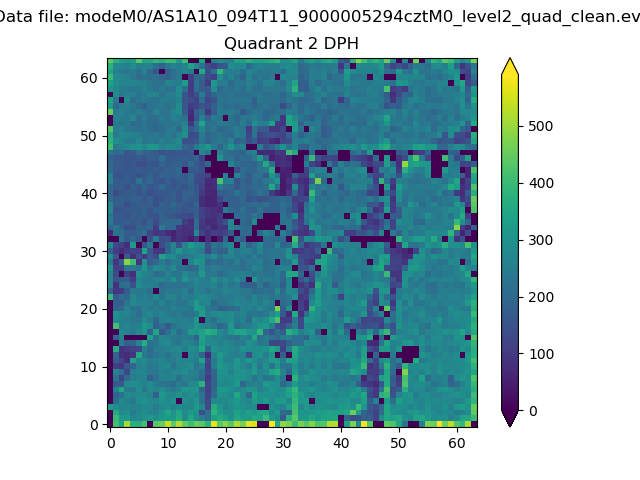 |
Quadrant C |
| Plot type | Count rate plots | Images |
|---|---|---|
| Comparison with Poisson distribution Blue bars denote a histogram of data divided into 1 sec bins. Red curve is a Poisson curve with rate = median count rate of data. |
 |
 |
| Quadrant-wise count rates Data is divided into 100 sec bins |
 |
|
| Module-wise count rates for Quadrant A Data is divided into 100 sec bins |
 |
 |
| Module-wise count rates for Quadrant B Data is divided into 100 sec bins |
 |
 |
| Module-wise count rates for Quadrant C Data is divided into 100 sec bins |
 |
 |
| Module-wise count rates for Quadrant D Data is divided into 100 sec bins |
 |
 |
| Parameter | Plot |
|---|---|
| CZT HV Monitor |  |
| D_VDD |  |
| Temperature 1 |  |
| Veto HV Monitor |  |
| Veto LLD |  |
| Alpha Counter |  |
| _CPM_Rate |  |
| CZT Counter |  |
| +2.5 Volts monitor |  |
| +5 Volts monitor |  |
| _ROLL_ROT |  |
| _Roll_DEC |  |
| _Roll_RA |  |
| Veto Counter |  |