| Param | Original file | Final file |
|---|---|---|
| Filename | modeM0/AS1A10_103T03_9000005296_37268cztM0_level2.evt | modeM0/AS1A10_103T03_9000005296_37268cztM0_level2_quad_clean.evt |
| Size (bytes) | 81,705,600 | 18,316,800 |
| Size | 77.9 MB | 17.5 MB |
| Events in quadrant A | 593,149 | 118,855 |
| Events in quadrant B | 623,938 | 121,024 |
| Events in quadrant C | 568,699 | 121,407 |
| Events in quadrant D | 616,897 | 115,182 |
| Mode M0 | |||
|---|---|---|---|
| Quadrant | BADHDUFLAG | Total packets | Discarded packets |
| A | 0 | 2441 | 2 |
| B | 0 | 2559 | 1 |
| C | 0 | 2343 | 1 |
| D | 0 | 2587 | 1 |
| Mode SS | |||
|---|---|---|---|
| Quadrant | BADHDUFLAG | Total packets | Discarded packets |
| A | 0 | 20 | 0 |
| B | 0 | 20 | 0 |
| C | 0 | 20 | 0 |
| D | 0 | 20 | 0 |
| Mode M9 | |||
|---|---|---|---|
| Quadrant | BADHDUFLAG | Total packets | Discarded packets |
| A | 0 | 10 | 0 |
| B | 0 | 10 | 0 |
| C | 0 | 10 | 0 |
| D | 0 | 10 | 0 |
| Quadrant | Total seconds | Saturated seconds | Saturation percentage |
|---|---|---|---|
| A | 1010 | 40 | 3.960396% |
| B | 1010 | 12 | 1.188119% |
| C | 1010 | 28 | 2.772277% |
| D | 1010 | 41 | 4.059406% |
Noise dominated data is calculated using 1-second bins in cleaned event files. If a bin has >2000 counts, and if more than 50% of those come from <1% of pixels, then it is considered to be noise-dominated and hence unusable.
| Quadrant | # 1 sec bins | Bins with >0 counts | Bins with >2000 counts | High rate bins dominated by noise | Noise dominated (total time) | Noise dominated (detector-on time) | Marked lightcurve |
|---|---|---|---|---|---|---|---|
| A | 1010 | 1010 | 38 | 38 | 3.76% | 3.76% | 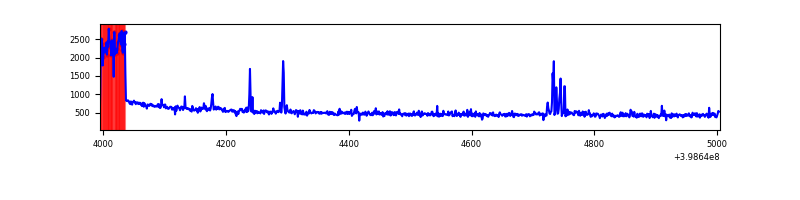 |
| B | 1010 | 1010 | 5 | 5 | 0.50% | 0.50% | 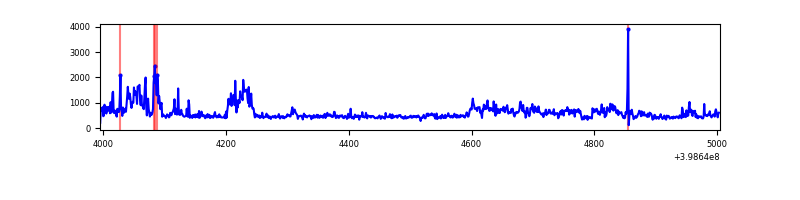 |
| C | 1010 | 1010 | 23 | 23 | 2.28% | 2.28% | 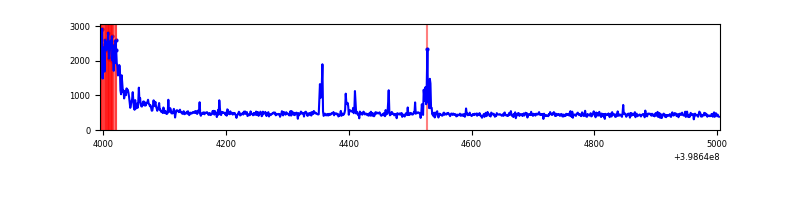 |
| D | 1010 | 1010 | 43 | 43 | 4.26% | 4.26% | 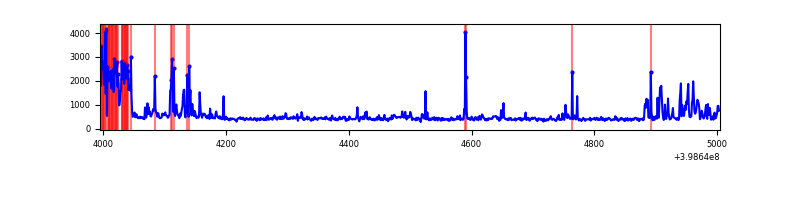 |
Top three noisy pixels from each quadrant. If the there are fewer than three noisy pixels in the level2.evt file, extra rows are filled as -1
| Pixel properties | Quadrant properties | ||||||
|---|---|---|---|---|---|---|---|
| Quadrant | DetID | PixID | Counts | Sigma | Mean | Median | Sigma |
| A | 10 | 83 | 85402 | 3618.09 | 106 | 104 | 23.6 |
| A | 15 | 237 | 60577 | 2565.08 | 106 | 104 | 23.6 |
| A | 13 | 248 | 22352 | 943.69 | 106 | 104 | 23.6 |
| B | 0 | 213 | 115323 | 5037.6 | 108 | 105 | 22.9 |
| B | 5 | 173 | 47596 | 2076.42 | 108 | 105 | 22.9 |
| B | 0 | 190 | 9230 | 398.97 | 108 | 105 | 22.9 |
| C | 0 | 10 | 85410 | 3206.79 | 105 | 106 | 26.6 |
| C | 15 | 214 | 46193 | 1732.53 | 105 | 106 | 26.6 |
| C | 14 | 254 | 24597 | 920.68 | 105 | 106 | 26.6 |
| D | 12 | 218 | 93010 | 3465.71 | 102 | 99 | 26.8 |
| D | 2 | 153 | 70705 | 2633.7 | 102 | 99 | 26.8 |
| D | 13 | 249 | 21254 | 789.11 | 102 | 99 | 26.8 |
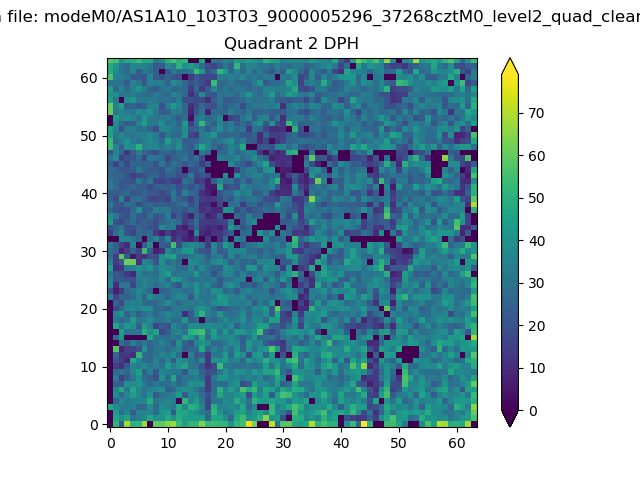
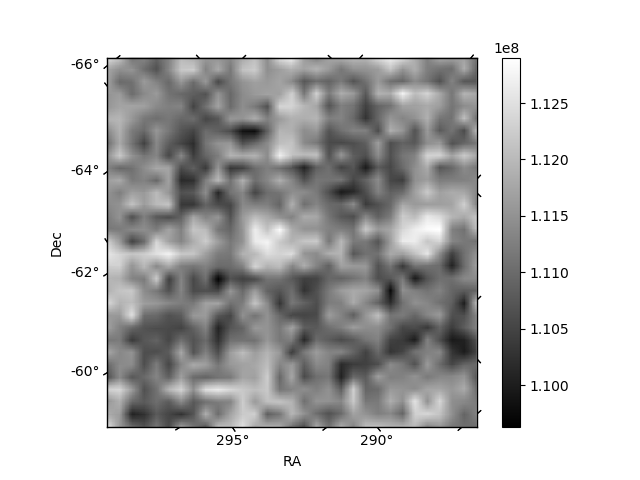
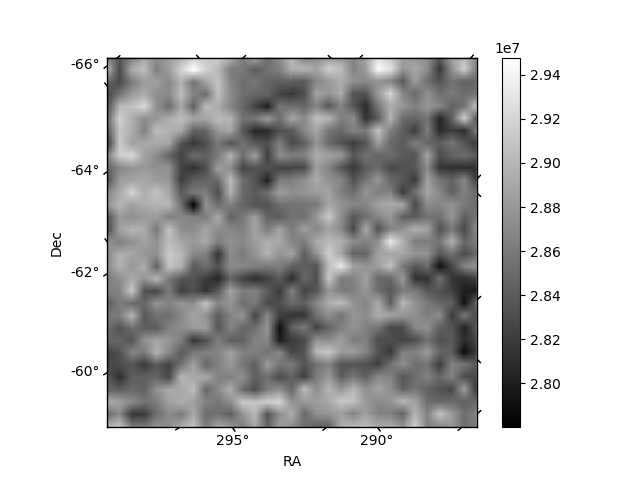
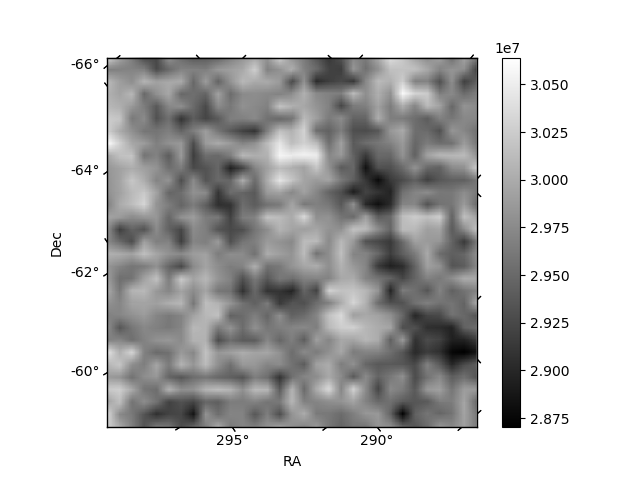
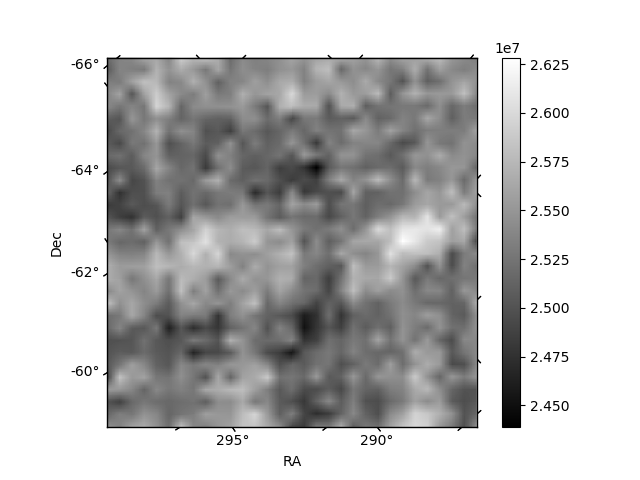
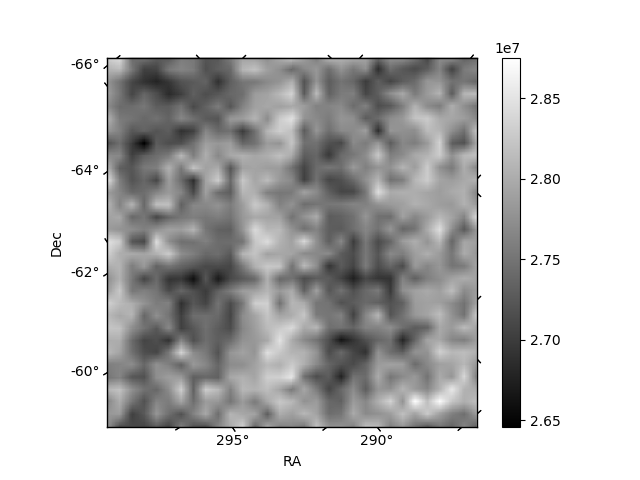
Histogram calculated using DETX and DETY for each event in the final _common_clean file
| Quadrant A | 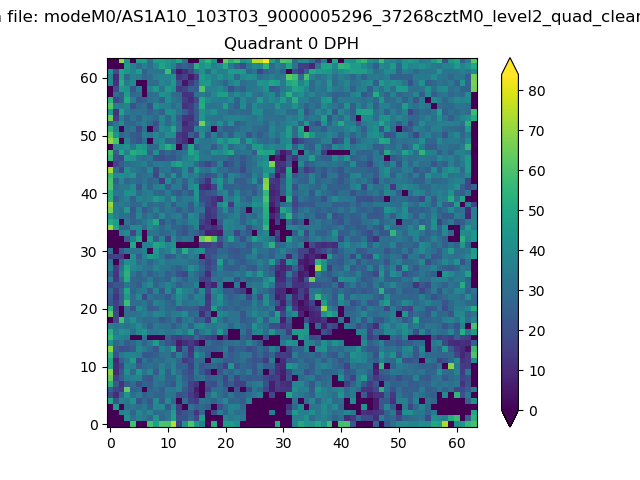 |
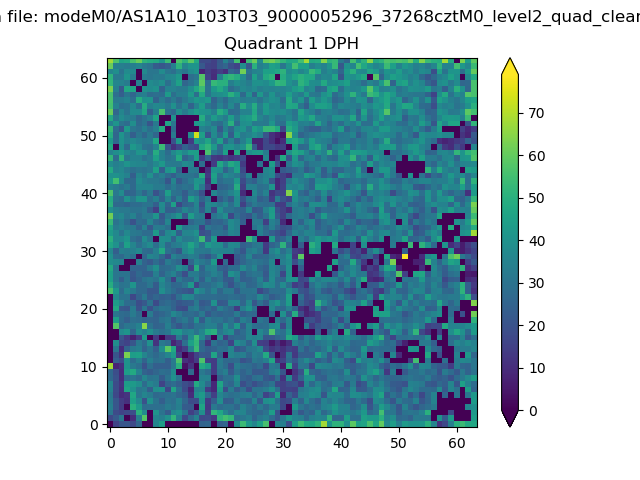 |
Quadrant B |
|---|---|---|---|
| Quadrant D | 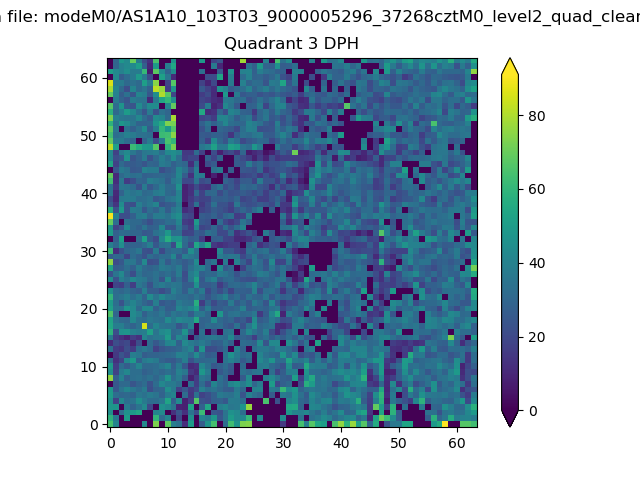 |
 |
Quadrant C |
| Plot type | Count rate plots | Images |
|---|---|---|
| Comparison with Poisson distribution Blue bars denote a histogram of data divided into 1 sec bins. Red curve is a Poisson curve with rate = median count rate of data. |
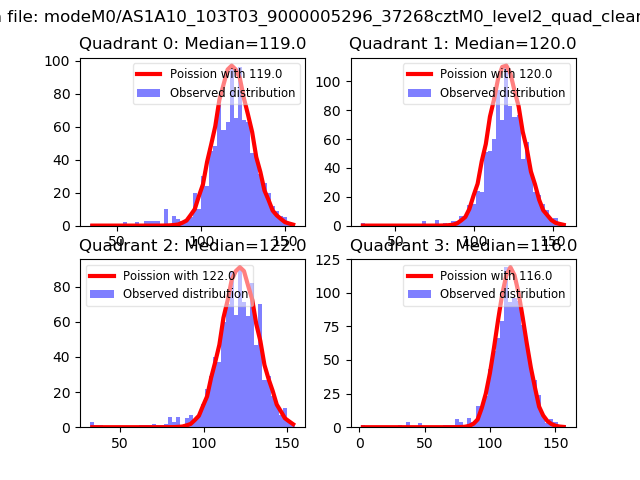 |
 |
| Quadrant-wise count rates Data is divided into 100 sec bins |
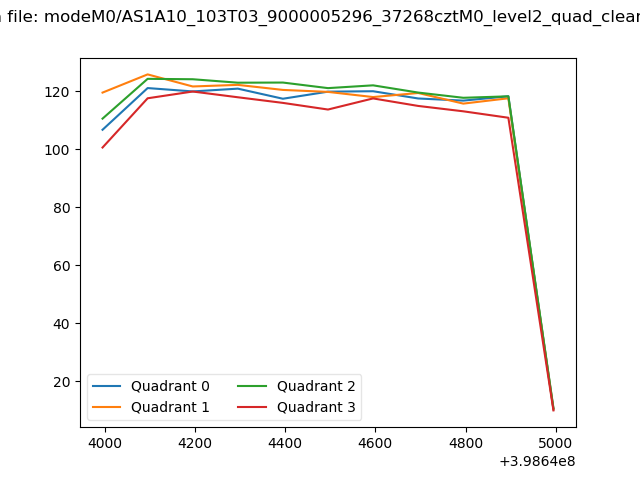 |
|
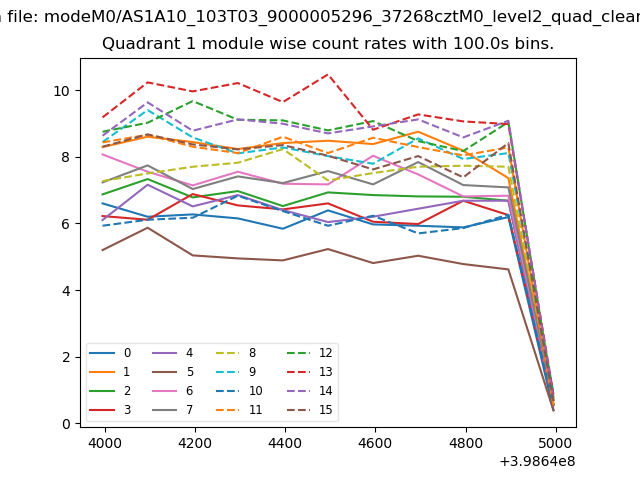
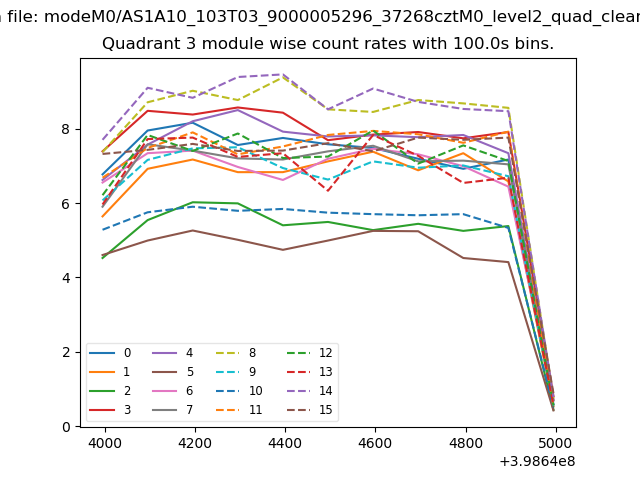
| Module-wise count rates for Quadrant A Data is divided into 100 sec bins |
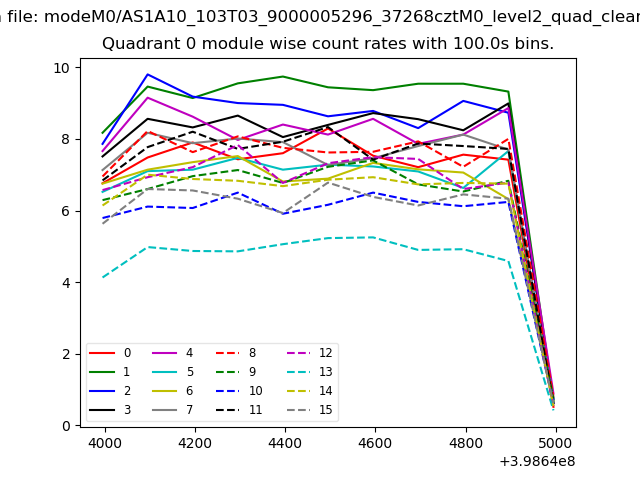 |
 |
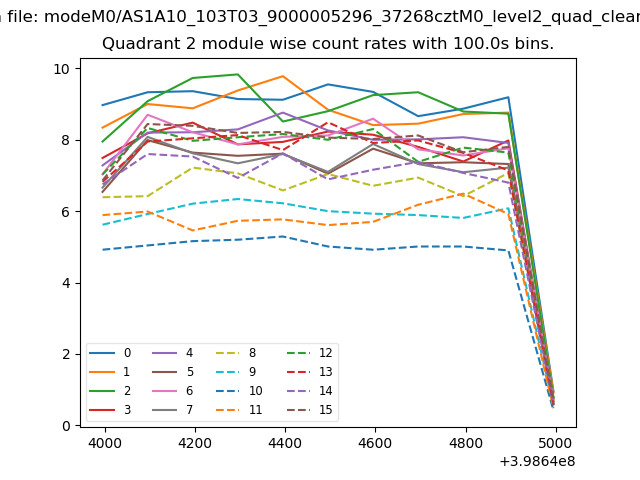
| Module-wise count rates for Quadrant B Data is divided into 100 sec bins |
 |
 |
| Module-wise count rates for Quadrant C Data is divided into 100 sec bins |
 |
 |
| Module-wise count rates for Quadrant D Data is divided into 100 sec bins |
 |
 |
| Parameter | Plot |
|---|---|
| CZT HV Monitor |  |
| D_VDD | 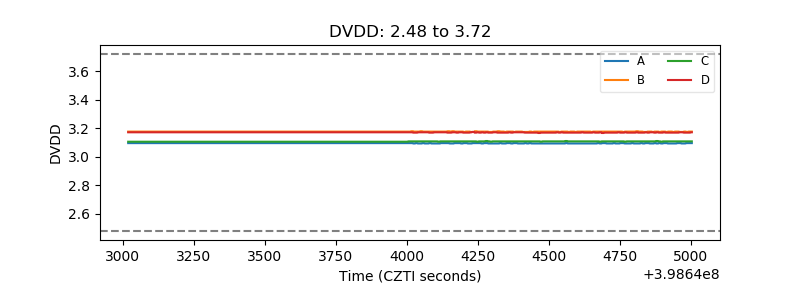 |
| Temperature 1 | 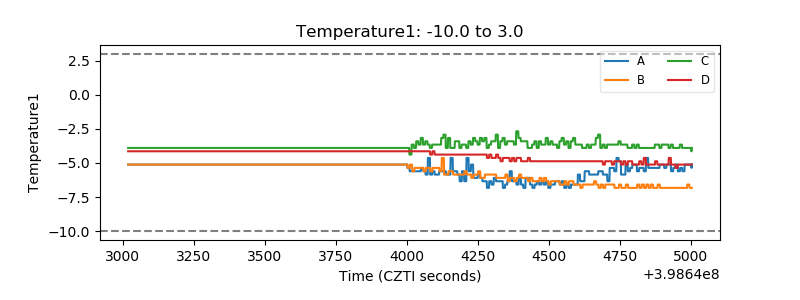 |
| Veto HV Monitor | 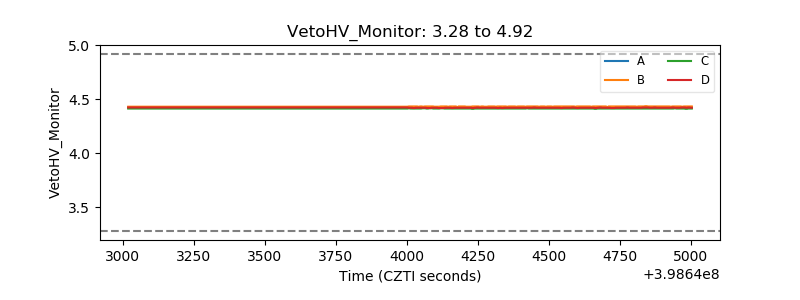 |
| Veto LLD | 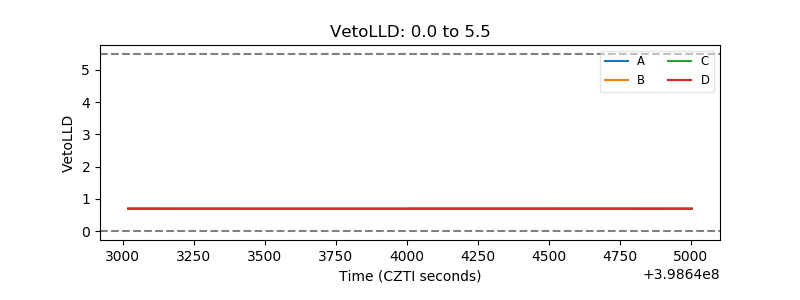 |
| Alpha Counter | 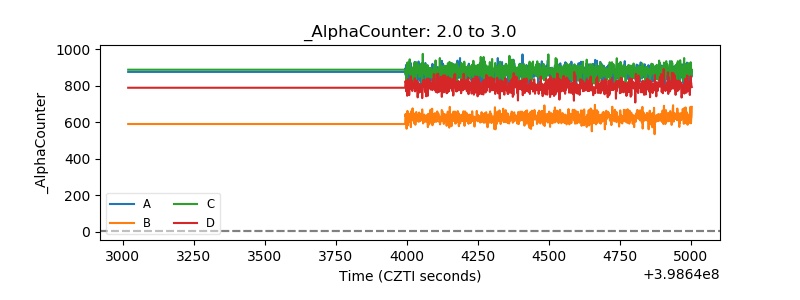 |
| _CPM_Rate | 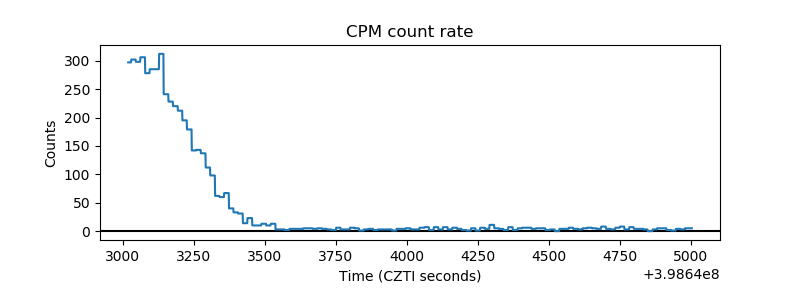 |
| CZT Counter | 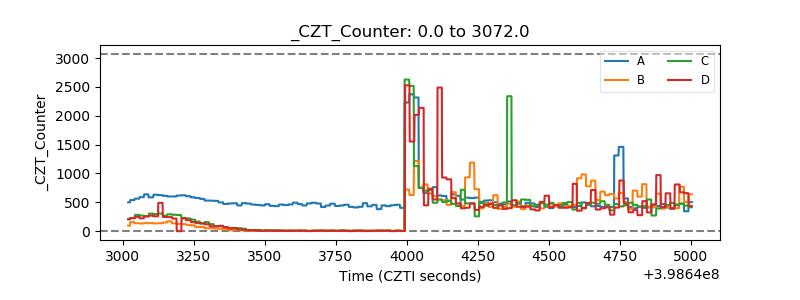 |
| +2.5 Volts monitor | 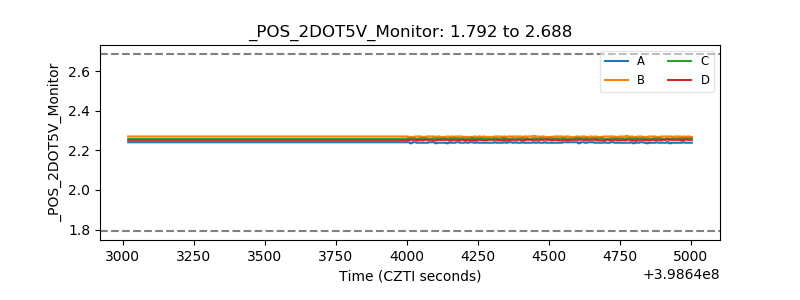 |
| +5 Volts monitor | 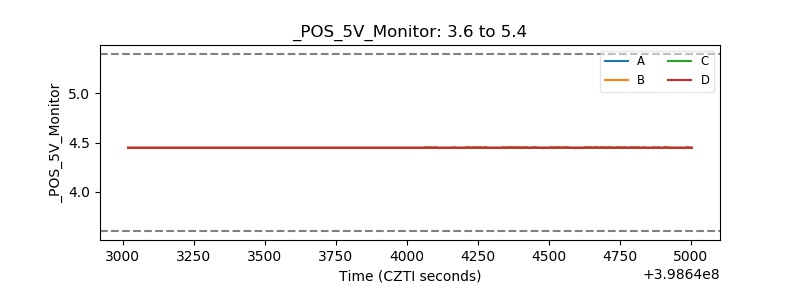 |
| _ROLL_ROT | 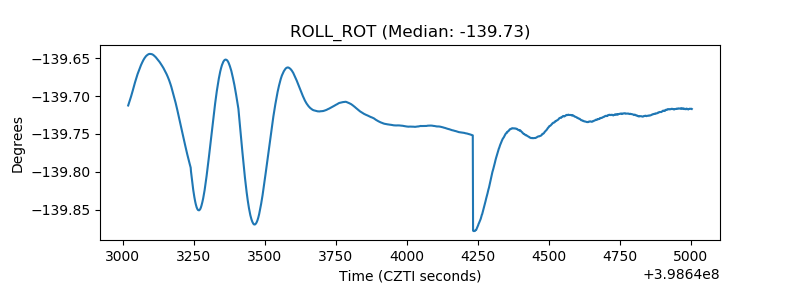 |
| _Roll_DEC |  |
| _Roll_RA | 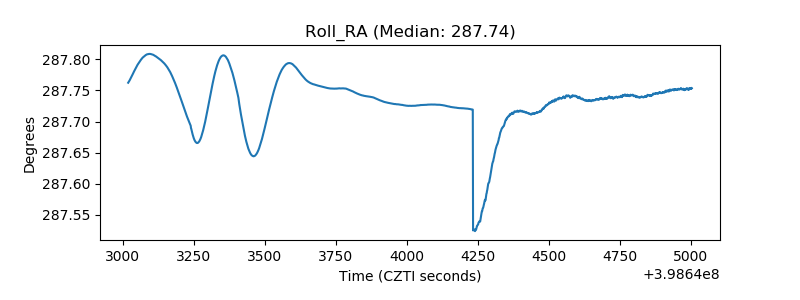 |
| Veto Counter | 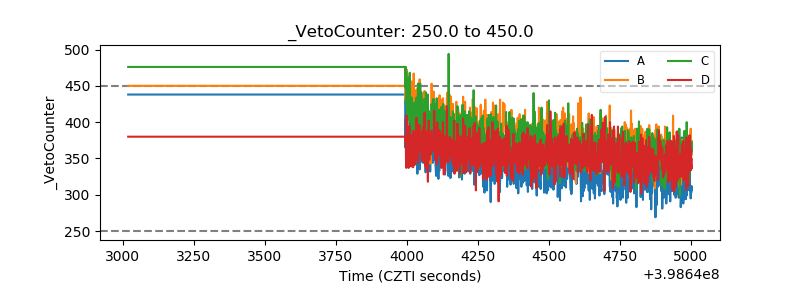 |